Housing density: 3,805 houses/condos per square mile
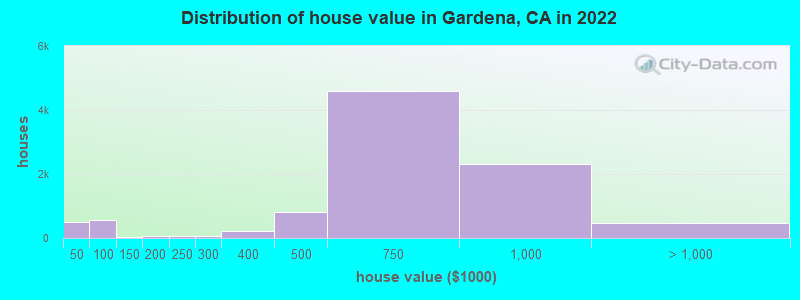
Median price asked for vacant for-sale houses and condos in 2022: $659,851.
Median contract rent in 2022: $1,545 (lower quartile is $1,197, upper quartile is $1,922)
Median rent asked for vacant for-rent units in 2022: $2,002
Median gross rent in Gardena, CA in 2022: $1,638
Housing units in Gardena with a mortgage: 6,247 (529 second mortgage, 50 home equity loan, 406 both second mortgage and home equity loan) Houses without a mortgage: 99
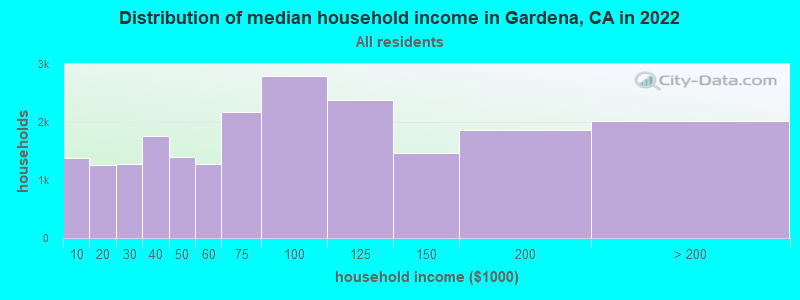
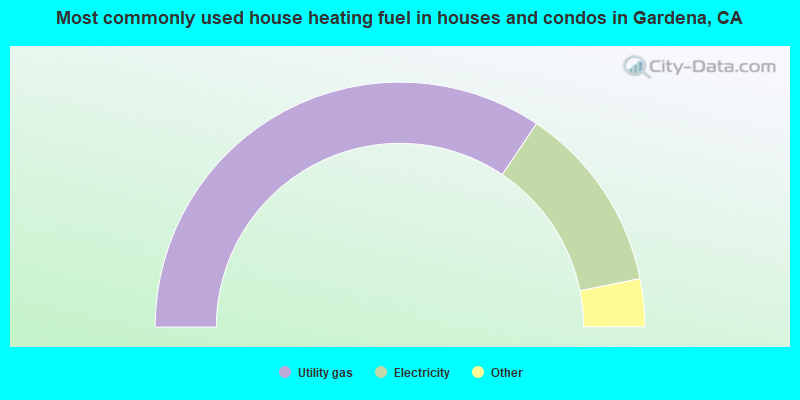
Median household income for houses/condos with a mortgage: $116,003
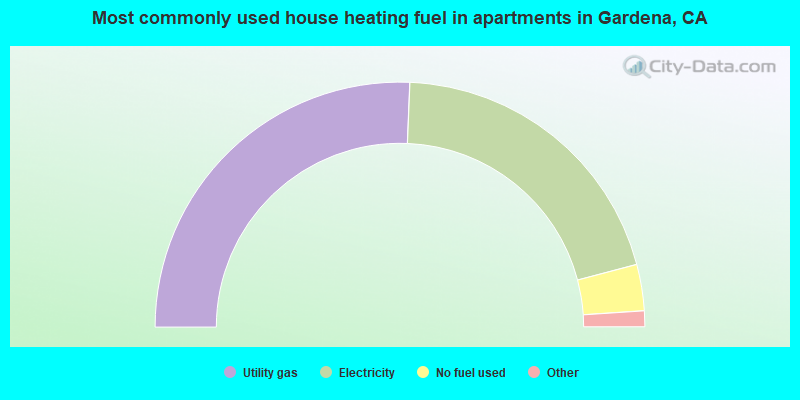
Median household income for apartments without a mortgage: $72,686
5,868 married couples with children.
3,586 single-parent households (1,206 men, 2,380 women).
46.0% of residents of Gardena speak English at home.
33.9% of residents speak Spanish at home (52% speak English very well, 22% speak English well, 18% speak English not well, 8% don't speak English at all).
2.0% of residents speak other Indo-European language at home (56% speak English very well, 25% speak English well, 13% speak English not well, 7% don't speak English at all).
16.7% of residents speak Asian or Pacific Island language at home (39% speak English very well, 30% speak English well, 27% speak English not well, 4% don't speak English at all).
2.0% of residents speak other language at home (84% speak English very well, 10% speak English well, 5% speak English not well, 1% don't speak English at all).
Foreign born population: 22,391 (37.9%)
(55.1% of them are naturalized citizens)
Percentage of workers working in this county: 95.9% Number of people working at home: 3,145 (10.4% of all workers)
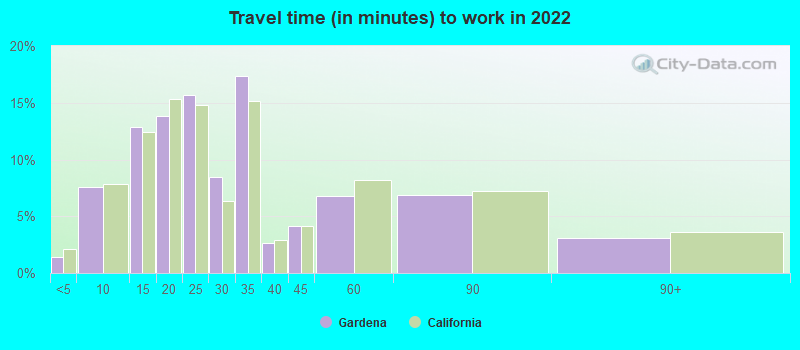
Travel time to work (commute)
Less than 5 minutes: 313
5 to 9 minutes: 1,547
10 to 14 minutes: 2,991
15 to 19 minutes: 4,290
20 to 24 minutes: 4,318
25 to 29 minutes: 2,374
30 to 34 minutes: 4,236
35 to 39 minutes: 974
40 to 44 minutes: 764
45 to 59 minutes: 2,475
60 to 89 minutes: 1,840
90 or more minutes: 547
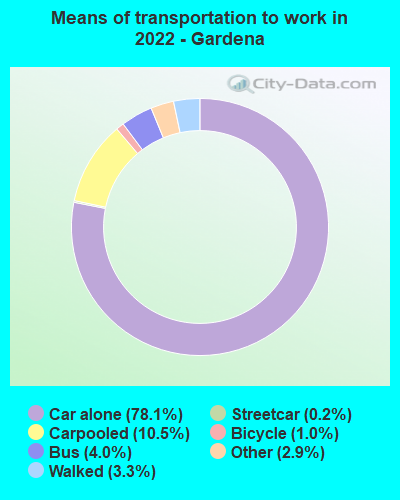
Means of transportation to work:
Drove a car alone: 22,663 (68.6%)
Carpooled: 3,374 (10.2%)
Bus: 1,049 (3.2%)
Subway or elevated rail: 48 (0.1%)
Long-distance train or commuter rail: 10 (0.0%)
Taxi: 920 (2.8%)
Bicycle: 291 (0.9%)
Walked: 1,034 (3.1%)
Worked at home: 3,145 (9.5%)
Unemployment by race in 2022
Unemployment rate for White non-Hispanic residents
3.9%Males
5.3%Females
Unemployment rate for Black residents
2.9%Males
4.3%Females
Unemployment rate for American Indian and Alaska Native residents
2.9%Males
7.6%Females
Unemployment rate for Asian residents
2.5%Males
3.3%Females
Unemployment rate for other race residents
4.4%Males
4.9%Females
Unemployment rate for two or more race residents
4.4%Males
0.9%Females
Unemployment rate for Hispanic or Latino residents
4.4%Males
3.5%Females
Year of entry for the foreign-born population in Gardena, California
4,0372010 or later
4,9852000 to 2009
5,1171990 to 1999
7,0321980 to 1989
3,7731970 to 1979
2,180Before 1970
First ancestries reported:
American: 1,350 (3.4%)
Nigerian: 705 (1.8%)
African: 385 (1.0%)
Belizean: 369 (0.9%)
German: 303 (0.8%)
Italian: 287 (0.7%)
Brazilian: 271 (0.7%)
Irish: 259 (0.7%)
English: 228 (0.6%)
Ghanaian: 186 (0.5%)
European: 108 (0.3%)
Haitian: 85 (0.2%)
Jordanian: 70 (0.2%)
Polish: 50 (0.1%)
Norwegian: 49 (0.1%)
Scottish: 49 (0.1%)
Egyptian: 46 (0.1%)
Portuguese: 44 (0.1%)
Russian: 37 (0.09%)
French: 36 (0.09%)
Slovene: 35 (0.09%)
Jamaican: 31 (0.08%)
Ukrainian: 30 (0.08%)
Australian: 29 (0.07%)
Armenian: 27 (0.07%)
Romanian: 23 (0.06%)
Scandinavian: 19 (0.05%)
Welsh: 16 (0.04%)
British: 15 (0.04%)
Trinidadian and Tobagonian: 13 (0.03%)
Serbian: 9 (0.02%)
Swedish: 9 (0.02%)
French Canadian: 8 (0.02%)
Lithuanian: 8 (0.02%)
Iranian: 7 (0.02%)
Eastern European: 7 (0.02%)
Ethiopian: 7 (0.02%)
Swiss: 7 (0.02%)
Dutch: 7 (0.02%)
Lebanese: 7 (0.02%)
Afghan: 6 (0.02%)
Danish: 5 (0.01%)
Slovak: 4 (0.01%)
Most common places of birth for foreign-born residents (%):
Mexico
Gardena:
30.3% (6,780)
California:
37.2% (3,881,193)
Korea
Gardena:
11.2% (2,499)
California:
3.0% (315,248)
Japan
Gardena:
8.0% (1,791)
California:
1.0% (103,575)
Philippines
Gardena:
7.0% (1,567)
California:
7.8% (818,297)
Guatemala
Gardena:
6.8% (1,512)
California:
2.8% (290,436)
Vietnam
Gardena:
6.6% (1,469)
California:
4.9% (512,335)
El Salvador
Gardena:
5.8% (1,289)
California:
4.2% (440,287)
Nigeria
Gardena:
3.5% (784)
California:
0.3% (35,557)
Peru
Gardena:
1.8% (396)
California:
0.7% (74,025)
China, excluding Hong Kong and Taiwan
Gardena:
1.6% (368)
California:
6.6% (684,672)
Belize
Gardena:
1.6% (365)
California:
0.2% (15,693)
Brazil
Gardena:
1.6% (354)
California:
0.5% (53,222)
Place of birth for U.S.-born residents:
This state: 29,369
Other state: 6,390
Northeast: 784
Midwest: 1,481
South: 2,757
West: 1,321
90.6% of Gardena residents lived in the same house 1 years ago. Out of people who lived in different houses, 42.8% lived in this county. Out of people who lived in different counties, 53.1% lived in California.
Gardena:
90.6%
State average:
88.9%
Education attainment for males 25 years and older:
No schooling: 1,025
Nursery to 4th grade: 211
5th and 6th grade: 634
7th and 8th grade: 403
9th grade: 571
10th grade: 181
11th grade: 291
12th grade, no diploma: 907
High school graduate (or equivalency): 4,892
Less than 1 year of college: 1,317
Some college more than 1 year, no degree: 3,033
Associate degree: 1,411
Bachelor's degree: 3,690
Master's degree: 1,310
Professional school degree: 317
Doctorate degree: 183
Education attainment for females 25 years and older:
No schooling: 972
Nursery to 4th grade: 512
5th and 6th grade: 679
7th and 8th grade: 456
9th grade: 339
10th grade: 210
11th grade: 244
12th grade, no diploma: 723
High school graduate (or equivalency): 4,962
Less than 1 year of college: 1,359
Some college more than 1 year, no degree: 3,539
Associate degree: 2,039
Bachelor's degree: 4,753
Master's degree: 1,134
Professional school degree: 299
Doctorate degree: 195
Housing units in structures:
One, detached: 9,083
One, attached: 2,231
Two: 670
3 or 4: 2,114
5 to 9: 2,098
10 to 19: 2,054
20 to 49: 1,744
50 or more: 723
Mobile homes: 1,399
Boats, RVs, vans, etc.: 23
Median worth of mobile homes: $56,898
Housing units lacking complete plumbing facilities in 2022: 1.2%
Housing units lacking complete kitchen facilities in 2022: 3.2%
House/condo owner moved in on average 17 years ago