Gardner, MA (Massachusetts) Houses and Residents
| Gardner: | $264,449 |
| Massachusetts: | $534,700 |
Mean price in 2022:
Detached houses: $309,515
Here: $309,515 State: $651,570 Townhouses or other attached units: $248,880
Here: $248,880 State: $617,749 In 2-unit structures: $261,211
Here: $261,211 State: $594,808 In 3-to-4-unit structures: $324,725
Here: $324,725 State: $601,912 In 5-or-more-unit structures: $155,609
Here: $155,609 State: $555,768 Mobile homes: $133,433
Here: $133,433 State: $170,209
Total population: 20,381 (Urban population: 19,549, Rural population: 1,221 (all nonfarm))
Houses: 9,688 (8,977 occupied: 5,236 owner occupied, 3,844 renter occupied)
| % of renters here: | 42% |
| State: | 38% |
Housing density: 437 houses/condos per square mile
Median price asked for vacant for-sale houses and condos in 2022: $578,201.
Median contract rent in 2022: $948 (lower quartile is $722, upper quartile is $1,145)
Median rent asked for vacant for-rent units in 2022: $1,003
Median gross rent in Gardner, MA in 2022: $1,090
Housing units in Gardner with a mortgage: 3,027 (401 second mortgage, 10 home equity loan, 343 both second mortgage and home equity loan)
Houses without a mortgage: 47
Median household income for houses/condos with a mortgage: $95,062
Median household income for apartments without a mortgage: $58,355
Median monthly housing costs: $1,136
Compare current foreclosures in Gardner, MA:
| Photo | Address | Area | Beds / Baths | Price | Details |
|---|---|---|---|---|---|

|
#1
Parker St
Gardner, MA 01440
|
1,980 sq. feet
|
2 baths 4 beds |
$469,900
|
show details |

|
#2
Summer St
Gardner, MA 01440
|
1,893 sq. feet
|
2 baths 5 beds |
show details | |

|
#3
Chelsea St
Gardner, MA 01440
|
1,404 sq. feet
|
2 baths 3 beds |
show details | |

|
#4
Parker St
Gardner, MA 01440
|
2,075 sq. feet
|
2 baths 4 beds |
show details | |

|
#5
Travers St
Gardner, MA 01440
|
660 sq. feet
|
1 baths 1 beds |
show details | |

|
#6
Pelley St
Gardner, MA 01440
|
1,011 sq. feet
|
2 baths 3 beds |
show details | |

|
#7
Emerald St
Gardner, MA 01440
|
1,428 sq. feet
|
1 baths 2 beds |
show details | |

|
#8
Leo Dr
Gardner, MA 01440
|
1,206 sq. feet
|
1 baths 3 beds |
show details | |

|
#9
Sawyer St
Gardner, MA 01440
|
1,747 sq. feet
|
1 baths 2 beds |
show details | |

|
#10
West St
Gardner, MA 01440
|
1,320 sq. feet
|
2 baths 3 beds |
show details |
| Photo | Address | Area | Beds / Baths | Price | Details |
|---|---|---|---|---|---|

|
#11
Edgell St
Gardner, MA 01440
|
4,746 sq. feet
|
2 baths 9 beds |
show details | |

|
#12
Linwood St
Gardner, MA 01440
|
1,828 sq. feet
|
1 baths 3 beds |
show details | |

|
#13
Mill St
Gardner, MA 01440
|
1,728 sq. feet
|
1 baths 4 beds |
show details | |

|
#14
Pine St
Gardner, MA 01440
|
3,228 sq. feet
|
2 baths 4 beds |
show details | |

|
#15
Barthel Ave
Gardner, MA 01440
|
1,007 sq. feet
|
1 baths 2 beds |
show details | |

|
#16
Willis Rd
Gardner, MA 01440
|
2,451 sq. feet
|
2 baths 3 beds |
show details | |

|
#17
Whitney St
Gardner, MA 01440
|
2,026 sq. feet
|
2 baths 3 beds |
show details | |

|
#18
Green St
Gardner, MA 01440
|
3,156 sq. feet
|
2 baths 4 beds |
show details | |

|
#19
Pearly Ln
Gardner, MA 01440
|
1,728 sq. feet
|
2 baths 4 beds |
show details | |

|
#20
Linwood St
Gardner, MA 01440
|
900 sq. feet
|
1 baths 3 beds |
show details |
| Photo | Address | Area | Beds / Baths | Price | Details |
|---|---|---|---|---|---|

|
#21
Bickford Hill Rd
Gardner, MA 01440
|
1,320 sq. feet
|
2 baths 3 beds |
show details | |

|
#22
Greenwood Pl
Gardner, MA 01440
|
1,206 sq. feet
|
1 baths 2 beds |
show details | |

|
#23
Pine St
Gardner, MA 01440
|
3,228 sq. feet
|
2 baths 4 beds |
show details | |

|
#24
Emerald St
Gardner, MA 01440
|
1,428 sq. feet
|
1 baths 2 beds |
show details | |

|
#25
Sawyer St
Gardner, MA 01440
|
1,280 sq. feet
|
2 baths 3 beds |
show details | |

|
#26
Chelsea St
Gardner, MA 01440
|
1,498 sq. feet
|
1 baths 3 beds |
show details | |

|
#27
Lakewood Ter
Gardner, MA 01440
|
3,143 sq. feet
|
4 baths 5 beds |
show details | |

|
#28
Prospect St
Gardner, MA 01440
|
1,357 sq. feet
|
2 baths 3 beds |
show details | |

|
#29
Stone St
Gardner, MA 01440
|
1,908 sq. feet
|
2 baths 3 beds |
show details | |

|
#30
Leo Dr
Gardner, MA 01440
|
- sq. feet
|
- baths - beds |
show details |
| Photo | Address | Area | Beds / Baths | Price | Details |
|---|---|---|---|---|---|

|
#31
Park St
Gardner, MA 01440
|
- sq. feet
|
- baths - beds |
show details | |

|
#32
Sunrise Ln
Gardner, MA 01440
|
- sq. feet
|
- baths - beds |
show details | |

|
#33
Pine St Apt 2r
Gardner, MA 01440
|
- sq. feet
|
- baths - beds |
show details | |

|
#34
Green St
Gardner, MA 01440
|
- sq. feet
|
- baths - beds |
show details | |

|
Check over 1 million property listings on Foreclosure.com!
|
browse all offers | |||

Latest news about housing in Gardner, MA collected exclusively by city-data.com from local newspapers, TV, and radio stations


Median year apartment built: 1956
Household type by relationship:
Households: 21,188- Male householders: 4,240 (1,397 living alone), Female householders: 4,672 (1,222 living alone)
3,638 spouses (3,619 opposite-sex spouses), 1,063 unmarried partners, (1,060 opposite-sex unmarried partners), 4,528 children (4,208 natural, 127 adopted, 191 stepchildren), 745 grandchildren, 207 brothers or sisters, 187 parents, 129 foster children, 165 other relatives, 494 non-relatives
- In group quarters: 1,113
Size of family households: 2,867 2-persons, 1,364 3-persons, 1,054 4-persons, 154 5-persons, 27 6-persons, 45 7-or-more-persons.
Size of nonfamily households: 2,706 1-person, 862 2-persons, 11 3-persons, 84 4-persons.
1,573 married couples with children.
1,470 single-parent households (492 men, 978 women).
87.5% of residents of Gardner speak English at home.
4.6% of residents speak Spanish at home (51% speak English very well, 32% speak English well, 16% speak English not well, 1% don't speak English at all).
4.5% of residents speak other Indo-European language at home (89% speak English very well, 11% speak English well).
1.9% of residents speak Asian or Pacific Island language at home (72% speak English very well, 6% speak English well, 22% speak English not well).
0.6% of residents speak other language at home (67% speak English very well, 13% speak English well, 20% speak English not well).
Foreign born population: 1,902 (9.0%)
(67.6% of them are naturalized citizens)
| Here: | 6.0 |
| State: | 6.5 |
| Here: | 4.2 |
| State: | 4.0 |

- Bedrooms in owner-occupied houses and condos in Gardner, Massachusetts
- 0no bedroom
- 1991 bedroom
- 1,4612 bedrooms
- 2,4663 bedrooms
- 9414 bedrooms
- 1715+ bedrooms

- Bedrooms in renter-occupied apartments in Gardner, Massachusetts
- 238no bedroom
- 1,1171 bedroom
- 1,7232 bedrooms
- 6483 bedrooms
- 1174 bedrooms
- 25+ bedrooms

- Cars and other vehicles available in Gardner in owner-occupied houses/condos
- 108no vehicle
- 1,3061 vehicle
- 2,5942 vehicles
- 8353 vehicles
- 2854 vehicles
- 1085+ vehicles

- Cars and other vehicles available in Gardner in renter-occupied apartments
- 807no vehicle
- 2,1871 vehicle
- 6292 vehicles
- 983 vehicles
- 394 vehicles
- 845+ vehicles

- Rooms in owner-occupied houses in Gardner, Massachusetts
- 01 room
- 172 rooms
- 1203 rooms
- 7764 rooms
- 9815 rooms
- 1,3136 rooms
- 9067 rooms
- 5898 rooms
- 5359+ rooms

- Rooms in renter-occupied apartments in Gardner, Massachusetts
- 2201 room
- 1902 rooms
- 8533 rooms
- 1,0544 rooms
- 8735 rooms
- 4436 rooms
- 1127 rooms
- 978 rooms
- 29+ rooms


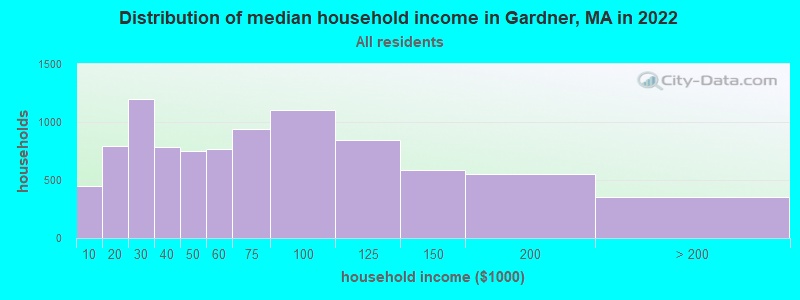
Gardner, MA household income distribution

- 445Less than $10,000
- 794$10,000 to $19,999
- 1,201$20,000 to $29,999
- 782$30,000 to $39,999
- 746$40,000 to $49,999
- 768$50,000 to $59,999
- 943$60,000 to $74,999
- 1,103$75,000 to $99,999
- 844$100,000 to $124,999
- 584$125,000 to $149,999
- 548$150,000 to $199,999
- 352$200,000 or more
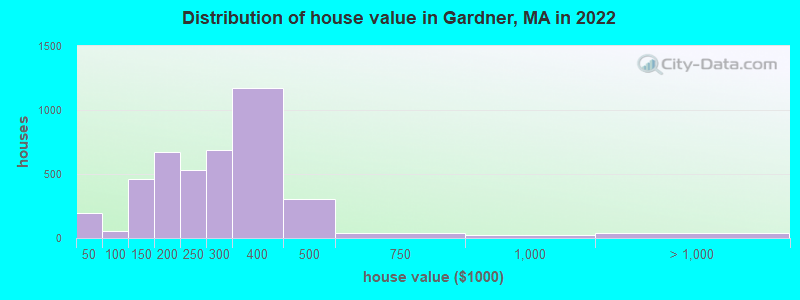
Home value of owner - occupied houses in 2022 in Gardner, MA
-
- 43Less than $10,000
- 63$10,000 to $14,999
- 30$20,000 to $24,999
- 22$25,000 to $29,999
- 10$30,000 to $34,999
- 21$35,000 to $39,999
- 5$40,000 to $49,999
- 9$50,000 to $59,999
- 12$70,000 to $79,999
- 7$80,000 to $89,999
- 23$90,000 to $99,999
- 220$100,000 to $124,999
- 237$125,000 to $149,999
- 381$150,000 to $174,999
- 292$175,000 to $199,999
- 527$200,000 to $249,999
- 685$250,000 to $299,999
- 1,174$300,000 to $399,999
- 307$400,000 to $499,999
- 42$500,000 to $749,999
- 20$750,000 to $999,999
- 13$1,500,000 to $1,999,999
- 24$2,000,000 or more
Rent paid by renters in 2022 in Gardner, MA
-
- 21$150 to $199
- 31$200 to $249
- 101$250 to $299
- 11$300 to $349
- 84$350 to $399
- 66$400 to $449
- 217$450 to $499
- 154$500 to $549
- 49$550 to $599
- 104$600 to $649
- 105$650 to $699
- 73$700 to $749
- 192$750 to $799
- 515$800 to $899
- 770$900 to $999
- 932$1,000 to $1,249
- 287$1,250 to $1,499
- 20$1,500 to $1,999
- 60$2,500 to $2,999
- 146No cash rent


Percentage of workers working in this county: 84.7%
Number of people working at home: 1,150 (12.1% of all workers)
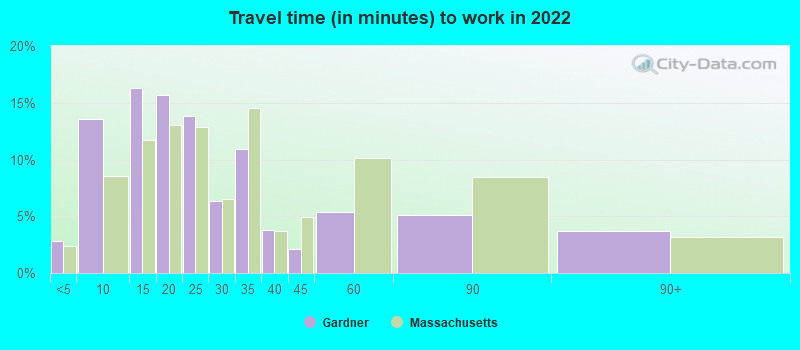
Travel time to work (commute)
- Less than 5 minutes: 235
- 5 to 9 minutes: 1,089
- 10 to 14 minutes: 1,091
- 15 to 19 minutes: 689
- 20 to 24 minutes: 631
- 25 to 29 minutes: 279
- 30 to 34 minutes: 1,358
- 35 to 39 minutes: 216
- 40 to 44 minutes: 389
- 45 to 59 minutes: 1,248
- 60 to 89 minutes: 653
- 90 or more minutes: 298
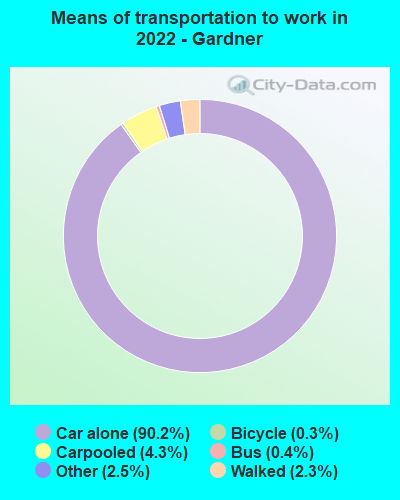
Means of transportation to work:
- Drove a car alone: 6,515 (76.9%)
- Carpooled: 329 (3.9%)
- Bus: 37 (0.4%)
- Taxi: 226 (2.7%)
- Bicycle: 12 (0.1%)
- Walked: 124 (1.5%)
- Worked at home: 1,150 (13.6%)

- Unemployment by race in 2022
- Unemployment rate for White non-Hispanic residents
- 6.7%Males
- 4.4%Females
- Unemployment rate for Black residents
- 32.8%Males
- Unemployment rate for American Indian and Alaska Native residents
- 100.0%Males
- Unemployment rate for two or more race residents
- 2.5%Males
- 4.8%Females

- Year of entry for the foreign-born population in Gardner, Massachusetts
- 1222010 or later
- 2792000 to 2009
- 2671990 to 1999
- 2191980 to 1989
- 741970 to 1979
- 925Before 1970
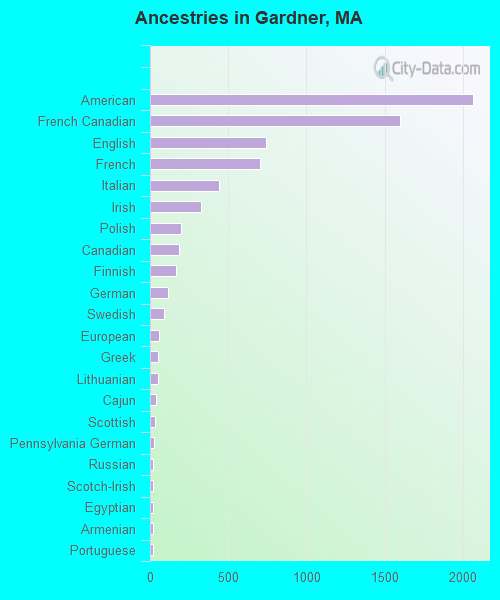
First ancestries reported:
- American: 2,064 (21.4%)
- French Canadian: 1,596 (16.6%)
- English: 740 (7.7%)
- French: 701 (7.3%)
- Italian: 441 (4.6%)
- Irish: 326 (3.4%)
- Polish: 198 (2.1%)
- Canadian: 185 (1.9%)
- Finnish: 164 (1.7%)
- German: 115 (1.2%)
- Swedish: 87 (0.9%)
- European: 60 (0.6%)
- Greek: 54 (0.6%)
- Lithuanian: 54 (0.6%)
- Cajun: 41 (0.4%)
- Scottish: 29 (0.3%)
- Pennsylvania German: 23 (0.2%)
- Russian: 22 (0.2%)
- Scotch-Irish: 21 (0.2%)
- Egyptian: 19 (0.2%)
- Armenian: 19 (0.2%)
- Portuguese: 19 (0.2%)
- Ukrainian: 14 (0.1%)
- British: 13 (0.1%)
- Lebanese: 11 (0.1%)
- Trinidadian and Tobagonian: 10 (0.1%)
- Cape Verdean: 9 (0.09%)
- Eastern European: 6 (0.06%)
- African: 4 (0.04%)
- Haitian: 4 (0.04%)
Most common places of birth for foreign-born residents (%):
| Gardner: | 36.3% (678) |
| Massachusetts: | 2.3% (28,158) |
| Gardner: | 24.3% (453) |
| Massachusetts: | 0.2% (2,448) |
| Gardner: | 7.3% (136) |
| Massachusetts: | 0.2% (2,282) |
| Gardner: | 5.5% (103) |
| Massachusetts: | 0.5% (6,109) |
| Gardner: | 4.6% (85) |
| Massachusetts: | 1.4% (17,613) |
| Gardner: | 4.1% (76) |
| Massachusetts: | 8.3% (101,767) |
| Gardner: | 3.3% (62) |
| Massachusetts: | 6.8% (82,934) |
| Gardner: | 2.2% (42) |
| Massachusetts: | 1.1% (13,065) |
| Gardner: | 2.1% (40) |
| Massachusetts: | 0.4% (5,208) |
| Gardner: | 1.9% (36) |
| Massachusetts: | 0.9% (10,810) |
| Gardner: | 1.8% (34) |
| Massachusetts: | 3.0% (37,197) |
| Gardner: | 1.6% (30) |
| Massachusetts: | 0.8% (10,043) |
Place of birth for U.S.-born residents:
- This state: 15,897
- Other state: 2,589
- Northeast: 1,353
- Midwest: 386
- South: 680
- West: 195
93.3% of Gardner residents lived in the same house 1 years ago.
Out of people who lived in different houses, 40.1% lived in this county.
Out of people who lived in different counties, 84.6% lived in Massachusetts.
| Gardner: | 93.3% |
| State average: | 87.7% |
Education attainment for males 25 years and older:
- No schooling: 194
- Nursery to 4th grade: 4
- 5th and 6th grade: 26
- 7th and 8th grade: 283
- 9th grade: 107
- 10th grade: 230
- 11th grade: 375
- 12th grade, no diploma: 259
- High school graduate (or equivalency): 3,366
- Less than 1 year of college: 884
- Some college more than 1 year, no degree: 794
- Associate degree: 738
- Bachelor's degree: 1,110
- Master's degree: 267
- Professional school degree: 23
- Doctorate degree: 51

Education attainment for females 25 years and older:
- No schooling: 151
- Nursery to 4th grade: 2
- 5th and 6th grade: 39
- 7th and 8th grade: 40
- 9th grade: 88
- 10th grade: 102
- 11th grade: 22
- 12th grade, no diploma: 111
- High school graduate (or equivalency): 2,419
- Less than 1 year of college: 885
- Some college more than 1 year, no degree: 1,069
- Associate degree: 1,204
- Bachelor's degree: 957
- Master's degree: 610
- Professional school degree: 63
- Doctorate degree: 23


Housing units in structures:
- One, detached: 4,690
- One, attached: 366
- Two: 1,030
- 3 or 4: 1,141
- 5 to 9: 572
- 10 to 19: 429
- 20 to 49: 581
- 50 or more: 729
- Mobile homes: 137
- Boats, RVs, vans, etc.: 10
Median worth of mobile homes: $120,964
Housing units lacking complete kitchen facilities in 2022: 2.2%
House/condo owner moved in on average 12 years ago
Renter moved in on average 5 years ago

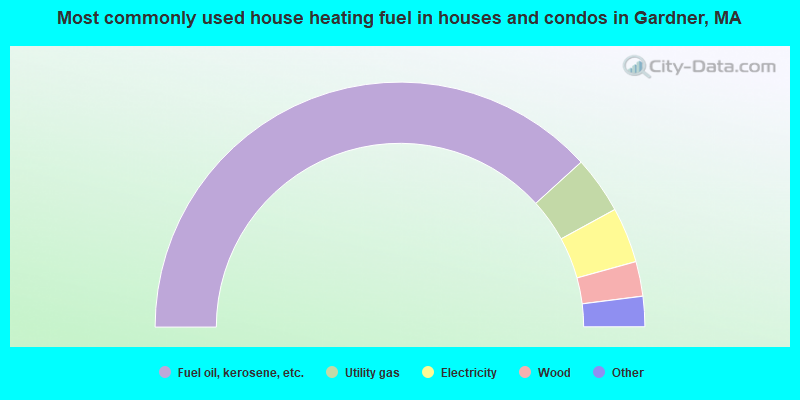
- 76.5%Fuel oil, kerosene, etc.
- 7.6%Utility gas
- 7.3%Electricity
- 4.6%Wood
- 2.7%Bottled, tank, or LP gas
- 1.3%Other fuel
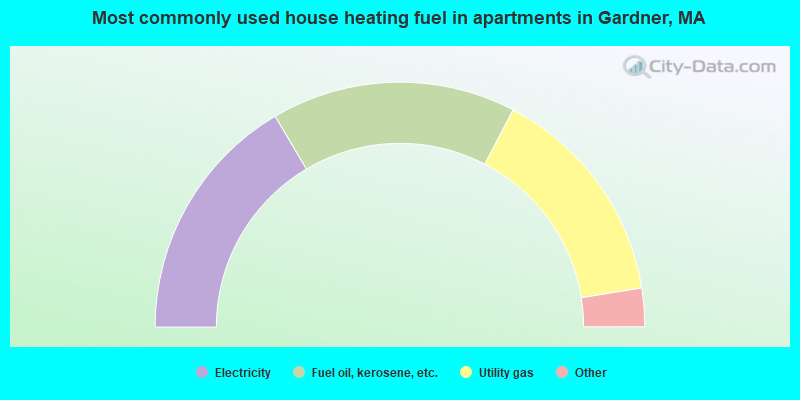
- 33.0%Electricity
- 32.3%Fuel oil, kerosene, etc.
- 29.6%Utility gas
- 3.5%Bottled, tank, or LP gas
- 1.0%Other fuel
- 0.6%No fuel used
Private vs. public school enrollment:
| Here: | 9.9% |
| Massachusetts: | 10.3% |
| Here: | 0.9% |
| Massachusetts: | 12.3% |
| Here: | 28.0% |
| Massachusetts: | 51.2% |


