Garland, NC (North Carolina) Houses and Residents
| Garland: | $126,503 |
| North Carolina: | $280,600 |
Mean price in 2022:
Detached houses: $149,339
Here: $149,339 State: $375,326 Mobile homes: $102,622
Here: $102,622 State: $124,933
Total population: 635 (Urban population: 0, Rural population: 806 (14 farm, 792 nonfarm))
Houses: 394 (317 occupied: 203 owner occupied, 119 renter occupied)
| % of renters here: | 37% |
| State: | 33% |
Housing density: 366 houses/condos per square mile
Median price asked for vacant for-sale houses and condos in 2022: $285,700.
Median contract rent in 2022: $692 (lower quartile is $529, upper quartile is $879)
Median rent asked for vacant for-rent units in 2022: $745
Median gross rent in Garland, NC in 2022: $909
Housing units in Garland with a mortgage: 78 (0 second mortgage, 0 home equity loan, 0 both second mortgage and home equity loan)
Houses without a mortgage: 0
Median household income for houses/condos with a mortgage: $33,041
Median household income for apartments without a mortgage: $57,289
Median monthly housing costs: $817
Compare current foreclosures near Garland, NC:
| Photo | Address | Area | Beds / Baths | Price | Details |
|---|---|---|---|---|---|

|
#1
Us Highway 701 N
Garland, NC 28441
|
- sq. feet
|
- baths - beds |
show details | |

|
#2
Gibbs Rd
Garland, NC 28441
|
- sq. feet
|
- baths - beds |
show details | |

|
#3
Nc Hwy 210 W
Garland, NC 28441
|
- sq. feet
|
- baths - beds |
show details | |

|
#4
N Powell St
Garland, NC 28441
|
- sq. feet
|
- baths - beds |
show details | |

|
#5
W Powell St
Clinton, NC 28328
|
1,216 sq. feet
|
1 baths 2 beds |
$180,000
|
show details |

|
#6
Summertree Ct
Clinton, NC 28328
|
1,784 sq. feet
|
3 baths 3 beds |
show details | |

|
#7
Willow Rd
Clinton, NC 28328
|
2,008 sq. feet
|
2 baths 4 beds |
show details | |

|
#8
Knorr Ln
Clinton, NC 28328
|
1,514 sq. feet
|
2 baths 3 beds |
show details | |

|
#9
Midway St
Autryville, NC 28318
|
1,620 sq. feet
|
2 baths 3 beds |
show details | |

|
#10
Marple St
Roseboro, NC 28382
|
1,375 sq. feet
|
2 baths 3 beds |
show details |
| Photo | Address | Area | Beds / Baths | Price | Details |
|---|---|---|---|---|---|

|
#11
Reedsford Rd
Clinton, NC 28328
|
- sq. feet
|
2 baths 3 beds |
show details | |

|
#12
Beaver Dam Church Rd
Roseboro, NC 28382
|
1,622 sq. feet
|
2 baths 3 beds |
show details | |

|
#13
S Horse Pen Rd
Harrells, NC 28444
|
2,709 sq. feet
|
5 baths - beds |
show details | |

|
#14
Josephus Rd
Rose Hill, NC 28458
|
- sq. feet
|
- baths - beds |
show details | |

|
#15
Devane St
Clinton, NC 28328
|
- sq. feet
|
- baths - beds |
show details | |

|
#16
Sasser Ln
Clinton, NC 28328
|
- sq. feet
|
- baths - beds |
show details | |

|
#17
Nc Highway 242 N
Elizabethtown, NC 28337
|
- sq. feet
|
- baths - beds |
show details | |

|
#18
Nc Hwy 210
Roseboro, NC 28382
|
- sq. feet
|
- baths - beds |
show details | |

|
#19
Delway Hwy
Rose Hill, NC 28458
|
- sq. feet
|
- baths - beds |
show details | |

|
#20
Kea Ln
Clinton, NC 28328
|
- sq. feet
|
- baths - beds |
show details |
| Photo | Address | Area | Beds / Baths | Price | Details |
|---|---|---|---|---|---|

|
#21
Royal Ln
Clinton, NC 28328
|
- sq. feet
|
- baths - beds |
show details | |

|
#22
Pine Acres Ln
Clinton, NC 28328
|
- sq. feet
|
- baths - beds |
show details | |

|
#23
Nc Highway 210 E
Harrells, NC 28444
|
- sq. feet
|
- baths - beds |
show details | |

|
#24
Cove Pl
Clinton, NC 28328
|
- sq. feet
|
- baths - beds |
show details | |

|
#25
Faison Hwy Apt 31
Clinton, NC 28328
|
- sq. feet
|
- baths - beds |
show details | |

|
#26
Faison Hwy Apt 44
Clinton, NC 28328
|
- sq. feet
|
- baths - beds |
show details | |

|
#27
Biggs Ave
Elizabethtown, NC 28337
|
- sq. feet
|
- baths - beds |
show details | |

|
#28
Swanzy Ridge Way Apt 202
Elizabethtown, NC 28337
|
- sq. feet
|
- baths - beds |
show details | |

|
#29
Raleigh Rd
Clinton, NC 28328
|
- sq. feet
|
- baths - beds |
show details | |

|
#30
Wood Fair Ln
Salemburg, NC 28385
|
- sq. feet
|
- baths - beds |
show details |
| Photo | Address | Area | Beds / Baths | Price | Details |
|---|---|---|---|---|---|

|
#31
Dowd Dairy Rd
White Oak, NC 28399
|
1,792 sq. feet
|
- baths - beds |
show details | |

|
#32
Baytree Dr # B
Harrells, NC 28444
|
- sq. feet
|
- baths - beds |
show details | |

|
#33
Bull Tail Rd
Wallace, NC 28466
|
- sq. feet
|
- baths - beds |
show details | |

|
#34
Boykin Bridge Rd
Clinton, NC 28328
|
- sq. feet
|
- baths - beds |
show details | |

|
#35
Nc Highway 242 N
Elizabethtown, NC 28337
|
- sq. feet
|
- baths - beds |
show details | |

|
#36
Odell Ln
Ivanhoe, NC 28447
|
- sq. feet
|
- baths - beds |
show details | |

|
#37
E Carolina Ave
Elizabethtown, NC 28337
|
- sq. feet
|
- baths - beds |
show details | |

|
#38
Hagar Murphy Rd
Rose Hill, NC 28458
|
- sq. feet
|
- baths - beds |
show details | |

|
#39
Knorr Ln
Clinton, NC 28328
|
- sq. feet
|
- baths - beds |
show details | |

|
#40
Herring Rd
Rose Hill, NC 28458
|
- sq. feet
|
- baths - beds |
show details |
| Photo | Address | Area | Beds / Baths | Price | Details |
|---|---|---|---|---|---|

|
#41
Sir Ln
Roseboro, NC 28382
|
- sq. feet
|
- baths - beds |
show details | |

|
#42
Andrews Chapel Rd
Roseboro, NC 28382
|
- sq. feet
|
- baths - beds |
show details | |

|
#43
Wildcat Rd
Ivanhoe, NC 28447
|
- sq. feet
|
- baths - beds |
show details | |

|
#44
Quincy Reese Ln
Harrells, NC 28444
|
- sq. feet
|
- baths - beds |
show details | |

|
#45
Council Ln
Roseboro, NC 28382
|
- sq. feet
|
- baths - beds |
show details | |

|
#46
Cecil Odie Rd
Clinton, NC 28328
|
- sq. feet
|
- baths - beds |
show details | |

|
#47
W Elizabeth St
Clinton, NC 28328
|
- sq. feet
|
- baths - beds |
show details | |

|
#48
Lloyd St
Clinton, NC 28328
|
- sq. feet
|
- baths - beds |
show details | |

|
#49
Mill Creek Church Rd
Roseboro, NC 28382
|
- sq. feet
|
- baths - beds |
show details | |

|
Check over 1 million property listings on Foreclosure.com!
|
browse all offers | |||

Latest news about housing in Garland, NC collected exclusively by city-data.com from local newspapers, TV, and radio stations

 | How are the private, non-chain restaurants doing? (31 replies) |
| Those who lived here a decade ago-has Raleigh/Durham improved much? (119 replies) |
| Cary, Raleigh and Durham among the top 40 real estate markets nationally... Charlotte ranked 60th :shocked: (18 replies) |
| Raleigh vs Charlotte (2458 replies) |
| Why Durham is North Carolina's Hippest City (65 replies) |
| Charlotte vs. Raleigh? (8515 replies) |

Median year apartment built: 1976
Household type by relationship:
Households: 1,017- Male householders: 103 (12 living alone), Female householders: 211 (104 living alone)
78 spouses (78 opposite-sex spouses), 0 unmarried partners, (0 opposite-sex unmarried partners), 418 children (402 natural, 10 adopted, 6 stepchildren), 90 grandchildren, 12 brothers or sisters, 0 parents, 0 foster children, 49 other relatives, 47 non-relatives
- In group quarters: 6
Size of family households: 65 2-persons, 26 3-persons, 49 4-persons, 47 5-persons, 7 7-or-more-persons.
Size of nonfamily households: 118 1-person, 4 3-persons.
121 married couples with children.
32 single-parent households (8 men, 24 women).
79.4% of residents of Garland speak English at home.
19.7% of residents speak Spanish at home (5% speak English very well, 44% speak English well, 52% speak English not well).
0.1% of residents speak other Indo-European language at home (100% speak English very well).
Foreign born population: 115 (11.3%)
(0.9% of them are naturalized citizens)
| Here: | 6.3 |
| State: | 6.4 |
| Here: | 5.0 |
| State: | 4.4 |

- Bedrooms in owner-occupied houses and condos in Garland, North Carolina
- 0no bedroom
- 51 bedroom
- 362 bedrooms
- 903 bedrooms
- 694 bedrooms
- 35+ bedrooms

- Bedrooms in renter-occupied apartments in Garland, North Carolina
- 5no bedroom
- 21 bedroom
- 612 bedrooms
- 403 bedrooms
- 124 bedrooms
- 05+ bedrooms

- Cars and other vehicles available in Garland in owner-occupied houses/condos
- 7no vehicle
- 521 vehicle
- 742 vehicles
- 513 vehicles
- 184 vehicles
- 05+ vehicles

- Cars and other vehicles available in Garland in renter-occupied apartments
- 41no vehicle
- 401 vehicle
- 212 vehicles
- 23 vehicles
- 04 vehicles
- 165+ vehicles

- Rooms in owner-occupied houses in Garland, North Carolina
- 01 room
- 02 rooms
- 33 rooms
- 344 rooms
- 205 rooms
- 546 rooms
- 797 rooms
- 88 rooms
- 59+ rooms

- Rooms in renter-occupied apartments in Garland, North Carolina
- 51 room
- 02 rooms
- 53 rooms
- 174 rooms
- 665 rooms
- 06 rooms
- 197 rooms
- 28 rooms
- 59+ rooms


Garland, NC household income distribution

- 24Less than $10,000
- 38$10,000 to $19,999
- 48$20,000 to $29,999
- 42$30,000 to $39,999
- 23$40,000 to $49,999
- 24$50,000 to $59,999
- 84$60,000 to $74,999
- 20$75,000 to $99,999
- 13$100,000 to $124,999
- 5$125,000 to $149,999

Home value of owner - occupied houses in 2022 in Garland, NC
-
- 3$10,000 to $14,999
- 7$15,000 to $19,999
- 10$20,000 to $24,999
- 14$40,000 to $49,999
- 19$60,000 to $69,999
- 2$70,000 to $79,999
- 11$80,000 to $89,999
- 4$90,000 to $99,999
- 66$100,000 to $124,999
- 11$125,000 to $149,999
- 23$300,000 to $399,999

Rent paid by renters in 2022 in Garland, NC
-
- 2Less than $100
- 2$100 to $149
- 2$300 to $349
- 6$350 to $399
- 4$450 to $499
- 21$500 to $549
- 4$550 to $599
- 25$650 to $699
- 24$800 to $899
- 20No cash rent


Percentage of workers working in this county: 59.6%
Number of people working at home: 16 (4.1% of all workers)
Travel time to work (commute)
- Less than 5 minutes: 0
- 5 to 9 minutes: 35
- 10 to 14 minutes: 13
- 15 to 19 minutes: 24
- 20 to 24 minutes: 17
- 25 to 29 minutes: 11
- 30 to 34 minutes: 163
- 35 to 39 minutes: 11
- 40 to 44 minutes: 52
- 45 to 59 minutes: 13
- 60 to 89 minutes: 10
- 90 or more minutes: 0
Means of transportation to work:
- Drove a car alone: 186 (68.6%)
- Carpooled: 66 (24.4%)
- Bus or trolley bus: 2 (0.7%)
- Bicycle: 5 (1.8%)
- Walked: 9 (3.3%)
- Other means: 1 (0.4%)
- Worked at home: 2 (0.7%)

- Unemployment by race in 2022
- Unemployment rate for White non-Hispanic residents
- 6.1%Males
- 2.5%Females
- Unemployment rate for Hispanic or Latino residents
- 21.0%Males

- Year of entry for the foreign-born population in Garland, North Carolina
- 02010 or later
- 562000 to 2009
- 441990 to 1999
- 131980 to 1989
- 21970 to 1979
- 0Before 1970
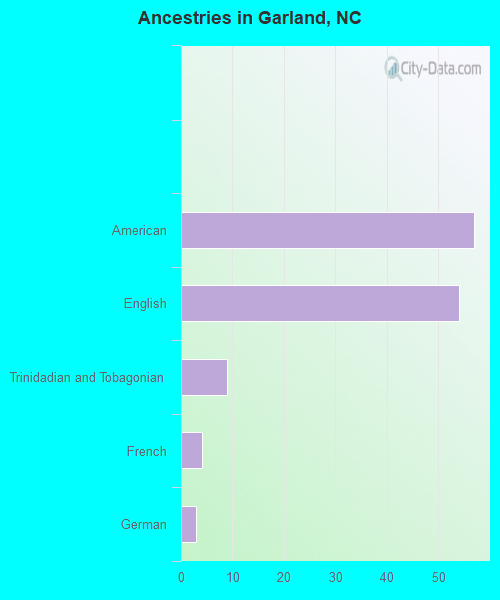
First ancestries reported:
- American: 57 (6.2%)
- English: 54 (5.8%)
- Trinidadian and Tobagonian: 9 (1.0%)
- French: 4 (0.4%)
- German: 3 (0.3%)
Most common places of birth for foreign-born residents (%):
| Garland: | 77.4% (89) |
| North Carolina: | 24.7% (214,776) |
| Garland: | 8.7% (10) |
| North Carolina: | 0.4% (3,587) |
| Garland: | 4.3% (5) |
| North Carolina: | 3.8% (33,379) |
Place of birth for U.S.-born residents:
- This state: 844
- Other state: 42
- Northeast: 0
- Midwest: 3
- South: 19
- West: 20
89.4% of Garland residents lived in the same house 1 years ago.
Out of people who lived in different houses, 12.8% lived in this county.
Out of people who lived in different counties, 100.0% lived in North Carolina.
| Garland: | 89.4% |
| State average: | 87.3% |
Education attainment for males 25 years and older:
- No schooling: 0
- Nursery to 4th grade: 0
- 5th and 6th grade: 3
- 7th and 8th grade: 0
- 9th grade: 16
- 10th grade: 0
- 11th grade: 4
- 12th grade, no diploma: 0
- High school graduate (or equivalency): 96
- Less than 1 year of college: 0
- Some college more than 1 year, no degree: 16
- Associate degree: 24
- Bachelor's degree: 7
- Master's degree: 2
- Professional school degree: 0
- Doctorate degree: 0

Education attainment for females 25 years and older:
- No schooling: 0
- Nursery to 4th grade: 0
- 5th and 6th grade: 0
- 7th and 8th grade: 9
- 9th grade: 15
- 10th grade: 8
- 11th grade: 4
- 12th grade, no diploma: 0
- High school graduate (or equivalency): 81
- Less than 1 year of college: 0
- Some college more than 1 year, no degree: 81
- Associate degree: 45
- Bachelor's degree: 28
- Master's degree: 6
- Professional school degree: 0
- Doctorate degree: 0


Housing units in structures:
- One, detached: 266
- One, attached: 7
- 10 to 19: 7
- Mobile homes: 113
Median worth of mobile homes: $112,686
House/condo owner moved in on average 11 years ago
Renter moved in on average 6 years ago


- 79.4%Electricity
- 19.6%Bottled, tank, or LP gas
- 1.0%Fuel oil, kerosene, etc.

- 89.5%Electricity
- 7.9%Bottled, tank, or LP gas
- 2.6%Fuel oil, kerosene, etc.
Private vs. public school enrollment:
| Here: | 19.3% |
| North Carolina: | 13.8% |
| Here: | 21.6% |
| North Carolina: | 11.9% |
| Here: | 76.1% |
| North Carolina: | 19.3% |


