Garland, TX (Texas) Houses and Residents
| Garland: | $267,400 |
| Texas: | $275,400 |
Mean price in 2022:
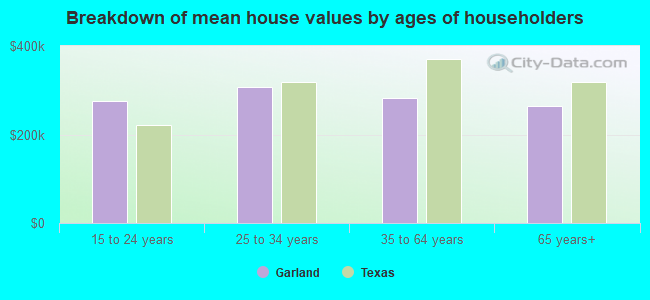
Detached houses: $301,036
Here: $301,036 State: $369,058 Townhouses or other attached units: $194,920
Here: $194,920 State: $327,631 In 2-unit structures: $98,405
Here: $98,405 State: $374,947 In 3-to-4-unit structures: $137,544
Here: $137,544 State: $209,652 In 5-or-more-unit structures: $135,940
Here: $135,940 State: $413,944 Mobile homes: $128,625
Here: $128,625 State: $124,413
Total population: 235,501 (Urban population: 215,955, Rural population: 36 (all nonfarm))
Houses: 86,988 (82,044 occupied: 48,030 owner occupied, 34,014 renter occupied)
| % of renters here: | 41% |
| State: | 38% |
Housing density: 1,523 houses/condos per square mile
Median price asked for vacant for-sale houses and condos in 2022: $393,252.
Median contract rent in 2022: $1,257 (lower quartile is $1,022, upper quartile is $1,581)
Median rent asked for vacant for-rent units in 2022: $1,181
Median gross rent in Garland, TX in 2022: $1,463
Housing units in Garland with a mortgage: 28,593 (632 second mortgage, 0 home equity loan, 553 both second mortgage and home equity loan)
Houses without a mortgage: 374
Median household income for houses/condos with a mortgage: $99,254
Median household income for apartments without a mortgage: $67,503
Median monthly housing costs: $1,407
Compare current foreclosures in Garland, TX:
| Photo | Address | Area | Beds / Baths | Price | Details |
|---|---|---|---|---|---|

|
#1
Ranch Dr
Garland, TX 75041
|
2,213 sq. feet
|
2 baths 3 beds |
show details | |

|
#2
Lister Dr
Garland, TX 75040
|
1,407 sq. feet
|
2 baths 4 beds |
show details | |

|
#3
E Harvard Dr
Garland, TX 75041
|
1,626 sq. feet
|
2 baths 4 beds |
show details | |

|
#4
Graybar Dr
Garland, TX 75040
|
1,719 sq. feet
|
2 baths 3 beds |
show details | |

|
#5
Gayle Dr
Garland, TX 75044
|
1,877 sq. feet
|
3 baths 3 beds |
show details | |

|
#6
Highmont Dr
Garland, TX 75041
|
1,302 sq. feet
|
2 baths 3 beds |
show details | |

|
#7
Royalty Dr
Garland, TX 75044
|
1,159 sq. feet
|
2 baths 3 beds |
show details | |

|
#8
Rochdale St
Garland, TX 75040
|
2,238 sq. feet
|
3 baths 4 beds |
show details | |

|
#9
Shadow Brook Trl
Garland, TX 75043
|
4,051 sq. feet
|
3 baths 4 beds |
show details | |

|
#10
Frio Ln
Garland, TX 75040
|
1,386 sq. feet
|
2 baths 3 beds |
show details |
| Photo | Address | Area | Beds / Baths | Price | Details |
|---|---|---|---|---|---|

|
#11
Paris Dr
Garland, TX 75040
|
1,694 sq. feet
|
2 baths 3 beds |
show details | |

|
#12
Pebblestone Dr
Garland, TX 75044
|
2,342 sq. feet
|
2 baths 3 beds |
show details | |

|
#13
High Bluff Dr
Garland, TX 75041
|
1,112 sq. feet
|
1 baths 3 beds |
show details | |

|
#14
Orchard Ridge Dr
Garland, TX 75043
|
1,880 sq. feet
|
2 baths 3 beds |
show details | |

|
#15
Proctor St
Garland, TX 75041
|
836 sq. feet
|
1 baths 3 beds |
show details | |

|
#16
Nash St
Garland, TX 75040
|
762 sq. feet
|
1 baths 2 beds |
show details | |

|
#17
Presidio Dr
Garland, TX 75043
|
1,943 sq. feet
|
2 baths 4 beds |
show details | |

|
#18
Sleepy Hollow Dr
Garland, TX 75043
|
1,249 sq. feet
|
1 baths 3 beds |
show details | |

|
#19
Magnolia Dr
Garland, TX 75040
|
1,146 sq. feet
|
2 baths 2 beds |
show details | |

|
#20
Villa Ridge Dr
Garland, TX 75043
|
1,746 sq. feet
|
2 baths 3 beds |
show details |
| Photo | Address | Area | Beds / Baths | Price | Details |
|---|---|---|---|---|---|

|
#21
Lakemere Dr
Garland, TX 75041
|
2,692 sq. feet
|
2 baths 5 beds |
show details | |

|
#22
Downs Way
Garland, TX 75040
|
2,016 sq. feet
|
2 baths 3 beds |
show details | |

|
#23
Riviera Dr
Garland, TX 75040
|
1,560 sq. feet
|
2 baths 3 beds |
show details | |

|
#24
Crockett St
Garland, TX 75042
|
2,033 sq. feet
|
2 baths 4 beds |
show details | |

|
#25
Garrison Way
Garland, TX 75040
|
2,570 sq. feet
|
2 baths 4 beds |
show details | |

|
#26
Bowie St
Garland, TX 75040
|
1,056 sq. feet
|
1 baths 3 beds |
show details | |

|
#27
River Birch Trl
Garland, TX 75040
|
4,483 sq. feet
|
4 baths 4 beds |
show details | |

|
#28
Snowmass Ln
Garland, TX 75044
|
1,256 sq. feet
|
2 baths 3 beds |
show details | |

|
#29
Saddlebrook Dr
Garland, TX 75044
|
2,376 sq. feet
|
2 baths 4 beds |
show details | |

|
#30
Mayfield Ave
Garland, TX 75041
|
1,867 sq. feet
|
2 baths 3 beds |
show details |
| Photo | Address | Area | Beds / Baths | Price | Details |
|---|---|---|---|---|---|

|
#31
Mcdonald Dr
Garland, TX 75041
|
1,858 sq. feet
|
2 baths 3 beds |
show details | |

|
#32
Iroquois Dr
Garland, TX 75043
|
2,730 sq. feet
|
3 baths 5 beds |
show details | |

|
#33
Norwich Dr
Garland, TX 75043
|
3,264 sq. feet
|
2 baths 4 beds |
show details | |

|
#34
Whitney Dr
Garland, TX 75040
|
1,230 sq. feet
|
2 baths 3 beds |
show details | |

|
#35
Shorecrest Dr
Garland, TX 75040
|
1,136 sq. feet
|
2 baths 3 beds |
show details | |

|
#36
W Avenue G
Garland, TX 75040
|
1,062 sq. feet
|
1 baths 3 beds |
show details | |

|
#37
Meadowbrook Dr
Garland, TX 75042
|
864 sq. feet
|
1 baths 2 beds |
show details | |

|
#38
E Schreiber St
Garland, TX 75040
|
1,798 sq. feet
|
2 baths 3 beds |
show details | |

|
#39
Southampton Blvd
Garland, TX 75043
|
2,729 sq. feet
|
3 baths 4 beds |
show details | |

|
#40
Marriott Ln
Garland, TX 75040
|
2,111 sq. feet
|
2 baths 3 beds |
show details |
| Photo | Address | Area | Beds / Baths | Price | Details |
|---|---|---|---|---|---|

|
#41
Noble Ln
Garland, TX 75044
|
2,019 sq. feet
|
2 baths 3 beds |
show details | |

|
#42
Redcliff Ct
Garland, TX 75043
|
4,277 sq. feet
|
4 baths 5 beds |
show details | |

|
#43
E Ridgegate Dr
Garland, TX 75040
|
1,688 sq. feet
|
2 baths 3 beds |
show details | |

|
#44
Woodglen Dr
Garland, TX 75040
|
1,289 sq. feet
|
2 baths 3 beds |
show details | |

|
#45
Channel Isle Dr
Garland, TX 75043
|
4,621 sq. feet
|
3 baths 5 beds |
show details | |

|
#46
Country Club Pkwy
Garland, TX 75043
|
2,425 sq. feet
|
2 baths 3 beds |
show details | |

|
#47
Flamingo Ln
Garland, TX 75042
|
1,462 sq. feet
|
2 baths 4 beds |
show details | |

|
#48
Larry Dr
Garland, TX 75041
|
1,576 sq. feet
|
2 baths 3 beds |
show details | |

|
#49
Arrowhead Dr
Garland, TX 75043
|
1,549 sq. feet
|
2 baths 3 beds |
show details | |

|
Check over 1 million property listings on Foreclosure.com!
|
browse all offers | |||

Latest news about housing in Garland, TX collected exclusively by city-data.com from local newspapers, TV, and radio stations

 | Purchasing a 20 yr old home (90 replies) |
| Homes in the Centerville Garland Area (4 replies) |
| rental houses in Dallas metro? (1 reply) |
| LGI Homes....Good or Bad? (5 replies) |
| Questions about Garland and areas around! Need rent a home / find a school. Appreciate any advice / info! (2 replies) |
| Garland Apartments Zip 75043- how is the area? (17 replies) |

Median year apartment built: 1978
Household type by relationship:
Households: 240,667- Male householders: 40,155 (6,843 living alone), Female householders: 41,889 (8,697 living alone)
40,397 spouses (40,202 opposite-sex spouses), 3,970 unmarried partners, (3,763 opposite-sex unmarried partners), 76,803 children (71,385 natural, 869 adopted, 4,549 stepchildren), 7,944 grandchildren, 4,458 brothers or sisters, 6,150 parents, 124 foster children, 9,512 other relatives, 8,351 non-relatives
- In group quarters: 914
Size of family households: 22,829 2-persons, 14,726 3-persons, 11,417 4-persons, 7,716 5-persons, 3,163 6-persons, 1,422 7-or-more-persons.
Size of nonfamily households: 15,540 1-person, 3,810 2-persons, 1,320 3-persons, 48 4-persons, 53 6-persons.
34,438 married couples with children.
15,608 single-parent households (4,161 men, 11,447 women).
49.5% of residents of Garland speak English at home.
39.8% of residents speak Spanish at home (55% speak English very well, 26% speak English well, 16% speak English not well, 3% don't speak English at all).
1.8% of residents speak other Indo-European language at home (79% speak English very well, 16% speak English well, 6% speak English not well).
6.9% of residents speak Asian or Pacific Island language at home (50% speak English very well, 23% speak English well, 26% speak English not well, 1% don't speak English at all).
2.1% of residents speak other language at home (51% speak English very well, 43% speak English well, 2% speak English not well, 5% don't speak English at all).
Foreign born population: 72,660 (30.2%)
(37.0% of them are naturalized citizens)
| Here: | 6.0 |
| State: | 6.3 |
| Here: | 4.1 |
| State: | 4.0 |
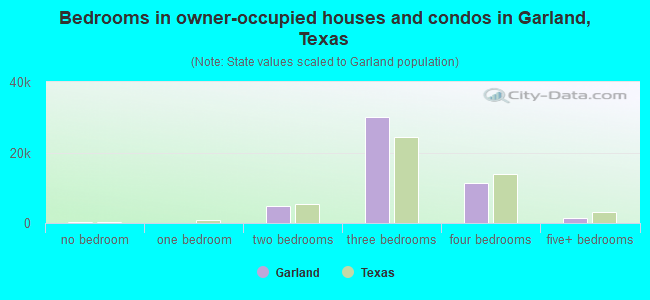
- Bedrooms in owner-occupied houses and condos in Garland, Texas
- 243no bedroom
- 761 bedroom
- 4,9402 bedrooms
- 30,0993 bedrooms
- 11,2854 bedrooms
- 1,3875+ bedrooms
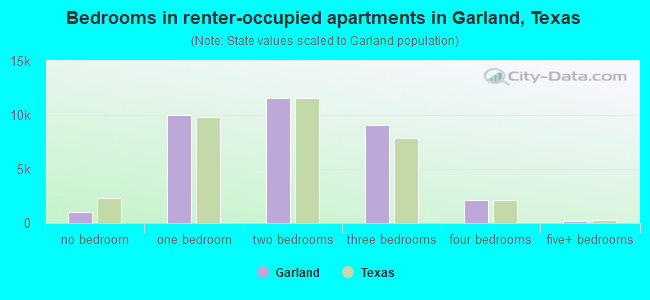
- Bedrooms in renter-occupied apartments in Garland, Texas
- 978no bedroom
- 10,0151 bedroom
- 11,5672 bedrooms
- 9,1153 bedrooms
- 2,1294 bedrooms
- 2105+ bedrooms
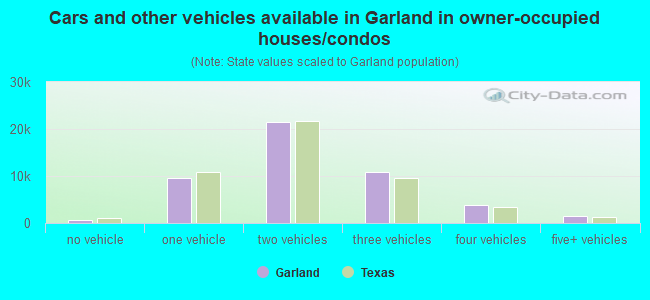
- Cars and other vehicles available in Garland in owner-occupied houses/condos
- 736no vehicle
- 9,5551 vehicle
- 21,5852 vehicles
- 10,9303 vehicles
- 3,7374 vehicles
- 1,4875+ vehicles
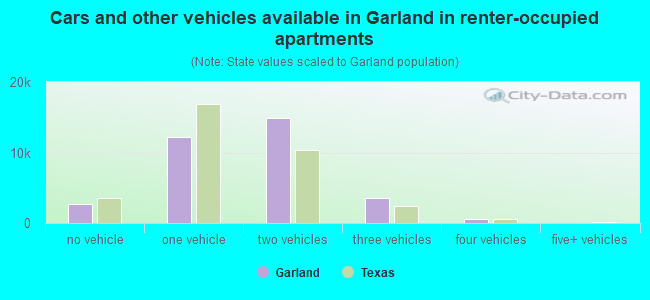
- Cars and other vehicles available in Garland in renter-occupied apartments
- 2,668no vehicle
- 12,2601 vehicle
- 14,8652 vehicles
- 3,5393 vehicles
- 6294 vehicles
- 535+ vehicles
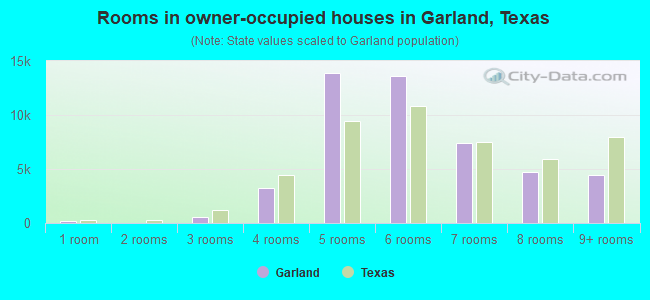
- Rooms in owner-occupied houses in Garland, Texas
- 2051 room
- 02 rooms
- 5433 rooms
- 3,2614 rooms
- 13,8685 rooms
- 13,5916 rooms
- 7,4307 rooms
- 4,7338 rooms
- 4,3999+ rooms
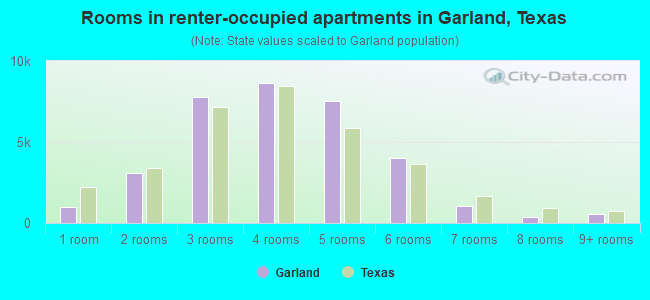
- Rooms in renter-occupied apartments in Garland, Texas
- 9781 room
- 3,1062 rooms
- 7,7843 rooms
- 8,6144 rooms
- 7,5505 rooms
- 4,0206 rooms
- 1,0347 rooms
- 3528 rooms
- 5769+ rooms
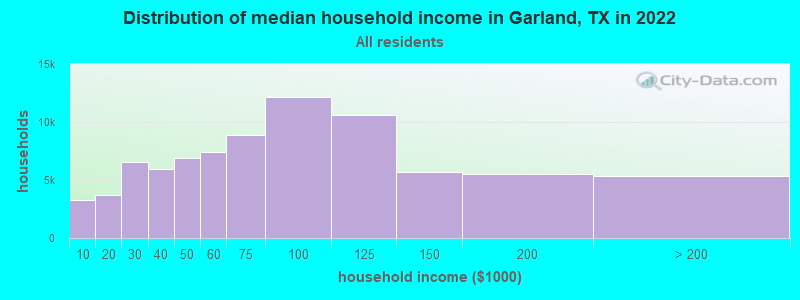
Garland, TX household income distribution

- 3,263Less than $10,000
- 3,698$10,000 to $19,999
- 6,555$20,000 to $29,999
- 5,972$30,000 to $39,999
- 6,901$40,000 to $49,999
- 7,421$50,000 to $59,999
- 8,853$60,000 to $74,999
- 12,172$75,000 to $99,999
- 10,616$100,000 to $124,999
- 5,686$125,000 to $149,999
- 5,539$150,000 to $199,999
- 5,368$200,000 or more
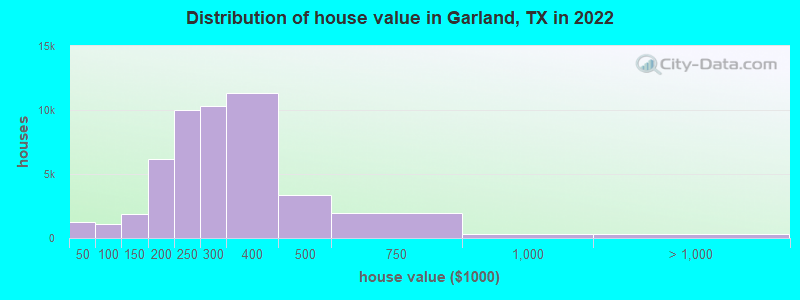
Home value of owner - occupied houses in 2022 in Garland, TX
-
- 935Less than $10,000
- 99$10,000 to $14,999
- 61$15,000 to $19,999
- 145$20,000 to $24,999
- 39$30,000 to $34,999
- 79$50,000 to $59,999
- 69$60,000 to $69,999
- 240$70,000 to $79,999
- 428$80,000 to $89,999
- 302$90,000 to $99,999
- 342$100,000 to $124,999
- 1,495$125,000 to $149,999
- 3,477$150,000 to $174,999
- 2,714$175,000 to $199,999
- 10,010$200,000 to $249,999
- 10,292$250,000 to $299,999
- 11,311$300,000 to $399,999
- 3,377$400,000 to $499,999
- 1,984$500,000 to $749,999
- 317$750,000 to $999,999
- 159$1,000,000 to $1,499,999
- 155$2,000,000 or more
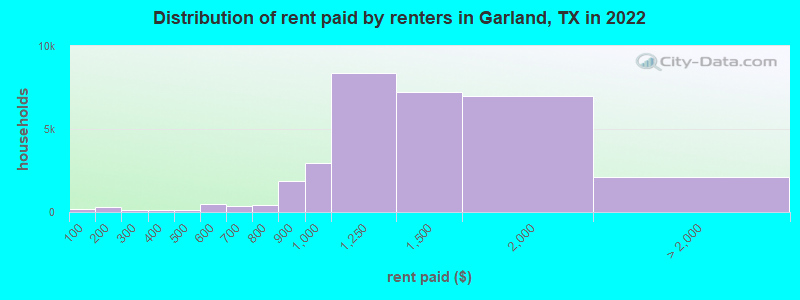
Rent paid by renters in 2022 in Garland, TX
-
- 208Less than $100
- 116$100 to $149
- 157$150 to $199
- 113$200 to $249
- 33$250 to $299
- 91$300 to $349
- 40$350 to $399
- 22$400 to $449
- 92$450 to $499
- 413$500 to $549
- 63$550 to $599
- 250$600 to $649
- 100$650 to $699
- 161$700 to $749
- 280$750 to $799
- 1,841$800 to $899
- 2,929$900 to $999
- 8,395$1,000 to $1,249
- 7,223$1,250 to $1,499
- 6,992$1,500 to $1,999
- 1,205$2,000 to $2,499
- 171$2,500 to $2,999
- 134$3,500 or more
- 574No cash rent
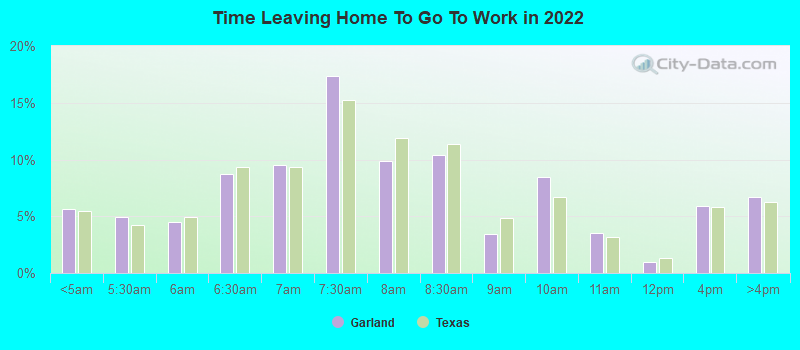
Percentage of workers working in this county: 79.6%
Number of people working at home: 15,664 (12.8% of all workers)
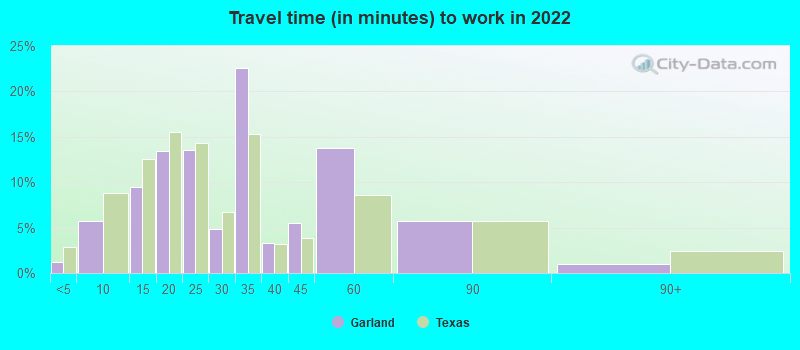
Travel time to work (commute)
- Less than 5 minutes: 766
- 5 to 9 minutes: 3,528
- 10 to 14 minutes: 7,666
- 15 to 19 minutes: 11,905
- 20 to 24 minutes: 14,520
- 25 to 29 minutes: 4,151
- 30 to 34 minutes: 33,599
- 35 to 39 minutes: 2,768
- 40 to 44 minutes: 5,615
- 45 to 59 minutes: 14,994
- 60 to 89 minutes: 4,914
- 90 or more minutes: 1,851
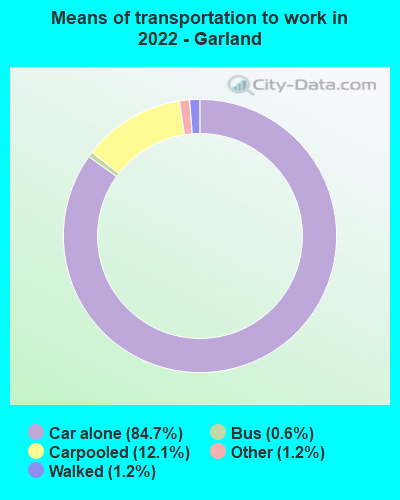
Means of transportation to work:
- Drove a car alone: 56,359 (69.9%)
- Carpooled: 8,221 (10.2%)
- Bus: 252 (0.3%)
- Subway or elevated rail: 5 (0.0%)
- Long-distance train or commuter rail: 16 (0.0%)
- Light rail, streetcar or trolley: 3 (0.0%)
- Ferryboat: 5 (0.0%)
- Taxi: 1,016 (1.3%)
- Bicycle: 66 (0.1%)
- Walked: 906 (1.1%)
- Worked at home: 15,573 (19.3%)
- Unemployment by race in 2022
- Unemployment rate for White non-Hispanic residents
- 3.3%Males
- 2.4%Females
- Unemployment rate for Black residents
- 0.6%Males
- 3.7%Females
- Unemployment rate for American Indian and Alaska Native residents
- 2.8%Males
- Unemployment rate for Asian residents
- 8.6%Males
- 5.7%Females
- Unemployment rate for other race residents
- 1.0%Males
- 7.5%Females
- Unemployment rate for two or more race residents
- 5.9%Males
- 6.7%Females
- Unemployment rate for Hispanic or Latino residents
- 3.4%Males
- 5.0%Females
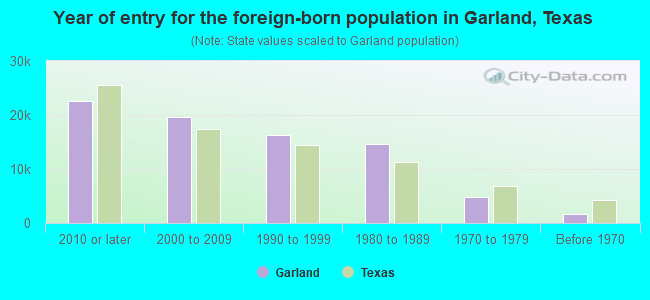
- Year of entry for the foreign-born population in Garland, Texas
- 22,6852010 or later
- 19,5592000 to 2009
- 16,3181990 to 1999
- 14,5711980 to 1989
- 4,8771970 to 1979
- 1,749Before 1970
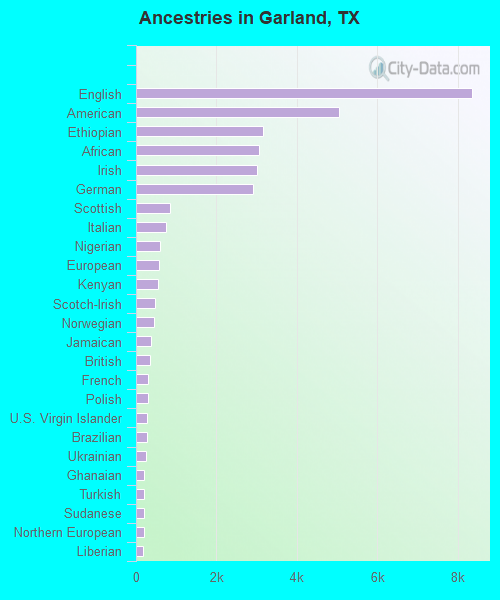
First ancestries reported:
- English: 8,360 (5.3%)
- American: 5,053 (3.2%)
- Ethiopian: 3,166 (2.0%)
- African: 3,069 (1.9%)
- Irish: 3,010 (1.9%)
- German: 2,912 (1.8%)
- Scottish: 857 (0.5%)
- Italian: 743 (0.5%)
- Nigerian: 597 (0.4%)
- European: 560 (0.4%)
- Kenyan: 543 (0.3%)
- Scotch-Irish: 470 (0.3%)
- Norwegian: 459 (0.3%)
- Jamaican: 382 (0.2%)
- British: 344 (0.2%)
- French: 296 (0.2%)
- Polish: 290 (0.2%)
- U.S. Virgin Islander: 276 (0.2%)
- Brazilian: 266 (0.2%)
- Ukrainian: 238 (0.2%)
- Ghanaian: 207 (0.1%)
- Turkish: 202 (0.1%)
- Sudanese: 196 (0.1%)
- Northern European: 187 (0.1%)
- Liberian: 185 (0.1%)
- Dutch: 183 (0.1%)
- Iranian: 181 (0.1%)
- Swedish: 173 (0.1%)
- Czech: 166 (0.1%)
- Trinidadian and Tobagonian: 156 (0.10%)
- Russian: 148 (0.09%)
- Syrian: 142 (0.09%)
- Palestinian: 131 (0.08%)
- Arab: 121 (0.08%)
- Welsh: 118 (0.07%)
- Greek: 106 (0.07%)
- French Canadian: 102 (0.06%)
- Egyptian: 92 (0.06%)
- Yugoslavian: 82 (0.05%)
- Hungarian: 80 (0.05%)
- Finnish: 79 (0.05%)
- Portuguese: 76 (0.05%)
- Somali: 76 (0.05%)
- Scandinavian: 75 (0.05%)
- Iraqi: 48 (0.03%)
- Lebanese: 47 (0.03%)
- Romanian: 44 (0.03%)
- Albanian: 41 (0.03%)
- Belizean: 40 (0.03%)
- West Indian: 39 (0.02%)
- British West Indian: 37 (0.02%)
- Canadian: 35 (0.02%)
- Czechoslovakian: 34 (0.02%)
- Macedonian: 31 (0.02%)
- South African: 30 (0.02%)
- Afghan: 27 (0.02%)
- Slovene: 25 (0.02%)
- Jordanian: 24 (0.02%)
- Cajun: 18 (0.01%)
- Moroccan: 18 (0.01%)
- Haitian: 17 (0.01%)
- Bulgarian: 16 (0.01%)
- Bermudan: 15 (0.01%)
- Slovak: 13 (0.01%)
- Barbadian: 13 (0.01%)
- Austrian: 11 (0.01%)
- Slavic: 11 (0.01%)
- Croatian: 10 (0.01%)
- Danish: 10 (0.01%)
- Swiss: 9 (0.01%)
- Luxembourger: 9 (0.01%)
- Eastern European: 8 (0.01%)
Most common places of birth for foreign-born residents (%):
| Garland: | 41.8% (32,524) |
| Texas: | 48.4% (2,411,723) |
| Garland: | 12.5% (9,739) |
| Texas: | 3.7% (184,770) |
| Garland: | 6.5% (5,090) |
| Texas: | 4.5% (224,455) |
| Garland: | 4.9% (3,839) |
| Texas: | 6.1% (306,347) |
| Garland: | 3.8% (2,937) |
| Texas: | 3.0% (147,182) |
| Garland: | 3.3% (2,564) |
| Texas: | 1.8% (87,382) |
| Garland: | 2.9% (2,250) |
| Texas: | 0.5% (24,705) |
| Garland: | 2.2% (1,735) |
| Texas: | 2.1% (103,148) |
| Garland: | 2.1% (1,632) |
| Texas: | 1.9% (96,110) |
Place of birth for U.S.-born residents:
- This state: 120,797
- Other state: 45,200
- Northeast: 4,820
- Midwest: 11,018
- South: 21,233
- West: 8,129
90.7% of Garland residents lived in the same house 1 years ago.
Out of people who lived in different houses, 40.3% lived in this county.
Out of people who lived in different counties, 58.5% lived in Texas.
| Garland: | 90.7% |
| State average: | 85.7% |
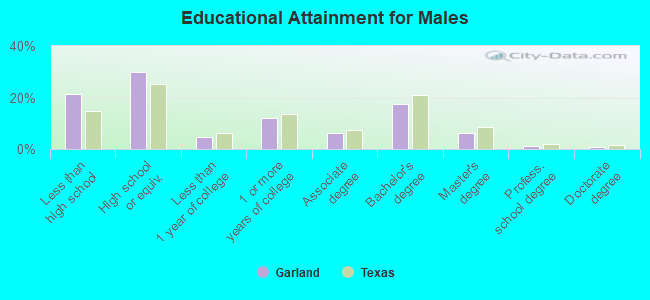
Education attainment for males 25 years and older:
- No schooling: 4,393
- Nursery to 4th grade: 780
- 5th and 6th grade: 2,573
- 7th and 8th grade: 2,320
- 9th grade: 1,086
- 10th grade: 1,658
- 11th grade: 2,029
- 12th grade, no diploma: 1,092
- High school graduate (or equivalency): 22,504
- Less than 1 year of college: 3,490
- Some college more than 1 year, no degree: 9,021
- Associate degree: 4,712
- Bachelor's degree: 13,030
- Master's degree: 4,590
- Professional school degree: 816
- Doctorate degree: 699
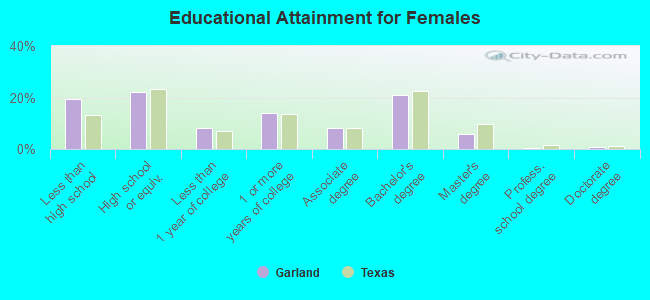
Education attainment for females 25 years and older:
- No schooling: 4,071
- Nursery to 4th grade: 1,711
- 5th and 6th grade: 2,233
- 7th and 8th grade: 1,698
- 9th grade: 1,226
- 10th grade: 890
- 11th grade: 1,616
- 12th grade, no diploma: 2,064
- High school graduate (or equivalency): 17,805
- Less than 1 year of college: 6,561
- Some college more than 1 year, no degree: 11,049
- Associate degree: 6,531
- Bachelor's degree: 16,641
- Master's degree: 4,707
- Professional school degree: 454
- Doctorate degree: 670


Housing units in structures:
- One, detached: 59,126
- One, attached: 3,318
- Two: 444
- 3 or 4: 1,533
- 5 to 9: 3,355
- 10 to 19: 8,332
- 20 to 49: 5,935
- 50 or more: 4,470
- Mobile homes: 475
Housing units lacking complete kitchen facilities in 2022: 2.6%
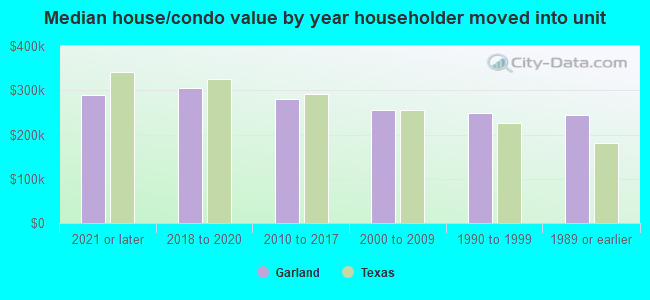
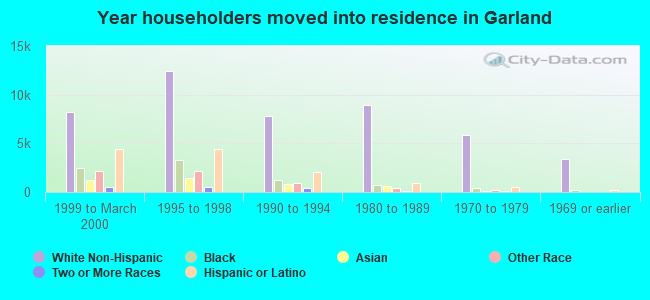
House/condo owner moved in on average 14 years ago
Renter moved in on average 2 years ago
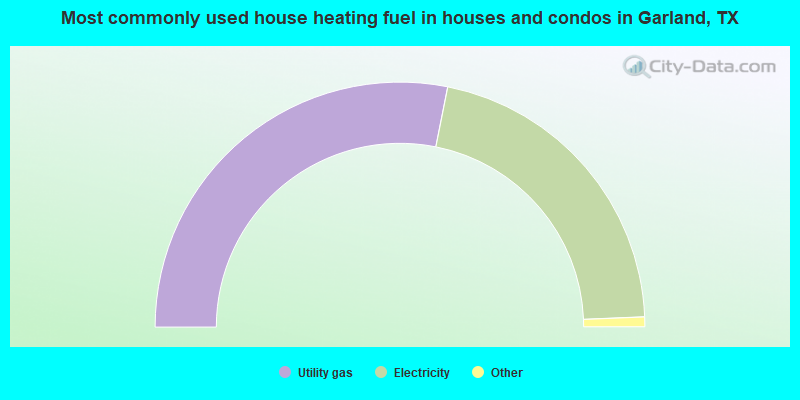
- 56.2%Utility gas
- 42.4%Electricity
- 1.0%Bottled, tank, or LP gas
- 0.2%No fuel used
- 0.1%Wood
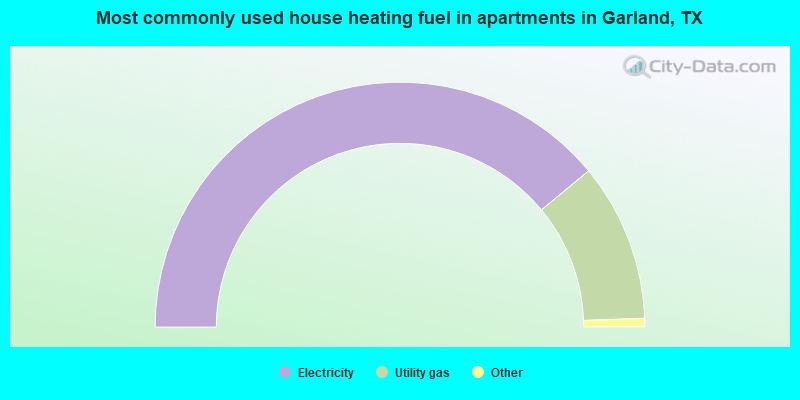
- 78.0%Electricity
- 20.9%Utility gas
- 0.8%No fuel used
- 0.3%Bottled, tank, or LP gas
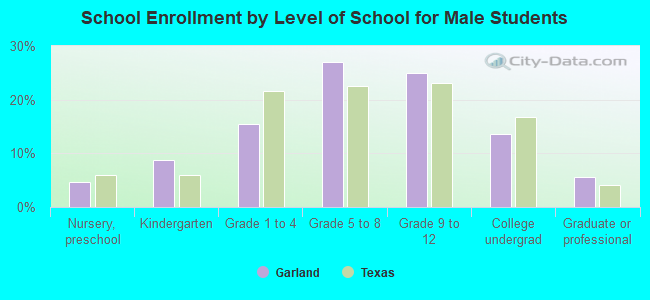
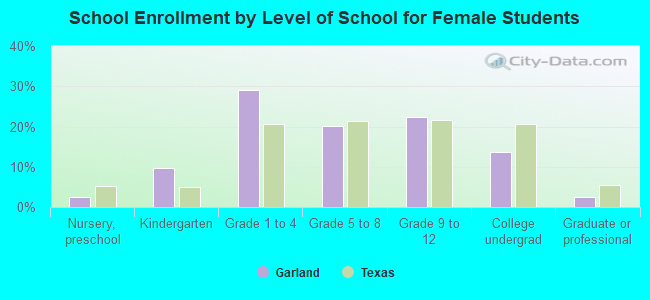
Private vs. public school enrollment:
| Here: | 5.0% |
| Texas: | 8.8% |
| Here: | 4.7% |
| Texas: | 8.0% |
| Here: | 15.6% |
| Texas: | 16.2% |