Garrett, IN (Indiana) Houses and Residents
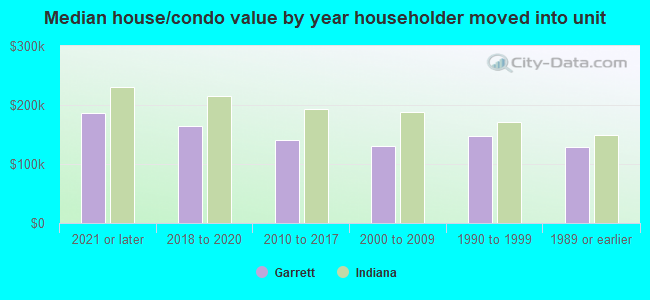
| Garrett: | $149,591 |
| Indiana: | $208,700 |
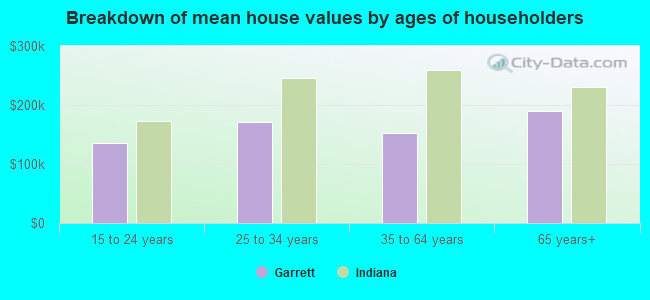
Mean price in 2022:
Detached houses: $151,256
Here: $151,256 State: $257,916 Mobile homes: $259,612
Here: $259,612 State: $67,116
Total population: 6,319 (Urban population: 5,811 (all inside urban clusters), Rural population: 85 (all nonfarm))
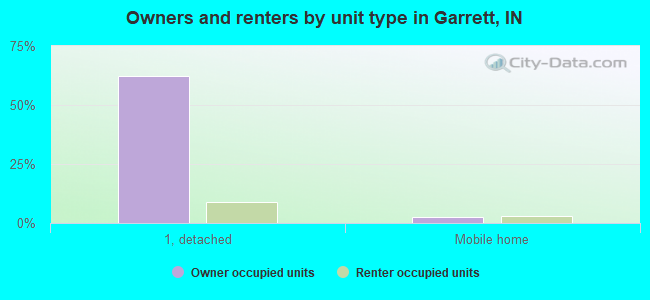
Houses: 2,865 (2,638 occupied: 2,186 owner occupied, 482 renter occupied)
| % of renters here: | 18% |
| State: | 29% |
Housing density: 917 houses/condos per square mile
Median price asked for vacant for-sale houses and condos in 2022: $486,935.
Median contract rent in 2022: $708 (lower quartile is $553, upper quartile is $815)
Median rent asked for vacant for-rent units in 2022: $737
Median gross rent in Garrett, IN in 2022: $826
Housing units in Garrett with a mortgage: 1,362 (43 second mortgage, 0 home equity loan, 44 both second mortgage and home equity loan)
Houses without a mortgage: 54
Median household income for houses/condos with a mortgage: $74,060
Median household income for apartments without a mortgage: $62,659
Median monthly housing costs: $821
Compare current foreclosures near Garrett, IN:
| Photo | Address | Area | Beds / Baths | Price | Details |
|---|---|---|---|---|---|

|
#1
N Randolph St
Garrett, IN 46738
|
1,388 sq. feet
|
1 baths 3 beds |
$68,900
|
show details |

|
#2
N Randolph St
Garrett, IN 46738
|
2,640 sq. feet
|
1 baths 4 beds |
show details | |

|
#3
N James St
Garrett, IN 46738
|
872 sq. feet
|
1 baths 2 beds |
show details | |

|
#4
S 2nd St
Garrett, IN 46738
|
2,360 sq. feet
|
2 baths 5 beds |
show details | |

|
#5
S Franklin St
Garrett, IN 46738
|
1,086 sq. feet
|
1 baths 2 beds |
show details | |

|
#6
South Rd
Garrett, IN 46738
|
1,044 sq. feet
|
1 baths 3 beds |
show details | |

|
#7
W 5th Ave
Garrett, IN 46738
|
1,136 sq. feet
|
1 baths 2 beds |
show details | |

|
#8
County Road 48
Garrett, IN 46738
|
- sq. feet
|
- baths - beds |
show details | |

|
#9
Fairfax Ct
Garrett, IN 46738
|
- sq. feet
|
- baths - beds |
show details | |

|
#10
Waynedale Dr
Garrett, IN 46738
|
- sq. feet
|
- baths - beds |
show details |
| Photo | Address | Area | Beds / Baths | Price | Details |
|---|---|---|---|---|---|

|
#11
S Franklin St
Garrett, IN 46738
|
- sq. feet
|
- baths - beds |
show details | |

|
#12
N Randolph St
Garrett, IN 46738
|
- sq. feet
|
- baths - beds |
show details | |

|
#13
E King St
Garrett, IN 46738
|
- sq. feet
|
- baths - beds |
show details | |

|
#14
Sadie Dr
Garrett, IN 46738
|
- sq. feet
|
- baths - beds |
show details | |

|
#15
E Covell St
Garrett, IN 46738
|
- sq. feet
|
- baths - beds |
show details | |

|
#16
W Warfield St
Garrett, IN 46738
|
- sq. feet
|
- baths - beds |
show details | |

|
#17
Randolph Street, Apt 2
Garrett, IN 46738
|
- sq. feet
|
- baths - beds |
show details | |

|
#18
E King St
Garrett, IN 46738
|
- sq. feet
|
- baths - beds |
show details | |

|
#19
W King St
Garrett, IN 46738
|
- sq. feet
|
- baths - beds |
show details | |

|
#20
Kodiak Trl
Auburn, IN 46706
|
1,603 sq. feet
|
3 baths 3 beds |
show details |
| Photo | Address | Area | Beds / Baths | Price | Details |
|---|---|---|---|---|---|

|
#21
Hawk Rdg
Harlan, IN 46743
|
- sq. feet
|
2 baths 3 beds |
show details | |

|
#22
Penn Ave
Fort Wayne, IN 46805
|
1,245 sq. feet
|
1 baths 3 beds |
show details | |

|
#23
Twilight Ln
Fort Wayne, IN 46835
|
2,100 sq. feet
|
2 baths 4 beds |
show details | |

|
#24
Phillip St
Auburn, IN 46706
|
- sq. feet
|
2 baths 3 beds |
show details | |

|
#25
Laurelwood Cv
Fort Wayne, IN 46835
|
2,161 sq. feet
|
2 baths 3 beds |
show details | |

|
#26
May Pl
Fort Wayne, IN 46825
|
1,296 sq. feet
|
2 baths 3 beds |
show details | |

|
#27
Bittersweet Dr
Fort Wayne, IN 46825
|
1,025 sq. feet
|
1 baths 2 beds |
show details | |

|
#28
Baytree Dr
Fort Wayne, IN 46825
|
1,085 sq. feet
|
1 baths 3 beds |
show details | |

|
#29
Ludwig Park Dr
Fort Wayne, IN 46825
|
1,344 sq. feet
|
1 baths 3 beds |
show details | |

|
#30
Castell Dr
Fort Wayne, IN 46835
|
2,136 sq. feet
|
2 baths 4 beds |
show details |
| Photo | Address | Area | Beds / Baths | Price | Details |
|---|---|---|---|---|---|

|
#31
High Point Run
Fort Wayne, IN 46825
|
1,280 sq. feet
|
1 baths 3 beds |
show details | |

|
#32
Bittersweet Dr
Fort Wayne, IN 46825
|
1,065 sq. feet
|
1 baths 3 beds |
show details | |

|
#33
Andorra Dr
Fort Wayne, IN 46835
|
1,256 sq. feet
|
1 baths 3 beds |
show details | |

|
#34
Larch Ln
Fort Wayne, IN 46825
|
1,172 sq. feet
|
1 baths 3 beds |
show details | |

|
#35
Kildare Xing
Fort Wayne, IN 46835
|
1,952 sq. feet
|
2 baths 4 beds |
show details | |

|
#36
Shell Dr
Fort Wayne, IN 46835
|
1,320 sq. feet
|
1 baths 3 beds |
show details | |

|
#37
Goodfellow Dr
Fort Wayne, IN 46835
|
1,225 sq. feet
|
2 baths 3 beds |
show details | |

|
#38
Althean Dr
Fort Wayne, IN 46835
|
2,374 sq. feet
|
2 baths 4 beds |
show details | |

|
#39
Tiger Lily Pl
Fort Wayne, IN 46835
|
1,724 sq. feet
|
2 baths 3 beds |
show details | |

|
#40
E South St
Albion, IN 46701
|
888 sq. feet
|
1 baths 2 beds |
show details |
| Photo | Address | Area | Beds / Baths | Price | Details |
|---|---|---|---|---|---|

|
#41
Saint Joe Center Rd
Fort Wayne, IN 46835
|
1,200 sq. feet
|
1 baths 3 beds |
show details | |

|
#42
Saint Joe Center Rd
Fort Wayne, IN 46835
|
1,092 sq. feet
|
1 baths 3 beds |
show details | |

|
#43
Laurelwood Cv
Fort Wayne, IN 46835
|
1,992 sq. feet
|
2 baths 3 beds |
show details | |

|
#44
Black Oak Blvd
Fort Wayne, IN 46835
|
2,166 sq. feet
|
2 baths 4 beds |
show details | |

|
#45
Park Ln
Butler, IN 46721
|
936 sq. feet
|
1 baths 3 beds |
show details | |

|
#46
E Hazel St
Albion, IN 46701
|
1,266 sq. feet
|
1 baths 3 beds |
show details | |

|
#47
N Park Ln
Butler, IN 46721
|
1,288 sq. feet
|
1 baths 3 beds |
show details | |

|
#48
Springfield Center Rd
Grabill, IN 46741
|
1,248 sq. feet
|
1 baths 3 beds |
show details | |

|
#49
N 150 E
Albion, IN 46701
|
1,664 sq. feet
|
2 baths 3 beds |
show details | |

|
Check over 1 million property listings on Foreclosure.com!
|
browse all offers | |||

Latest news about housing in Garrett, IN collected exclusively by city-data.com from local newspapers, TV, and radio stations

 | Yet another relocation question - NE Indiana (4 replies) |
| HAD ENOUGH OF SEARCHING, between two rocks here, please help (14 replies) |
| Indiana bank ratings (7 replies) |
| Smaller towns outside of Ft. Wayne??? (15 replies) |
Median year apartment built: 1977
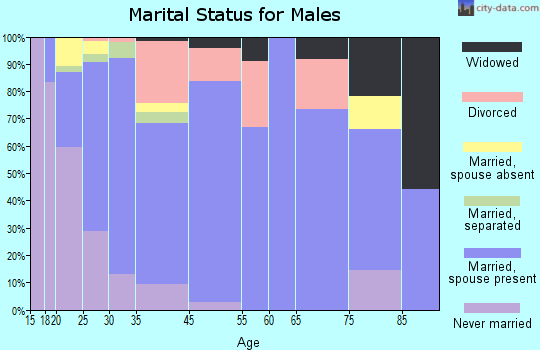
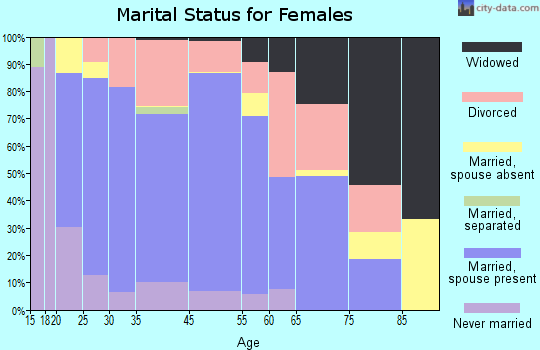
Household type by relationship:
Households: 6,480- Male householders: 1,409 (232 living alone), Female householders: 1,207 (310 living alone)
1,398 spouses (1,398 opposite-sex spouses), 274 unmarried partners, (260 opposite-sex unmarried partners), 1,697 children (1,465 natural, 58 adopted, 173 stepchildren), 88 grandchildren, 62 brothers or sisters, 45 parents, 64 foster children, 73 other relatives, 75 non-relatives
- In group quarters: 82
Size of family households: 964 2-persons, 438 3-persons, 330 4-persons, 115 5-persons, 84 6-persons.
Size of nonfamily households: 556 1-person, 178 2-persons.
1,028 married couples with children.
393 single-parent households (87 men, 306 women).
97.0% of residents of Garrett speak English at home.
1.0% of residents speak Spanish at home (56% speak English very well, 44% speak English well).
0.7% of residents speak other Indo-European language at home (100% speak English very well).
0.4% of residents speak Asian or Pacific Island language at home (71% speak English very well, 29% speak English well).
Foreign born population: 98 (1.5%)
(91.8% of them are naturalized citizens)
| Here: | 6.4 |
| State: | 6.6 |
| Here: | 4.4 |
| State: | 4.3 |
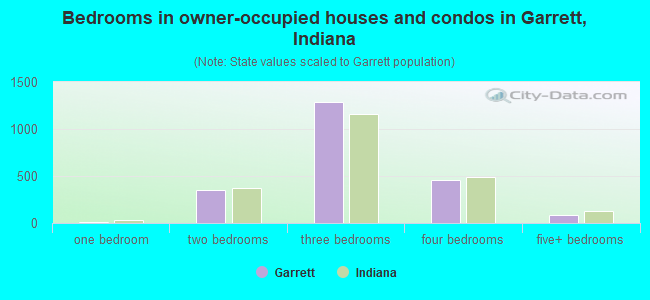
- Bedrooms in owner-occupied houses and condos in Garrett, Indiana
- 0no bedroom
- 131 bedroom
- 3502 bedrooms
- 1,2843 bedrooms
- 4574 bedrooms
- 815+ bedrooms
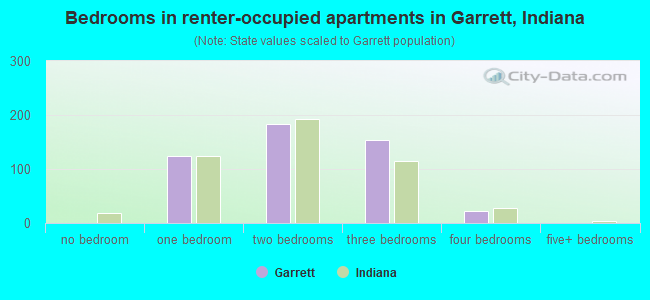
- Bedrooms in renter-occupied apartments in Garrett, Indiana
- 0no bedroom
- 1251 bedroom
- 1832 bedrooms
- 1533 bedrooms
- 224 bedrooms
- 05+ bedrooms
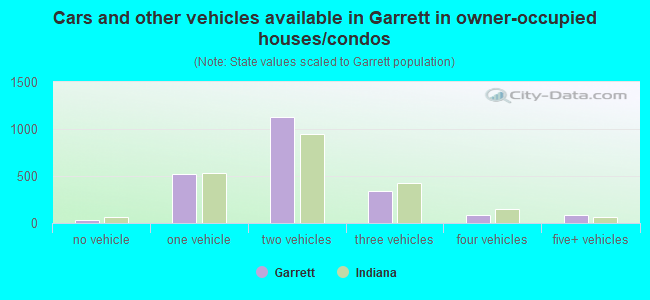
- Cars and other vehicles available in Garrett in owner-occupied houses/condos
- 30no vehicle
- 5231 vehicle
- 1,1262 vehicles
- 3373 vehicles
- 884 vehicles
- 825+ vehicles
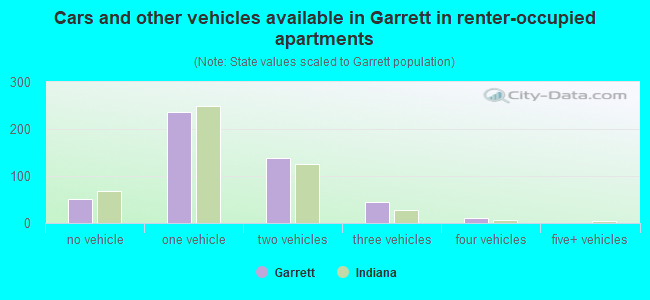
- Cars and other vehicles available in Garrett in renter-occupied apartments
- 51no vehicle
- 2371 vehicle
- 1392 vehicles
- 443 vehicles
- 114 vehicles
- 05+ vehicles
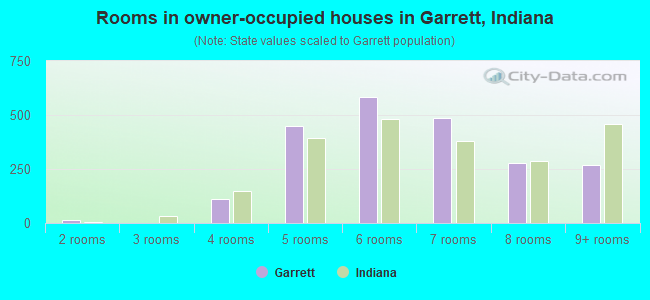
- Rooms in owner-occupied houses in Garrett, Indiana
- 01 room
- 132 rooms
- 03 rooms
- 1104 rooms
- 4495 rooms
- 5856 rooms
- 4847 rooms
- 2768 rooms
- 2699+ rooms

- Rooms in renter-occupied apartments in Garrett, Indiana
- 01 room
- 432 rooms
- 843 rooms
- 1174 rooms
- 1245 rooms
- 416 rooms
- 437 rooms
- 118 rooms
- 189+ rooms
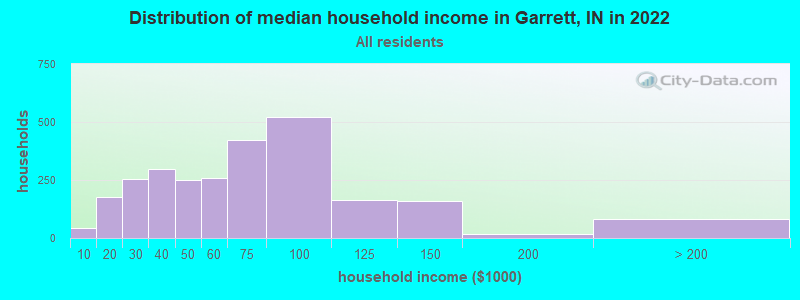
Garrett, IN household income distribution

- 43Less than $10,000
- 178$10,000 to $19,999
- 255$20,000 to $29,999
- 297$30,000 to $39,999
- 251$40,000 to $49,999
- 259$50,000 to $59,999
- 421$60,000 to $74,999
- 523$75,000 to $99,999
- 163$100,000 to $124,999
- 160$125,000 to $149,999
- 19$150,000 to $199,999
- 82$200,000 or more
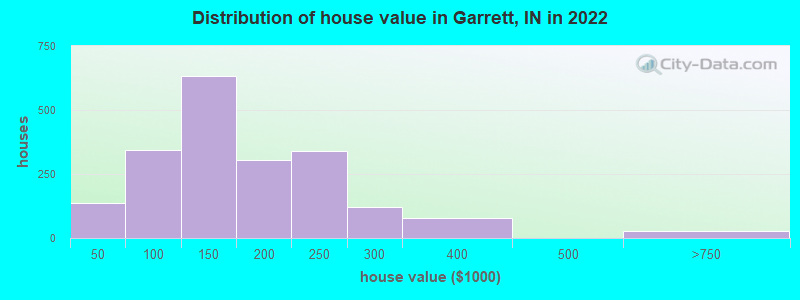
Home value of owner - occupied houses in 2022 in Garrett, IN
-
- 72Less than $10,000
- 39$10,000 to $14,999
- 15$15,000 to $19,999
- 8$30,000 to $34,999
- 10$50,000 to $59,999
- 50$60,000 to $69,999
- 70$70,000 to $79,999
- 77$80,000 to $89,999
- 131$90,000 to $99,999
- 379$100,000 to $124,999
- 253$125,000 to $149,999
- 151$150,000 to $174,999
- 152$175,000 to $199,999
- 337$200,000 to $249,999
- 123$250,000 to $299,999
- 80$300,000 to $399,999
- 15$500,000 to $749,999
- 10$1,500,000 to $1,999,999
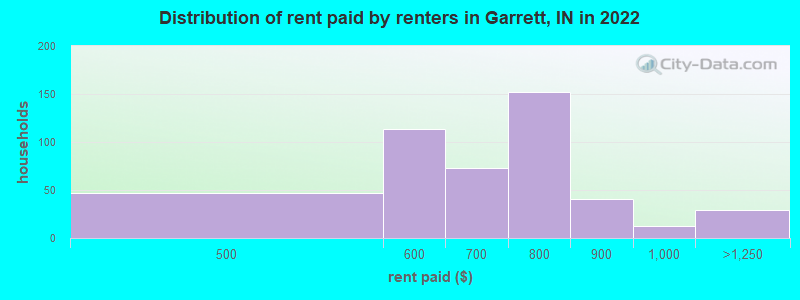
Rent paid by renters in 2022 in Garrett, IN
-
- 13$400 to $449
- 33$450 to $499
- 81$500 to $549
- 32$550 to $599
- 15$600 to $649
- 57$650 to $699
- 69$700 to $749
- 82$750 to $799
- 40$800 to $899
- 12$900 to $999
- 29$1,000 to $1,249
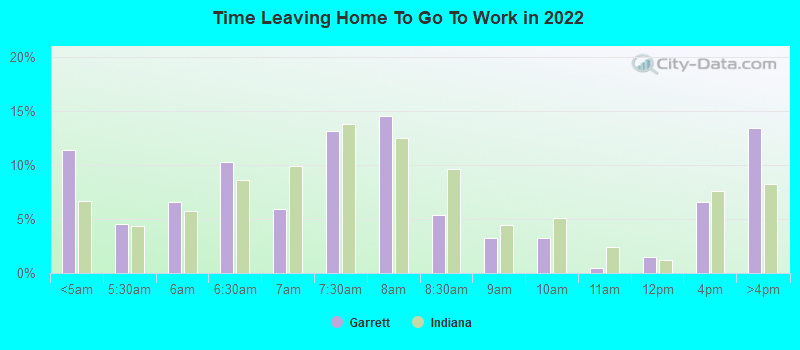
Percentage of workers working in this county: 59.9%
Number of people working at home: 65 (2.0% of all workers)
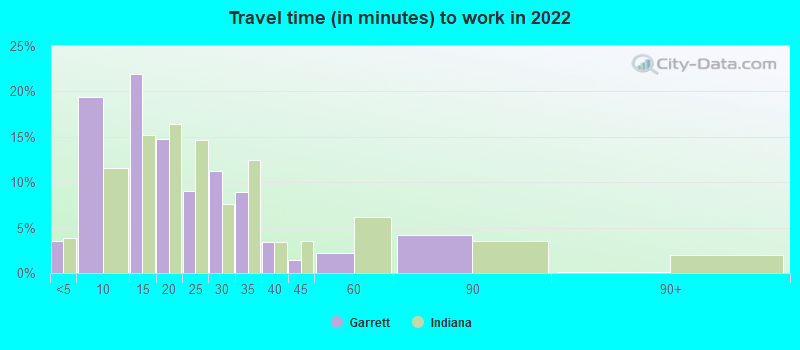
Travel time to work (commute)
- Less than 5 minutes: 112
- 5 to 9 minutes: 444
- 10 to 14 minutes: 707
- 15 to 19 minutes: 426
- 20 to 24 minutes: 422
- 25 to 29 minutes: 227
- 30 to 34 minutes: 352
- 35 to 39 minutes: 79
- 40 to 44 minutes: 84
- 45 to 59 minutes: 99
- 60 to 89 minutes: 118
- 90 or more minutes: 29
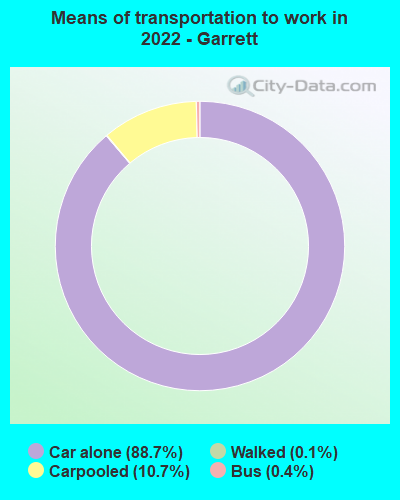
Means of transportation to work:
- Drove a car alone: 2,329 (83.8%)
- Carpooled: 308 (11.1%)
- Bus: 11 (0.4%)
- Walked: 3 (0.1%)
- Worked at home: 65 (2.3%)
- Unemployment by race in 2022
- Unemployment rate for White non-Hispanic residents
- 6.2%Males
- 1.4%Females
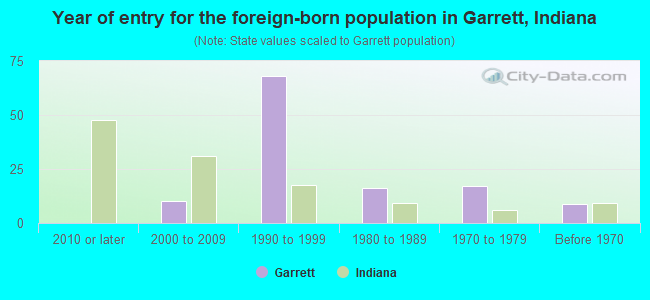
- Year of entry for the foreign-born population in Garrett, Indiana
- 02010 or later
- 102000 to 2009
- 681990 to 1999
- 161980 to 1989
- 171970 to 1979
- 9Before 1970
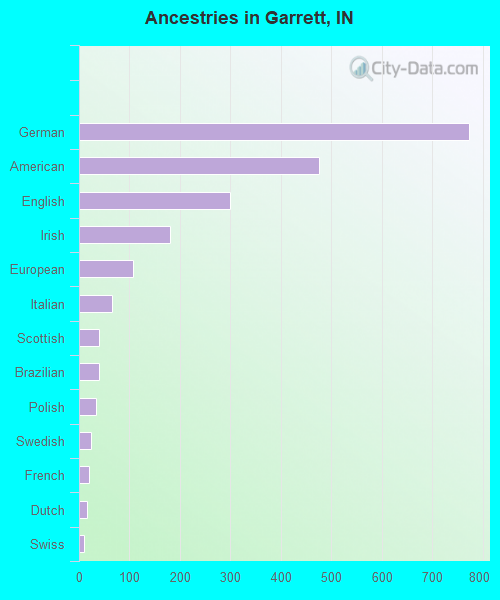
First ancestries reported:
- German: 774 (27.6%)
- American: 475 (17.0%)
- English: 300 (10.7%)
- Irish: 181 (6.5%)
- European: 108 (3.9%)
- Italian: 66 (2.4%)
- Scottish: 40 (1.4%)
- Brazilian: 39 (1.4%)
- Polish: 34 (1.2%)
- Swedish: 23 (0.8%)
- French: 20 (0.7%)
- Dutch: 16 (0.6%)
- Swiss: 9 (0.3%)
- Eastern European: 6 (0.2%)
- Scandinavian: 5 (0.2%)
Most common places of birth for foreign-born residents (%):
| Garrett: | 51.0% (50) |
| Indiana: | 0.7% (2,626) |
| Garrett: | 45.9% (45) |
| Indiana: | 0.8% (3,114) |
| Garrett: | 25.5% (25) |
| Indiana: | 3.1% (11,851) |
Place of birth for U.S.-born residents:
- This state: 4,935
- Other state: 1,396
- Northeast: 88
- Midwest: 740
- South: 467
- West: 94
87.2% of Garrett residents lived in the same house 1 years ago.
Out of people who lived in different houses, 28.7% lived in this county.
Out of people who lived in different counties, 99.2% lived in Indiana.
| Garrett: | 87.2% |
| State average: | 87.1% |
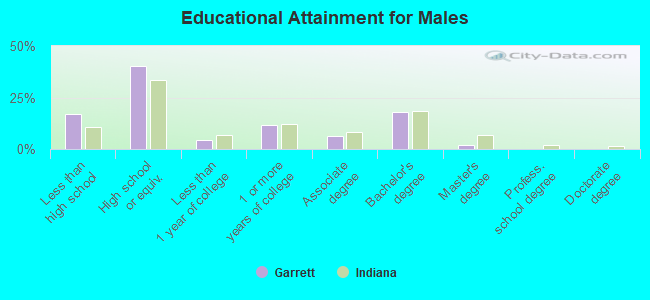
Education attainment for males 25 years and older:
- No schooling: 73
- Nursery to 4th grade: 3
- 5th and 6th grade: 0
- 7th and 8th grade: 2
- 9th grade: 25
- 10th grade: 83
- 11th grade: 106
- 12th grade, no diploma: 60
- High school graduate (or equivalency): 836
- Less than 1 year of college: 90
- Some college more than 1 year, no degree: 243
- Associate degree: 131
- Bachelor's degree: 376
- Master's degree: 43
- Professional school degree: 0
- Doctorate degree: 0
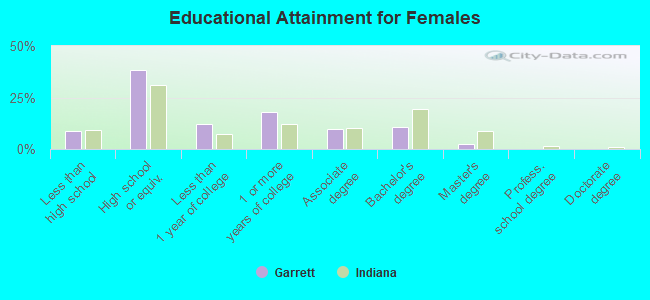
Education attainment for females 25 years and older:
- No schooling: 0
- Nursery to 4th grade: 0
- 5th and 6th grade: 0
- 7th and 8th grade: 53
- 9th grade: 51
- 10th grade: 53
- 11th grade: 18
- 12th grade, no diploma: 25
- High school graduate (or equivalency): 870
- Less than 1 year of college: 279
- Some college more than 1 year, no degree: 401
- Associate degree: 220
- Bachelor's degree: 239
- Master's degree: 53
- Professional school degree: 0
- Doctorate degree: 0
Housing units in structures:
- One, detached: 2,304
- One, attached: 29
- Two: 86
- 3 or 4: 170
- 5 to 9: 54
- 10 to 19: 69
- 20 to 49: 26
- Mobile homes: 124
Median worth of mobile homes: $11,985
Housing units lacking complete kitchen facilities in 2022: 1.1%
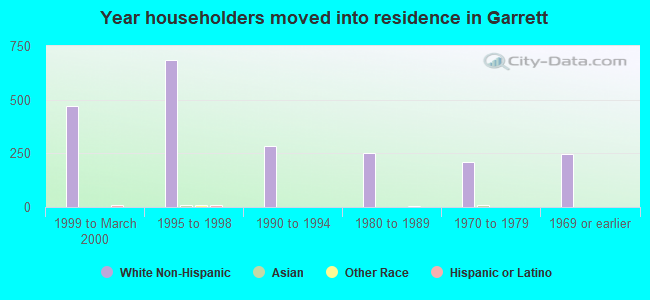
House/condo owner moved in on average 8 years ago
Renter moved in on average 5 years ago
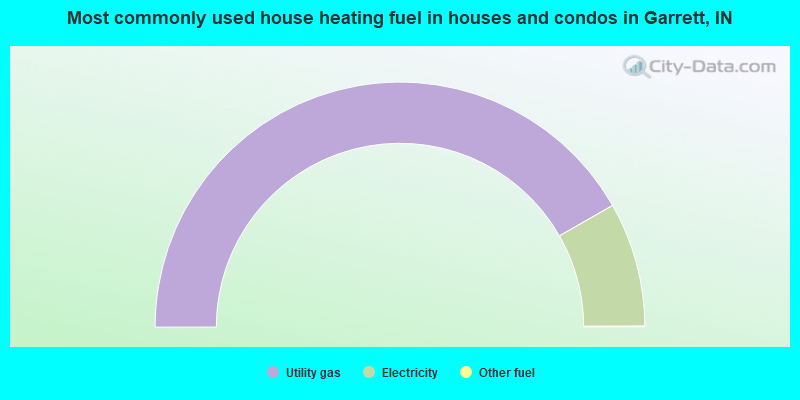
- 83.4%Utility gas
- 16.4%Electricity
- 0.1%Other fuel
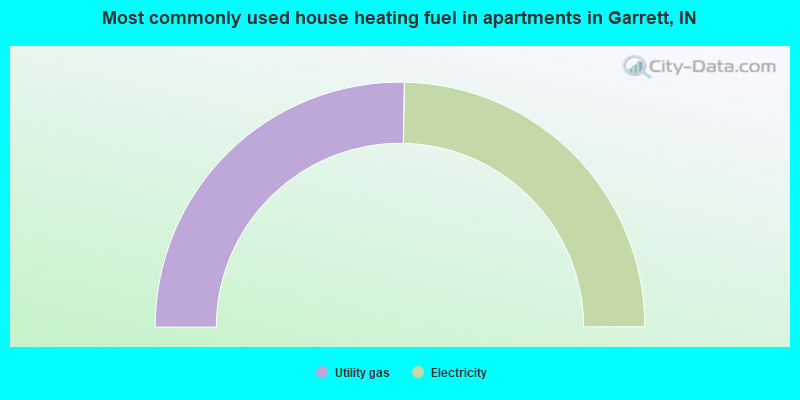
- 50.6%Utility gas
- 49.4%Electricity
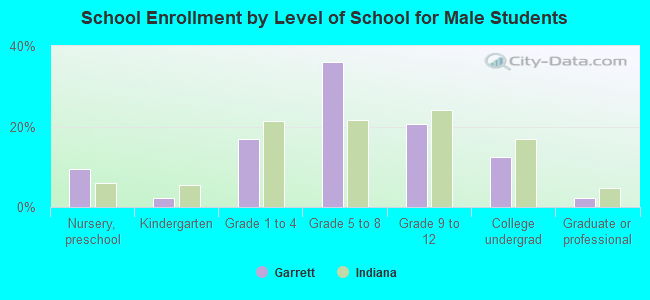
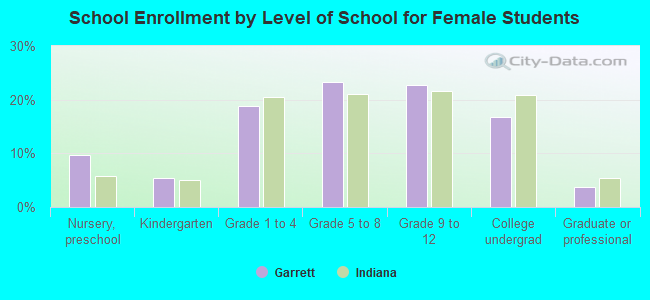
Private vs. public school enrollment:
| Here: | 11.5% |
| Indiana: | 14.9% |
| Here: | 4.0% |
| Indiana: | 11.4% |
| Here: | 9.9% |
| Indiana: | 22.3% |