Genola, UT (Utah) Houses and Residents
| Genola: | $675,041 |
| Utah: | $499,500 |
Mean price in 2022:
Detached houses: $533,692
Here: $533,692 State: $607,750 Mobile homes: $326,587
Here: $326,587 State: $113,475
Total population: 1,408 (Urban population: 0, Rural population: 1,002 (201 farm, 801 nonfarm))
Houses: 474 (442 occupied: 406 owner occupied, 37 renter occupied)
| % of renters here: | 8% |
| State: | 29% |
Housing density: 37 houses/condos per square mile
Median price asked for vacant for-sale houses and condos in 2022 in this county: $1,282,768.
Median contract rent in 2022: $577 (lower quartile is $100, upper quartile is $921)
Median rent asked for vacant for-rent units in 2022: $640
Median gross rent in Genola, UT in 2022: $948
Housing units in Genola with a mortgage: 262 (53 second mortgage, 0 home equity loan, 59 both second mortgage and home equity loan)
Houses without a mortgage: 0
Median household income for houses/condos with a mortgage: $145,064
Median household income for apartments without a mortgage: $78,572
Median monthly housing costs: $1,694
Compare current foreclosures near Genola, UT:
| Photo | Address | Area | Beds / Baths | Price | Details |
|---|---|---|---|---|---|

|
#1
S 2000 E
Spanish Fork, UT 84660
|
1,273 sq. feet
|
2 baths 3 beds |
show details | |

|
#2
E 180 N
Santaquin, UT 84655
|
- sq. feet
|
2 baths 3 beds |
show details | |

|
#3
S Chrisman Dr
Salem, UT 84653
|
2,838 sq. feet
|
3 baths 6 beds |
show details | |

|
#4
S 2600 E
Spanish Fork, UT 84660
|
2,057 sq. feet
|
3 baths 4 beds |
show details | |

|
#5
N Orchard Ln
Santaquin, UT 84655
|
565 sq. feet
|
1 baths 2 beds |
show details | |

|
#6
N 300 E
Spanish Fork, UT 84660
|
1,762 sq. feet
|
1 baths 3 beds |
show details | |

|
#7
E 1000 S
Spanish Fork, UT 84660
|
2,826 sq. feet
|
4 baths 5 beds |
show details | |

|
#8
W 700 N
Spanish Fork, UT 84660
|
2,813 sq. feet
|
3 baths 7 beds |
show details | |

|
#9
N 100 W
Spanish Fork, UT 84660
|
1,724 sq. feet
|
2 baths 4 beds |
show details | |

|
#10
E 1025 S
Spanish Fork, UT 84660
|
1,455 sq. feet
|
2 baths 3 beds |
show details |
| Photo | Address | Area | Beds / Baths | Price | Details |
|---|---|---|---|---|---|

|
#11
W 600 N
Spanish Fork, UT 84660
|
2,280 sq. feet
|
3 baths 10 beds |
show details | |

|
#12
S 300 E
Spanish Fork, UT 84660
|
2,179 sq. feet
|
2 baths 6 beds |
show details | |

|
#13
S 1230 E
Spanish Fork, UT 84660
|
2,467 sq. feet
|
3 baths 3 beds |
show details | |

|
#14
Stonebrook Ln
Santaquin, UT 84655
|
1,486 sq. feet
|
2 baths 3 beds |
show details | |

|
#15
E 100 S
Spanish Fork, UT 84660
|
1,964 sq. feet
|
2 baths 3 beds |
show details | |

|
#16
E River Bottom Rd
Spanish Fork, UT 84660
|
2,032 sq. feet
|
2 baths 2 beds |
show details | |

|
#17
W 350 S
Spanish Fork, UT 84660
|
1,089 sq. feet
|
2 baths 3 beds |
show details | |

|
#18
W 250 S
Spanish Fork, UT 84660
|
1,576 sq. feet
|
2 baths 3 beds |
show details | |

|
#19
S 420 W
Salem, UT 84653
|
1,899 sq. feet
|
2 baths 3 beds |
show details | |

|
#20
E 320 N
Salem, UT 84653
|
2,536 sq. feet
|
2 baths 4 beds |
show details |
| Photo | Address | Area | Beds / Baths | Price | Details |
|---|---|---|---|---|---|

|
#21
E 960 S
Salem, UT 84653
|
3,465 sq. feet
|
3 baths 3 beds |
show details | |

|
#22
W 760 S
Salem, UT 84653
|
1,313 sq. feet
|
2 baths 3 beds |
show details | |

|
#23
Cougar Cir
Payson, UT 84651
|
1,627 sq. feet
|
2 baths 3 beds |
show details | |

|
#24
S Canyon Rd
Santaquin, UT 84655
|
1,970 sq. feet
|
2 baths 3 beds |
show details | |

|
#25
Scenic Dr
Spanish Fork, UT 84660
|
1,508 sq. feet
|
2 baths 4 beds |
show details | |

|
#26
N 700 E
Spanish Fork, UT 84660
|
1,800 sq. feet
|
1 baths 3 beds |
show details | |

|
#27
E 1130 S
Spanish Fork, UT 84660
|
1,409 sq. feet
|
2 baths 3 beds |
show details | |

|
#28
Willow Way
Spanish Fork, UT 84660
|
1,549 sq. feet
|
2 baths 3 beds |
show details | |

|
#29
E 900 S
Springville, UT 84663
|
1,922 sq. feet
|
2 baths 3 beds |
show details | |

|
#30
S 200 E
Springville, UT 84663
|
2,228 sq. feet
|
3 baths 4 beds |
show details |
| Photo | Address | Area | Beds / Baths | Price | Details |
|---|---|---|---|---|---|

|
#31
E 1000 S
Springville, UT 84663
|
2,427 sq. feet
|
3 baths 4 beds |
show details | |

|
#32
S 625 E
Springville, UT 84663
|
2,308 sq. feet
|
2 baths 4 beds |
show details | |

|
#33
S Artistic Cir
Springville, UT 84663
|
2,520 sq. feet
|
2 baths 6 beds |
show details | |

|
#34
W 250 N
Springville, UT 84663
|
1,914 sq. feet
|
2 baths 4 beds |
show details | |

|
#35
Cimmaron Dr
Springville, UT 84663
|
1,565 sq. feet
|
2 baths 3 beds |
show details | |

|
#36
Renaissance Way
Springville, UT 84663
|
3,238 sq. feet
|
3 baths 3 beds |
show details | |

|
#37
Willow Way
Spanish Fork, UT 84660
|
1,549 sq. feet
|
2 baths 3 beds |
show details | |

|
#38
Tomahawk Dr
Payson, UT 84651
|
1,080 sq. feet
|
1 baths 3 beds |
show details | |

|
#39
N Ridge Way
Spanish Fork, UT 84660
|
1,900 sq. feet
|
2 baths 3 beds |
show details | |

|
#40
E 1530 S
Spanish Fork, UT 84660
|
1,012 sq. feet
|
2 baths 3 beds |
show details |
| Photo | Address | Area | Beds / Baths | Price | Details |
|---|---|---|---|---|---|

|
#41
S 2900 E
Spanish Fork, UT 84660
|
1,399 sq. feet
|
2 baths 3 beds |
show details | |

|
#42
N 1400 E
Spanish Fork, UT 84660
|
1,354 sq. feet
|
2 baths 3 beds |
show details | |

|
#43
S 2600 E
Spanish Fork, UT 84660
|
1,223 sq. feet
|
2 baths 3 beds |
show details | |

|
#44
N 1280 E
Spanish Fork, UT 84660
|
2,577 sq. feet
|
2 baths 4 beds |
show details | |

|
#45
E 1120 S
Spanish Fork, UT 84660
|
2,018 sq. feet
|
2 baths 4 beds |
show details | |

|
#46
S 1850 E
Spanish Fork, UT 84660
|
1,670 sq. feet
|
2 baths 3 beds |
show details | |

|
#47
Mountain View Dr
Spanish Fork, UT 84660
|
2,604 sq. feet
|
3 baths 5 beds |
show details | |

|
#48
S 1600 W
Payson, UT 84651
|
3,136 sq. feet
|
2 baths 6 beds |
show details | |

|
#49
N 370 W
Spanish Fork, UT 84660
|
2,012 sq. feet
|
2 baths 5 beds |
show details | |

|
Check over 1 million property listings on Foreclosure.com!
|
browse all offers | |||

Latest news about housing in Genola, UT collected exclusively by city-data.com from local newspapers, TV, and radio stations

 | FBI Total Crime Rates for Every City in Utah (10 replies) |
| Is there any rural living left in Spanish Fork? (4 replies) |

Median year apartment built: 1972
Household type by relationship:
Households: 1,738- Male householders: 262 (20 living alone), Female householders: 165 (13 living alone)
305 spouses (299 opposite-sex spouses), 21 unmarried partners, (21 opposite-sex unmarried partners), 853 children (832 natural, 10 adopted, 10 stepchildren), 17 grandchildren, 21 brothers or sisters, 32 parents, 0 foster children, 28 other relatives, 2 non-relatives
- In group quarters: 27
Size of family households: 79 2-persons, 55 3-persons, 92 4-persons, 70 5-persons, 33 6-persons, 72 7-or-more-persons.
Size of nonfamily households: 36 1-person.
632 married couples with children.
21 single-parent households (0 men, 21 women).
94.4% of residents of Genola speak English at home.
3.2% of residents speak Spanish at home (79% speak English very well, 21% speak English well).
0.7% of residents speak other Indo-European language at home (100% speak English very well).
0.7% of residents speak Asian or Pacific Island language at home (100% speak English very well).
Foreign born population: 22 (1.3%)
(4.5% of them are naturalized citizens)
| Here: | 9.9 |
| State: | 7.6 |
| Here: | 5.8 |
| State: | 4.3 |

- Bedrooms in owner-occupied houses and condos in Genola, Utah
- 0no bedroom
- 01 bedroom
- 202 bedrooms
- 913 bedrooms
- 1074 bedrooms
- 1895+ bedrooms

- Bedrooms in renter-occupied apartments in Genola, Utah
- 0no bedroom
- 01 bedroom
- 112 bedrooms
- 93 bedrooms
- 94 bedrooms
- 95+ bedrooms

- Cars and other vehicles available in Genola in owner-occupied houses/condos
- 2no vehicle
- 251 vehicle
- 812 vehicles
- 1363 vehicles
- 744 vehicles
- 875+ vehicles

- Cars and other vehicles available in Genola in renter-occupied apartments
- 0no vehicle
- 91 vehicle
- 22 vehicles
- 173 vehicles
- 94 vehicles
- 05+ vehicles

- Rooms in owner-occupied houses in Genola, Utah
- 01 room
- 02 rooms
- 03 rooms
- 164 rooms
- 335 rooms
- 266 rooms
- 577 rooms
- 578 rooms
- 2179+ rooms

- Rooms in renter-occupied apartments in Genola, Utah
- 01 room
- 02 rooms
- 73 rooms
- 34 rooms
- 75 rooms
- 76 rooms
- 07 rooms
- 28 rooms
- 129+ rooms


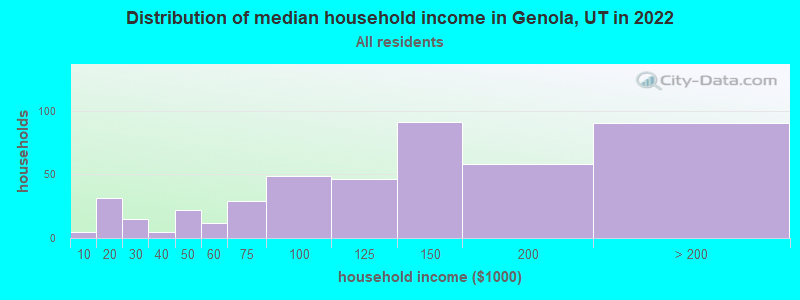
Genola, UT household income distribution

- 5Less than $10,000
- 31$10,000 to $19,999
- 15$20,000 to $29,999
- 5$30,000 to $39,999
- 22$40,000 to $49,999
- 12$50,000 to $59,999
- 29$60,000 to $74,999
- 49$75,000 to $99,999
- 46$100,000 to $124,999
- 91$125,000 to $149,999
- 58$150,000 to $199,999
- 90$200,000 or more
Home value of owner - occupied houses in 2022 in Genola, UT
-
- 2$30,000 to $34,999
- 3$50,000 to $59,999
- 10$70,000 to $79,999
- 2$175,000 to $199,999
- 4$200,000 to $249,999
- 6$250,000 to $299,999
- 32$300,000 to $399,999
- 74$400,000 to $499,999
- 197$500,000 to $749,999
- 119$750,000 to $999,999
- 27$1,000,000 to $1,499,999
- 3$1,500,000 to $1,999,999
- 8$2,000,000 or more

Rent paid by renters in 2022 in Genola, UT
-
- 8Less than $100
- 6$400 to $449
- 1$550 to $599
- 7$800 to $899
- 2$1,000 to $1,249
- 2$1,500 to $1,999
- 7No cash rent


Percentage of workers working in this county: 87.9%
Number of people working at home: 98 (12.3% of all workers)
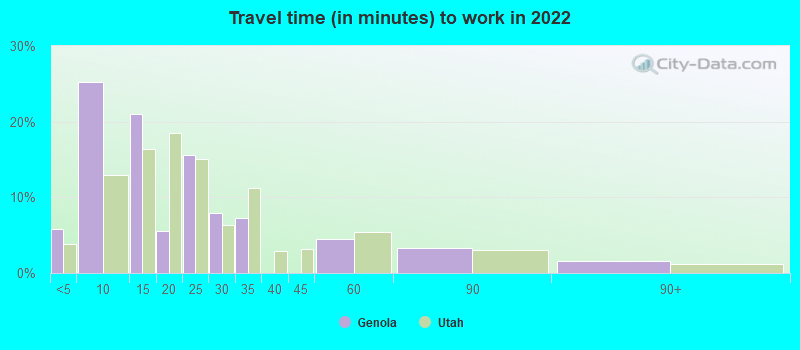
Travel time to work (commute)
- Less than 5 minutes: 30
- 5 to 9 minutes: 81
- 10 to 14 minutes: 48
- 15 to 19 minutes: 63
- 20 to 24 minutes: 93
- 25 to 29 minutes: 61
- 30 to 34 minutes: 76
- 35 to 39 minutes: 9
- 40 to 44 minutes: 73
- 45 to 59 minutes: 80
- 60 to 89 minutes: 26
- 90 or more minutes: 14
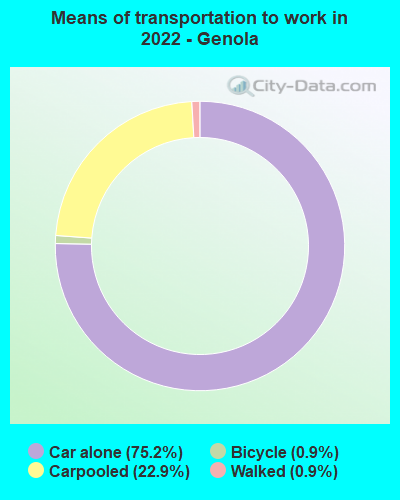
Means of transportation to work:
- Drove a car alone: 333 (61.7%)
- Carpooled: 100 (18.5%)
- Bicycle: 4 (0.7%)
- Walked: 3 (0.6%)
- Worked at home: 98 (18.1%)

- Unemployment by race in 2022
- Unemployment rate for White non-Hispanic residents
- 1.4%Males
- 0.9%Females

- Year of entry for the foreign-born population in Genola, Utah
- 172010 or later
- 52000 to 2009
- 01990 to 1999
- 151980 to 1989
- 101970 to 1979
- 2Before 1970

First ancestries reported:
- English: 380 (54.2%)
- European: 66 (9.4%)
- Danish: 52 (7.4%)
- American: 49 (7.0%)
- Norwegian: 24 (3.4%)
- Scottish: 17 (2.4%)
- Swedish: 6 (0.9%)
- Swiss: 6 (0.9%)
- German: 5 (0.7%)
- Irish: 3 (0.4%)
- Northern European: 3 (0.4%)
- Welsh: 2 (0.3%)
- British: 1 (0.1%)
- Lithuanian: 1 (0.1%)
- Scotch-Irish: 1 (0.1%)
Most common places of birth for foreign-born residents (%):
| Genola: | 42.9% (9) |
| Utah: | 0.2% (415) |
| Genola: | 14.3% (3) |
| Utah: | 36.1% (99,740) |
| Genola: | 14.3% (3) |
| Utah: | 1.3% (3,570) |
Place of birth for U.S.-born residents:
- This state: 1,410
- Other state: 280
- Northeast: 15
- Midwest: 41
- South: 37
- West: 185
98.9% of Genola residents lived in the same house 1 years ago.
Out of people who lived in different houses, 26.6% lived in this county.
Out of people who lived in different counties, 0.0% lived in Utah.
| Genola: | 98.9% |
| State average: | 85.7% |
Education attainment for males 25 years and older:
- No schooling: 5
- Nursery to 4th grade: 10
- 5th and 6th grade: 1
- 7th and 8th grade: 0
- 9th grade: 0
- 10th grade: 0
- 11th grade: 3
- 12th grade, no diploma: 33
- High school graduate (or equivalency): 89
- Less than 1 year of college: 42
- Some college more than 1 year, no degree: 128
- Associate degree: 59
- Bachelor's degree: 51
- Master's degree: 42
- Professional school degree: 17
- Doctorate degree: 8

Education attainment for females 25 years and older:
- No schooling: 2
- Nursery to 4th grade: 0
- 5th and 6th grade: 0
- 7th and 8th grade: 0
- 9th grade: 0
- 10th grade: 1
- 11th grade: 0
- 12th grade, no diploma: 0
- High school graduate (or equivalency): 109
- Less than 1 year of college: 42
- Some college more than 1 year, no degree: 70
- Associate degree: 74
- Bachelor's degree: 75
- Master's degree: 20
- Professional school degree: 2
- Doctorate degree: 2


Housing units in structures:
- One, detached: 457
- One, attached: 3
- Two: 4
- Mobile homes: 9
Housing units lacking complete kitchen facilities in 2022: 0.9%
House/condo owner moved in on average 13 years ago
Renter moved in on average 7 years ago

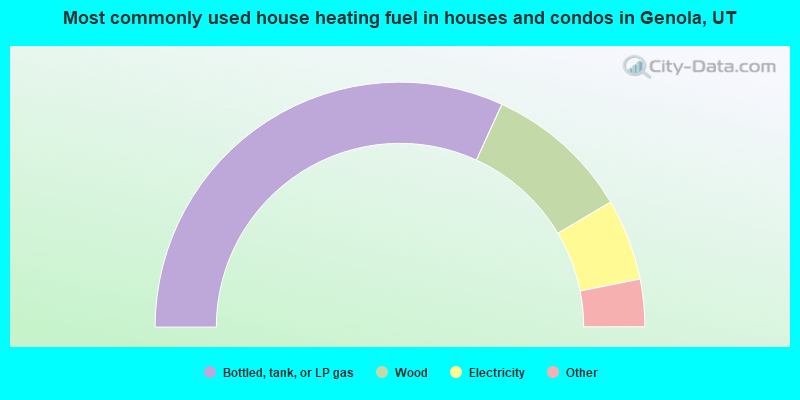
- 64.0%Bottled, tank, or LP gas
- 19.4%Wood
- 10.8%Electricity
- 2.4%Utility gas
- 1.9%Other fuel
- 0.8%Fuel oil, kerosene, etc.
- 0.8%Solar energy
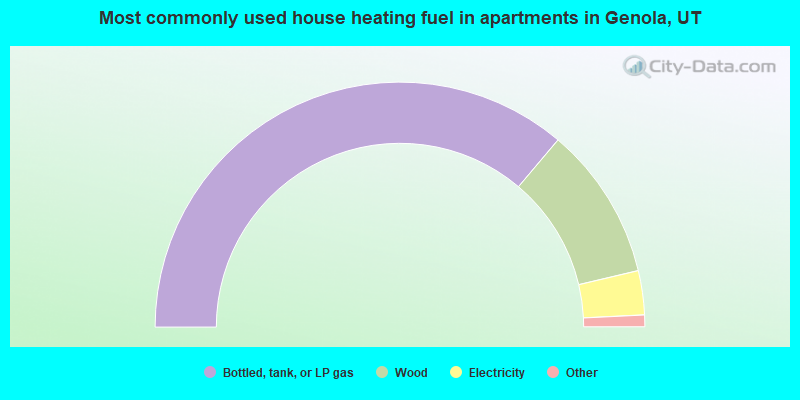
- 73.5%Bottled, tank, or LP gas
- 20.6%Wood
- 5.9%Electricity
Private vs. public school enrollment:
| Here: | 29.6% |
| Utah: | 7.2% |
| Here: | 1.4% |
| Utah: | 5.3% |
| Here: | 24.1% |
| Utah: | 26.7% |


