Gerber-Las Flores, CA (California) Houses and Residents
| Gerber-Las Flores: | $228,890 |
| California: | $715,900 |
Total population: 1,503 (Urban population: 1,177 (all inside urban clusters), Rural population: 192 (all nonfarm))
Houses: 473 (459 occupied: 315 owner occupied, 144 renter occupied)
| % of renters here: | 31% |
| State: | 44% |
Housing density: 376 houses/condos per square mile
Median price asked for vacant for-sale houses and condos in 2022 in this county: $339,234.
Median contract rent in 2022: $637 (lower quartile is $475, upper quartile is $802)
Median rent asked for vacant for-rent units in 2022: $1,101
Median gross rent in Gerber-Las Flores, CA in 2022: $1,012
Housing units in Gerber-Las Flores with a mortgage: 79 (6 second mortgage, 12 home equity loan, 0 both second mortgage and home equity loan)
Houses without a mortgage: 96


Household type by relationship:
Households: 62,621- In family households: 53,728 (11,417 male householders, 5,225 female householders)
12,154 spouses, 18,409 children (16,658 natural, 549 adopted, 1,202 stepchildren), 1,613 grandchildren, 649 brothers or sisters, 603 parents, foster children, 954 other relatives, 2,230 non-relatives
- In nonfamily households: 8,893 (3,438 male householders (2,620 living alone)), 3,687 female householders (3,092 living alone)), 1,768 nonrelatives
- In group quarters: 842 (505 institutionalized population)
9,613 married couples with children.
3,896 single-parent households (1,086 men, 2,810 women).
52.7% of residents of Gerber-Las Flores speak English at home.
46.7% of residents speak Spanish at home (38% speak English very well, 30% speak English well, 23% speak English not well, 10% don't speak English at all).
0.6% of residents speak other Indo-European language at home (100% speak English very well).
Foreign born population: 603 (37.9%)
(35.2% of them are naturalized citizens)
| Here: | 4.7 |
| State: | 6.0 |
| Here: | 4.4 |
| State: | 3.9 |

- Bedrooms in owner-occupied houses and condos in Gerber-Las Flores, California
- 0no bedroom
- 451 bedroom
- 1332 bedrooms
- 1313 bedrooms
- 64 bedrooms
- 05+ bedrooms

- Bedrooms in renter-occupied apartments in Gerber-Las Flores, California
- 0no bedroom
- 321 bedroom
- 992 bedrooms
- 133 bedrooms
- 04 bedrooms
- 05+ bedrooms

- Cars and other vehicles available in Gerber-Las Flores in owner-occupied houses/condos
- 7no vehicle
- 771 vehicle
- 1722 vehicles
- 433 vehicles
- 164 vehicles
- 05+ vehicles

- Cars and other vehicles available in Gerber-Las Flores in renter-occupied apartments
- 31no vehicle
- 521 vehicle
- 472 vehicles
- 143 vehicles
- 04 vehicles
- 05+ vehicles

- Rooms in owner-occupied houses in Gerber-Las Flores, California
- 01 room
- 342 rooms
- 233 rooms
- 994 rooms
- 675 rooms
- 656 rooms
- 207 rooms
- 78 rooms
- 09+ rooms

- Rooms in renter-occupied apartments in Gerber-Las Flores, California
- 01 room
- 132 rooms
- 183 rooms
- 874 rooms
- 205 rooms
- 06 rooms
- 67 rooms
- 08 rooms
- 09+ rooms


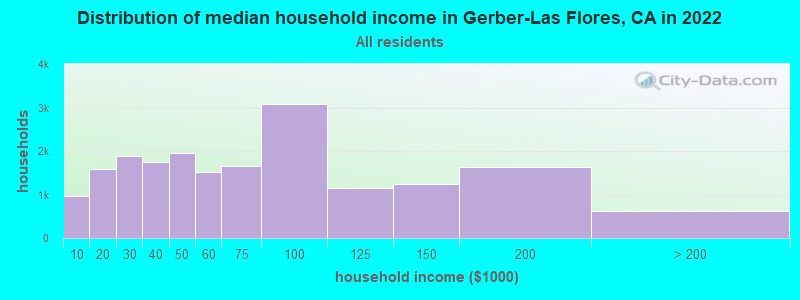
Gerber-Las Flores, CA household income distribution

- 957Less than $10,000
- 1,585$10,000 to $19,999
- 1,894$20,000 to $29,999
- 1,747$30,000 to $39,999
- 1,957$40,000 to $49,999
- 1,527$50,000 to $59,999
- 1,663$60,000 to $74,999
- 3,071$75,000 to $99,999
- 1,143$100,000 to $124,999
- 1,235$125,000 to $149,999
- 1,626$150,000 to $199,999
- 620$200,000 or more
Percentage of workers working in this county: 75.8%
Number of people working at home: 91 (17.0% of all workers)
Travel time to work (commute)
- Less than 5 minutes: 0
- 5 to 9 minutes: 44
- 10 to 14 minutes: 65
- 15 to 19 minutes: 131
- 20 to 24 minutes: 89
- 25 to 29 minutes: 8
- 30 to 34 minutes: 26
- 35 to 39 minutes: 0
- 40 to 44 minutes: 0
- 45 to 59 minutes: 13
- 60 to 89 minutes: 13
- 90 or more minutes: 8
Means of transportation to work:
- Drove a car alone: 295 (70.1%)
- Carpooled: 96 (22.8%)
- Other means: 6 (1.4%)
- Worked at home: 24 (5.7%)

- Year of entry for the foreign-born population in Gerber-Las Flores, California
- 171995 to March 2000
- 661990 to 1994
- 981985 to 1989
- 731980 to 1984
- 211975 to 1979
- 371970 to 1974
- 91965 to 1969
- 38Before 1965
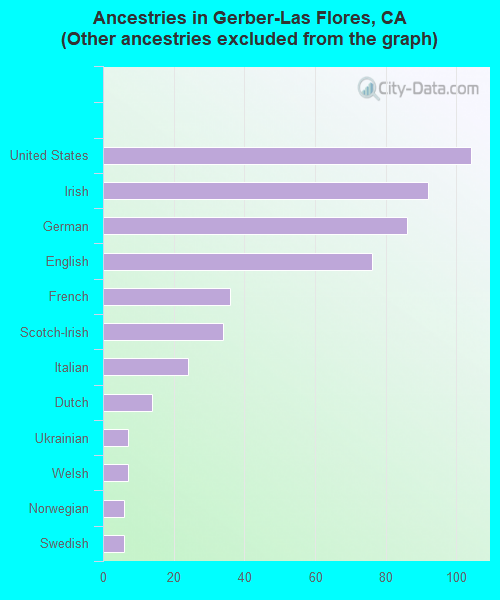
First ancestries reported:
- Other: 788 (61.6%)
- United States: 104 (8.1%)
- Irish: 92 (7.2%)
- German: 86 (6.7%)
- English: 76 (5.9%)
- French: 36 (2.8%)
- Scotch-Irish: 34 (2.7%)
- Italian: 24 (1.9%)
- Dutch: 14 (1.1%)
- Ukrainian: 7 (0.5%)
- Welsh: 7 (0.5%)
- Norwegian: 6 (0.5%)
- Swedish: 6 (0.5%)
Most common places of birth for foreign-born residents (%):
| Gerber-Las Flores: | 96.7% (347) |
| California: | 44.3% (3,928,701) |
| Gerber-Las Flores: | 1.9% (7) |
| California: | 0.1% (12,122) |
Place of birth for U.S.-born residents:
- This state: 773
- Other state: 220
- Northeast: 15
- Midwest: 61
- South: 67
- West: 77
60% of Gerber-Las Flores residents lived in the same house 5 years ago.
Out of people who lived in different houses, 56% lived in this county.
Out of people who lived in different counties, 87% lived in California.
Education attainment for males 25 years and older:
- No schooling: 24
- Nursery to 4th grade: 33
- 5th and 6th grade: 48
- 7th and 8th grade: 6
- 9th grade: 15
- 10th grade: 18
- 11th grade: 0
- 12th grade, no diploma: 32
- High school graduate (or equivalency): 120
- Less than 1 year of college: 30
- Some college more than 1 year, no degree: 41
- Associate degree: 22
- Bachelor's degree: 7
- Master's degree: 0
- Professional school degree: 0
- Doctorate degree: 0

Education attainment for females 25 years and older:
- No schooling: 11
- Nursery to 4th grade: 21
- 5th and 6th grade: 15
- 7th and 8th grade: 4
- 9th grade: 38
- 10th grade: 39
- 11th grade: 51
- 12th grade, no diploma: 5
- High school graduate (or equivalency): 124
- Less than 1 year of college: 39
- Some college more than 1 year, no degree: 33
- Associate degree: 6
- Bachelor's degree: 8
- Master's degree: 0
- Professional school degree: 0
- Doctorate degree: 0


Housing units in structures:
- One, detached: 245
- One, attached: 17
- 3 or 4: 7
- 5 to 9: 7
- Mobile homes: 197
Median worth of mobile homes: $156,483

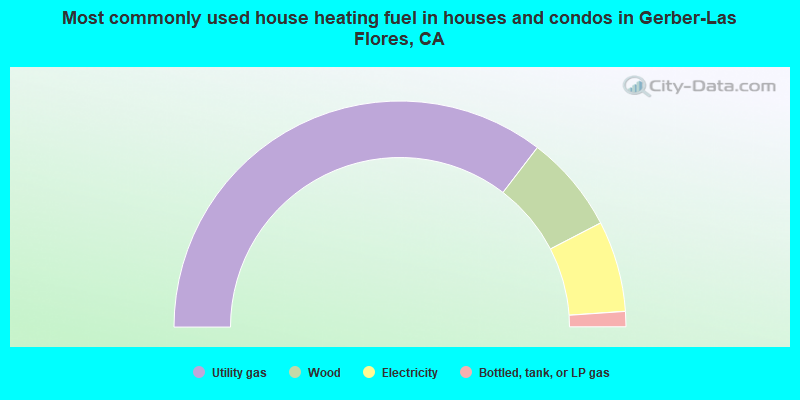
- 70.8%Utility gas
- 14.0%Wood
- 13.0%Electricity
- 2.2%Bottled, tank, or LP gas
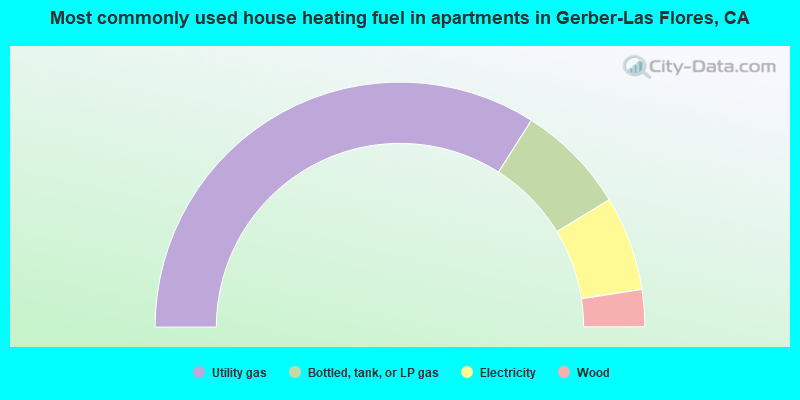
- 68.1%Utility gas
- 14.6%Bottled, tank, or LP gas
- 12.5%Electricity
- 4.9%Wood
Private vs. public school enrollment:
| Here: | 0.0% |
| California: | 9.9% |
| Here: | 0.0% |
| California: | 7.8% |
| Here: | 0.0% |
| California: | 15.4% |


