Gilbert, IA (Iowa) Houses and Residents
| Gilbert: | $281,449 |
| Iowa: | $194,600 |
Total population: 1,099 (Urban population: 0, Rural population: 990 (10 farm, 980 nonfarm))
Houses: 501 (501 occupied: 429 owner occupied, 79 renter occupied)
| % of renters here: | 16% |
| State: | 28% |
Housing density: 607 houses/condos per square mile
Median price asked for vacant for-sale houses and condos in 2022 in this county: $150,013.
Median contract rent in 2022: $609 (lower quartile is $512, upper quartile is $897)
Median rent asked for vacant for-rent units in 2022: $617
Median gross rent in Gilbert, IA in 2022: $820
Housing units in Gilbert with a mortgage: 317 (68 second mortgage, 2 home equity loan, 66 both second mortgage and home equity loan)
Houses without a mortgage: 0
Median household income for houses/condos with a mortgage: $127,381
Median household income for apartments without a mortgage: $140,025
Median monthly housing costs: $1,330
Compare current foreclosures near Gilbert, IA:
| Photo | Address | Area | Beds / Baths | Price | Details |
|---|---|---|---|---|---|

|
#1
Monona St
Boone, IA 50036
|
1,239 sq. feet
|
1 baths 3 beds |
$164,500
|
show details |

|
#2
Main St
Boone, IA 50036
|
- sq. feet
|
2 baths 3 beds |
$102,500
|
show details |

|
#3
2nd St
Boone, IA 50036
|
820 sq. feet
|
1 baths 2 beds |
show details | |

|
#4
Ford St
Kelley, IA 50134
|
1,024 sq. feet
|
1 baths 3 beds |
show details | |

|
#5
SW 3rd St
Nevada, IA 50201
|
2,479 sq. feet
|
4 baths 4 beds |
show details | |

|
#6
Garst Ave
Boone, IA 50036
|
840 sq. feet
|
4 baths 2 beds |
show details | |

|
#7
S Logan St
Roland, IA 50236
|
1,170 sq. feet
|
3 baths 4 beds |
show details | |

|
#8
Union St
Boone, IA 50036
|
832 sq. feet
|
1 baths 2 beds |
show details | |

|
#9
21st St
Boone, IA 50036
|
864 sq. feet
|
2 baths 3 beds |
show details | |

|
#10
Boone St
Boone, IA 50036
|
2,734 sq. feet
|
3 baths 4 beds |
show details |
| Photo | Address | Area | Beds / Baths | Price | Details |
|---|---|---|---|---|---|

|
#11
Frette Dr
Story City, IA 50248
|
1,040 sq. feet
|
2 baths 3 beds |
show details | |

|
#12
110th St
Story City, IA 50248
|
1,489 sq. feet
|
3 baths 3 beds |
show details | |

|
#13
Mamie Eisenhower Ave
Boone, IA 50036
|
1,299 sq. feet
|
2 baths 3 beds |
show details | |

|
#14
Morning Glory Rd
Boone, IA 50036
|
1,568 sq. feet
|
3 baths 4 beds |
show details | |

|
#15
7th St
Ames, IA 50010
|
816 sq. feet
|
1 baths 2 beds |
show details | |

|
#16
Maxwell Ave
Ames, IA 50010
|
1,588 sq. feet
|
2 baths 5 beds |
show details | |

|
#17
W 9th St
Boone, IA 50036
|
720 sq. feet
|
2 baths 1 beds |
show details | |

|
#18
Main St
Mc Callsburg, IA 50154
|
1,502 sq. feet
|
2 baths 3 beds |
show details | |

|
#19
Clark Ave
Ames, IA 50010
|
1,128 sq. feet
|
2 baths 2 beds |
show details | |

|
#20
Marston Ave
Ames, IA 50010
|
720 sq. feet
|
1 baths 2 beds |
show details |
| Photo | Address | Area | Beds / Baths | Price | Details |
|---|---|---|---|---|---|

|
#21
W Lincoln Ave
Boone, IA 50036
|
866 sq. feet
|
2 baths 3 beds |
show details | |

|
#22
Rose Rd
Madrid, IA 50156
|
1,104 sq. feet
|
1 baths 2 beds |
show details | |

|
#23
Kellogg Ave
Ames, IA 50010
|
2,219 sq. feet
|
5 baths 5 beds |
show details | |

|
#24
S 13th St Apt 13
Nevada, IA 50201
|
- sq. feet
|
- baths - beds |
show details | |

|
#25
Linwood Dr
Boone, IA 50036
|
- sq. feet
|
- baths - beds |
show details | |

|
#26
8th St
Boone, IA 50036
|
- sq. feet
|
- baths - beds |
show details | |

|
#27
E 1st St Unit 76
Huxley, IA 50124
|
- sq. feet
|
- baths - beds |
show details | |

|
#28
Regency Ct Unit 108
Ames, IA 50010
|
- sq. feet
|
- baths - beds |
show details | |

|
#29
Windrose Ln
Ames, IA 50014
|
- sq. feet
|
- baths - beds |
show details | |

|
#30
6th St
Boone, IA 50036
|
- sq. feet
|
- baths - beds |
show details |
| Photo | Address | Area | Beds / Baths | Price | Details |
|---|---|---|---|---|---|

|
#31
Stafford Ave
Ames, IA 50010
|
1,133 sq. feet
|
- baths - beds |
show details | |

|
#32
Todd Dr, Unit 103
Ames, IA 50014
|
- sq. feet
|
- baths - beds |
show details | |

|
#33
Tabor Dr
Ames, IA 50014
|
1,494 sq. feet
|
- baths - beds |
show details | |

|
#34
Steinbeck St
Ames, IA 50014
|
- sq. feet
|
- baths - beds |
show details | |

|
#35
Steinbeck St Unit 107
Ames, IA 50014
|
- sq. feet
|
- baths - beds |
show details | |

|
#36
Vermont Cir
Ames, IA 50014
|
1,961 sq. feet
|
- baths - beds |
show details | |

|
#37
Grand Ave
Ames, IA 50010
|
- sq. feet
|
- baths - beds |
show details | |

|
#38
Garfield Cir
Ames, IA 50014
|
1,228 sq. feet
|
- baths - beds |
show details | |

|
#39
Marigold Dr
Ames, IA 50014
|
1,709 sq. feet
|
- baths - beds |
show details | |

|
#40
1st St
Randall, IA 50231
|
- sq. feet
|
- baths - beds |
show details |
| Photo | Address | Area | Beds / Baths | Price | Details |
|---|---|---|---|---|---|

|
#41
Duff Ave
Ames, IA 50010
|
- sq. feet
|
- baths - beds |
show details | |

|
#42
Douglas Ave
Ames, IA 50010
|
- sq. feet
|
- baths - beds |
show details | |

|
#43
T Ave Apt 27
Nevada, IA 50201
|
- sq. feet
|
- baths - beds |
show details | |

|
#44
28th St
Ames, IA 50010
|
- sq. feet
|
- baths - beds |
show details | |

|
#45
College St
Boone, IA 50036
|
- sq. feet
|
- baths - beds |
show details | |

|
#46
W 8th St
Boone, IA 50036
|
- sq. feet
|
- baths - beds |
show details | |

|
#47
Preston Dr
Huxley, IA 50124
|
- sq. feet
|
- baths - beds |
show details | |

|
#48
S Greene St
Boone, IA 50036
|
- sq. feet
|
- baths - beds |
show details | |

|
#49
Story St
Story City, IA 50248
|
- sq. feet
|
- baths - beds |
show details | |

|
Check over 1 million property listings on Foreclosure.com!
|
browse all offers | |||

Latest news about housing in Gilbert, IA collected exclusively by city-data.com from local newspapers, TV, and radio stations

 | John Wayne Gacy & others that have ties to Iowa (2 replies) |
| Ames Schools vs. Gilbert Schools ??? (2 replies) |
| Anyone familiar with Mechanicsville area? Need help regarding an old house - built in January 1913. (1 reply) |
| Iowa photo thread (293 replies) |
| Iowa City Neighborhoods? (5 replies) |
| Moving to Iowa City vs Davenport (19 replies) |

Median year apartment built: 1966
Household type by relationship:
Households: 1,198- Male householders: 255 (20 living alone), Female householders: 243 (70 living alone)
318 spouses (311 opposite-sex spouses), 12 unmarried partners, (12 opposite-sex unmarried partners), 341 children (327 natural, 2 adopted, 12 stepchildren), 7 grandchildren, 0 brothers or sisters, 4 parents, 0 foster children, 0 other relatives, 14 non-relatives
- In group quarters: 1
Size of family households: 206 2-persons, 78 3-persons, 76 4-persons, 62 5-persons, 4 6-persons, 3 7-or-more-persons.
Size of nonfamily households: 81 1-person, 3 2-persons, 2 3-persons, 1 4-persons.
262 married couples with children.
38 single-parent households (28 men, 10 women).
96.5% of residents of Gilbert speak English at home.
0.8% of residents speak Spanish at home (89% speak English very well, 11% speak English well).
0.3% of residents speak other Indo-European language at home (100% speak English very well).
1.6% of residents speak Asian or Pacific Island language at home (67% speak English very well, 33% speak English not well).
0.5% of residents speak other language at home (100% speak English very well).
Foreign born population: 37 (3.1%)
(51.4% of them are naturalized citizens)
| Here: | 7.7 |
| State: | 6.8 |
| Here: | 4.1 |
| State: | 4.2 |

- Bedrooms in owner-occupied houses and condos in Gilbert, Iowa
- 0no bedroom
- 01 bedroom
- 142 bedrooms
- 1643 bedrooms
- 2034 bedrooms
- 485+ bedrooms

- Bedrooms in renter-occupied apartments in Gilbert, Iowa
- 1no bedroom
- 151 bedroom
- 412 bedrooms
- 203 bedrooms
- 24 bedrooms
- 05+ bedrooms

- Cars and other vehicles available in Gilbert in owner-occupied houses/condos
- 3no vehicle
- 761 vehicle
- 1872 vehicles
- 1223 vehicles
- 354 vehicles
- 55+ vehicles

- Cars and other vehicles available in Gilbert in renter-occupied apartments
- 0no vehicle
- 621 vehicle
- 172 vehicles
- 03 vehicles
- 04 vehicles
- 05+ vehicles

- Rooms in owner-occupied houses in Gilbert, Iowa
- 01 room
- 02 rooms
- 03 rooms
- 44 rooms
- 455 rooms
- 866 rooms
- 847 rooms
- 1148 rooms
- 959+ rooms

- Rooms in renter-occupied apartments in Gilbert, Iowa
- 11 room
- 32 rooms
- 123 rooms
- 384 rooms
- 125 rooms
- 76 rooms
- 27 rooms
- 08 rooms
- 39+ rooms


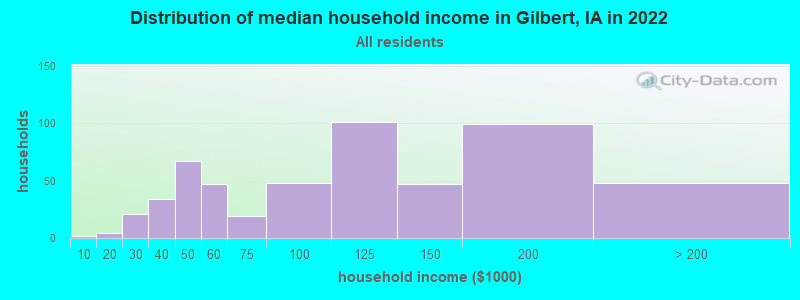
Gilbert, IA household income distribution

- 2Less than $10,000
- 4$10,000 to $19,999
- 21$20,000 to $29,999
- 34$30,000 to $39,999
- 67$40,000 to $49,999
- 47$50,000 to $59,999
- 19$60,000 to $74,999
- 48$75,000 to $99,999
- 101$100,000 to $124,999
- 47$125,000 to $149,999
- 99$150,000 to $199,999
- 48$200,000 or more
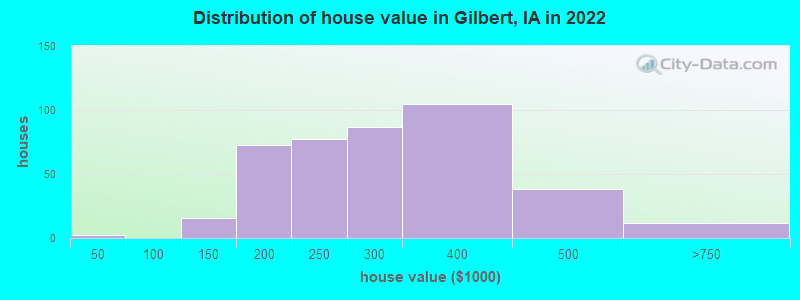
Home value of owner - occupied houses in 2022 in Gilbert, IA
-
- 2$30,000 to $34,999
- 5$100,000 to $124,999
- 9$125,000 to $149,999
- 27$150,000 to $174,999
- 45$175,000 to $199,999
- 76$200,000 to $249,999
- 87$250,000 to $299,999
- 105$300,000 to $399,999
- 37$400,000 to $499,999
- 12$500,000 to $749,999
Rent paid by renters in 2022 in Gilbert, IA
-
- 3$500 to $549
- 33$550 to $599
- 6$600 to $649
- 23$650 to $699
- 8$700 to $749
- 1$900 to $999
- 9$1,000 to $1,249
- 3$1,250 to $1,499
- 2$1,500 to $1,999
- 1No cash rent


Percentage of workers working in this county: 90.6%
Number of people working at home: 41 (5.8% of all workers)
Travel time to work (commute)
- Less than 5 minutes: 68
- 5 to 9 minutes: 50
- 10 to 14 minutes: 131
- 15 to 19 minutes: 184
- 20 to 24 minutes: 142
- 25 to 29 minutes: 20
- 30 to 34 minutes: 13
- 35 to 39 minutes: 5
- 40 to 44 minutes: 14
- 45 to 59 minutes: 4
- 60 to 89 minutes: 5
- 90 or more minutes: 14
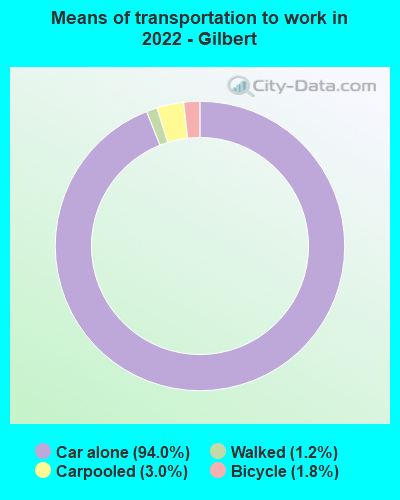
Means of transportation to work:
- Drove a car alone: 316 (81.9%)
- Carpooled: 11 (2.8%)
- Bicycle: 10 (2.6%)
- Walked: 4 (1.0%)
- Worked at home: 41 (10.6%)

- Unemployment by race in 2022
- Unemployment rate for White non-Hispanic residents
- 2.2%Males
- 1.1%Females
- Unemployment rate for Black residents
- 100.0%Males

- Year of entry for the foreign-born population in Gilbert, Iowa
- 102010 or later
- 32000 to 2009
- 41990 to 1999
- 21980 to 1989
- 01970 to 1979
- 9Before 1970

First ancestries reported:
- German: 201 (33.7%)
- Norwegian: 67 (11.2%)
- English: 57 (9.6%)
- European: 50 (8.4%)
- American: 29 (4.9%)
- Irish: 29 (4.9%)
- Polish: 24 (4.0%)
- French: 16 (2.7%)
- Czech: 15 (2.5%)
- Dutch: 13 (2.2%)
- Swiss: 9 (1.5%)
- Northern European: 7 (1.2%)
- Danish: 5 (0.8%)
- French Canadian: 3 (0.5%)
- Italian: 2 (0.3%)
- Scotch-Irish: 2 (0.3%)
- Scottish: 2 (0.3%)
- Swedish: 2 (0.3%)
- Welsh: 2 (0.3%)
- Eastern European: 1 (0.2%)
Most common places of birth for foreign-born residents (%):
| Gilbert: | 17.1% (7) |
| Iowa: | 1.4% (2,525) |
| Gilbert: | 17.1% (7) |
| Iowa: | 2.9% (5,155) |
| Gilbert: | 12.2% (5) |
| Iowa: | 1.6% (2,873) |
| Gilbert: | 7.3% (3) |
| Iowa: | 2.0% (3,595) |
| Gilbert: | 7.3% (3) |
| Iowa: | 23.3% (41,625) |
| Gilbert: | 4.9% (2) |
| Iowa: | 4.6% (8,194) |
| Gilbert: | 4.9% (2) |
| Iowa: | 0.2% (283) |
| Gilbert: | 4.9% (2) |
| Iowa: | 0.1% (178) |
| Gilbert: | 4.9% (2) |
| Iowa: | 0.2% (442) |
| Gilbert: | 4.9% (2) |
| Iowa: | 0.0% (46) |
Place of birth for U.S.-born residents:
- This state: 922
- Other state: 226
- Northeast: 3
- Midwest: 204
- South: 18
- West: 5
91.0% of Gilbert residents lived in the same house 1 years ago.
Out of people who lived in different houses, 22.8% lived in this county.
Out of people who lived in different counties, 65.7% lived in Iowa.
| Gilbert: | 91.0% |
| State average: | 87.2% |
Education attainment for males 25 years and older:
- No schooling: 0
- Nursery to 4th grade: 0
- 5th and 6th grade: 0
- 7th and 8th grade: 0
- 9th grade: 0
- 10th grade: 0
- 11th grade: 2
- 12th grade, no diploma: 0
- High school graduate (or equivalency): 60
- Less than 1 year of college: 27
- Some college more than 1 year, no degree: 77
- Associate degree: 28
- Bachelor's degree: 148
- Master's degree: 29
- Professional school degree: 8
- Doctorate degree: 8

Education attainment for females 25 years and older:
- No schooling: 0
- Nursery to 4th grade: 1
- 5th and 6th grade: 0
- 7th and 8th grade: 0
- 9th grade: 2
- 10th grade: 0
- 11th grade: 3
- 12th grade, no diploma: 0
- High school graduate (or equivalency): 67
- Less than 1 year of college: 16
- Some college more than 1 year, no degree: 55
- Associate degree: 63
- Bachelor's degree: 151
- Master's degree: 61
- Professional school degree: 0
- Doctorate degree: 0


Housing units in structures:
- One, detached: 438
- One, attached: 14
- Two: 16
- 3 or 4: 27
- 5 to 9: 5
House/condo owner moved in on average 13 years ago
Renter moved in on average 5 years ago

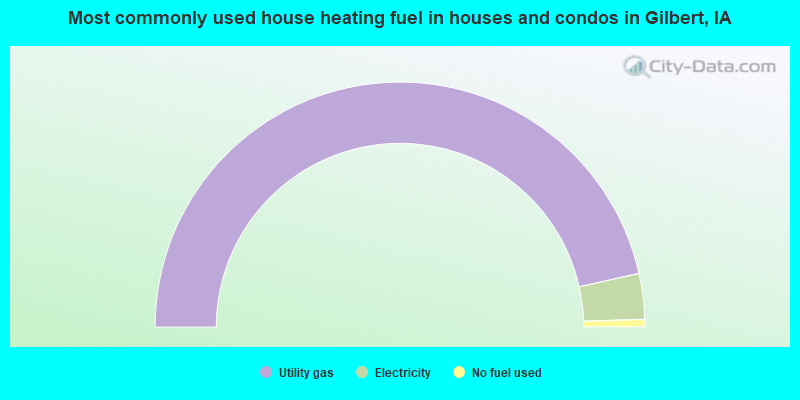
- 93.0%Utility gas
- 6.0%Electricity
- 1.0%No fuel used
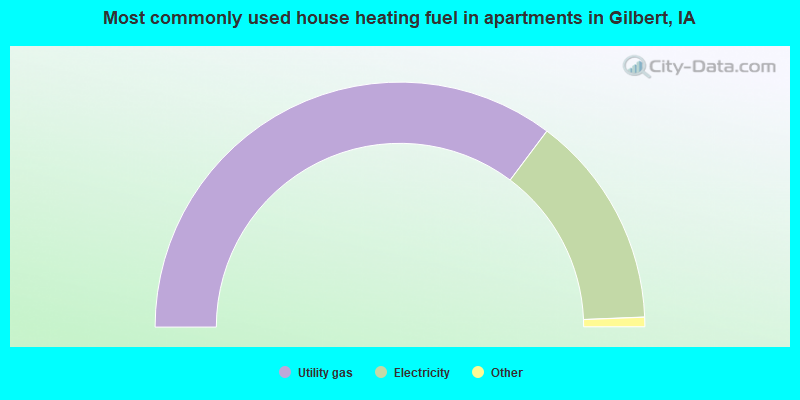
- 71.4%Utility gas
- 28.6%Electricity
Private vs. public school enrollment:
| Here: | 9.4% |
| Iowa: | 10.6% |
| Here: | 0.0% |
| Iowa: | 7.9% |
| Here: | 3.3% |
| Iowa: | 23.9% |


