Glassboro, NJ (New Jersey) Houses and Residents
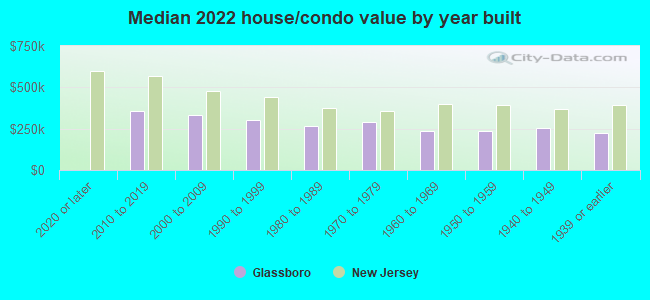
Estimated median house or condo value in 2022: $281,214 (it was $113,400 in 2000 )
Glassboro:
$281,214New Jersey:
$428,900
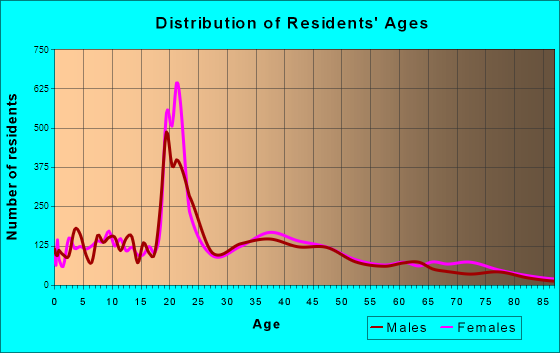
Lower value quartile - upper value quartile: $228,401 - $365,784Total population: 19,007 (Urban population: 18,850, Rural population: 218 (all nonfarm) )
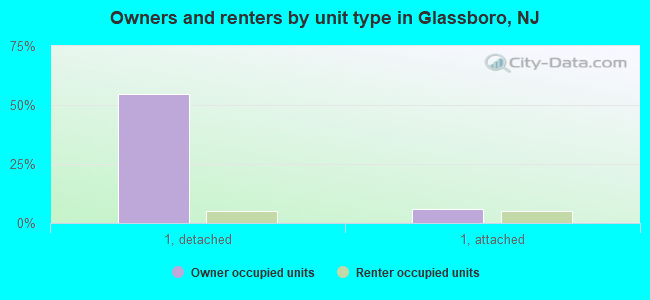
Houses: 8,349 (7,570 occupied: 4,648 owner occupied, 2,994 renter occupied )
% of renters here:
39%State:
35%
Housing density: 907 houses/condos per square mile
Median price asked for vacant for-sale houses and condos in 2022 in this county: $201,126.
Median contract rent in 2022: $1,274 (lower quartile is $880, upper quartile is $1,812)
Median rent asked for vacant for-rent units in 2022: $3,058
Median gross rent in Glassboro, NJ in 2022: $1,421
Housing units in Glassboro with a mortgage: 2,926 (225 second mortgage, 11 home equity loan, 197 both second mortgage and home equity loan )Houses without a mortgage: 39
Median household income for houses/condos with a mortgage: $113,754
Median household income for apartments without a mortgage: $65,181
Median monthly housing costs: $1,507
Data:
Median house or condo value ($)
Median house or condo value ($ change since 2000)
Median house or condo value ($) - White
Median house or condo value ($) - Black or African American
Median house or condo value ($) - Asian
Median house or condo value ($) - Hispanic or Latino
Median house or condo value ($) - American Indian and Alaska Native
Median house or condo value ($) - Multirace
Median house or condo value ($) - Other Race
Median price asked for mobile homes ($)
Household density (households per square mile)
Mean house or condo value by units in structure - 1, detached ($)
Mean house or condo value by units in structure - 1, attached ($)
Mean house or condo value by units in structure - 2 ($)
Mean house or condo value by units in structure by units in structure - 3 or 4 ($)
Mean house or condo value by units in structure - 5 or more ($)
Mean house or condo value by units in structure - Boat, RV, van, etc. ($)
Mean house or condo value by units in structure - Mobile home ($)
Median contract rent ($)
Median contract rent - Lower quartile ($)
Median contract rent - Upper quartile ($)
Median gross rent ($)
Urban houses (%)
Rural houses (%)
Houses occupied (%)
Houses occupied (% change since 2000)
Houses owner occupied (%)
Houses owner occupied (% change since 2000)
Houses renter occupied (%)
Houses renter occupied (% change since 2000)
Vacant housing units - For rent (%)
Vacant housing units - For rent (% change since 2000)
Vacant housing units - For sale only (%)
Vacant housing units - For sale only (% change since 2000)
Vacant housing units - Rented or sold, not occupied (%)
Vacant housing units - Rented or sold, not occupied (% change since 2000)
Vacant housing units - For seasonal, recreational, or occasional use (%)
Vacant housing units - For seasonal, recreational, or occasional use (% change since 2000)
Vacant housing units - For migrant workers (%)
Vacant housing units - For migrant workers (% change since 2000)
Vacant housing units - Other vacant (%)
Vacant housing units - Other vacant (% change since 2000)
Median monthly housing costs ($)
Median household income for houses/condos with a mortgage ($)
Median household income for houses/condos without a mortgage ($)
Median household income ($)
Median household income ($) - White
Median household income ($) - Black or African American
Median household income ($) - Asian
Median household income ($) - Hispanic or Latino
Median household income ($) - American Indian and Alaska Native
Median household income ($) - Multirace
Median household income ($) - Other Race
Mortgage status - with mortgage (%)
Mortgage status - with second mortgage (%)
Mortgage status - with home equity loan (%)
Mortgage status - with both second mortgage and home equity loan (%)
Mortgage status - without a mortgage (%)
Median year house/condo built
Median year apartment built
Household type by relationship - Male householder living alone (%)
Household type by relationship - Male householder not living alone (%)
Household type by relationship - Female householder living alone (%)
Household type by relationship - Female householder not living alone (%)
Household type by relationship - Opposite-Sex spouse (%)
Household type by relationship - Same-Sex spouse (%)
Household type by relationship - Opposite-Sex unmarried partner (%)
Household type by relationship - Same-Sex unmarried partner (%)
Household type by relationship - In group quarters (%)
Size of family households - 2-person household (%)
Size of family households - 3-person household (%)
Size of family households - 4-person household (%)
Size of family households - 5-person household (%)
Size of family households - 6-person household (%)
Size of family households - 7-or-more-person household (%)
Size of nonfamily households - 1-person household (%)
Size of nonfamily households - 2-person household (%)
Size of nonfamily households - 3-person household (%)
Size of nonfamily households - 4-person household (%)
Size of nonfamily households - 5-person household (%)
Size of nonfamily households - 6-person household (%)
Size of nonfamily households - 7-or-moreperson household (%)
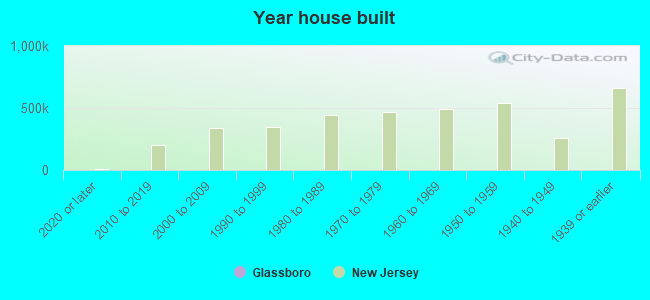
Year house built - Built 2010 or later (%)
Year house built - Built 2000 to 2009 (%)
Year house built - Built 1990 to 1999 (%)
Year house built - Built 1980 to 1989 (%)
Year house built - Built 1970 to 1979 (%)
Year house built - Built 1960 to 1969 (%)
Year house built - Built 1950 to 1959 (%)
Year house built - Built 1940 to 1949 (%)
Year house built - Built 1939 or earlier (%)
Median number of rooms in houses and condos
Median number of rooms in apartments
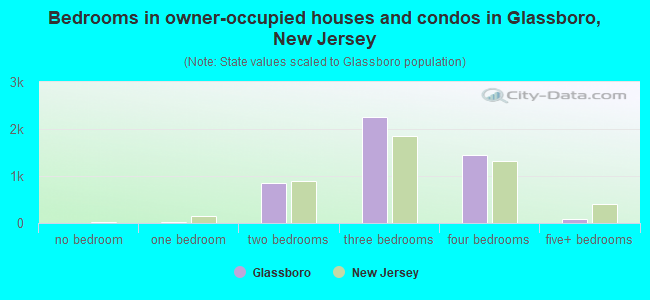
Median number of bedrooms in owner occupied houses
Mean number of bedrooms in owner occupied houses
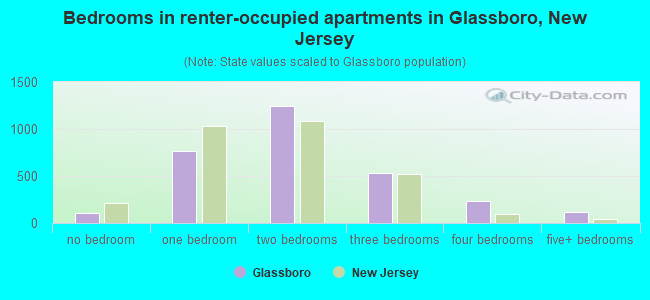
Median number of bedrooms in renter occupied houses
Mean number of bedrooms in renter occupied houses
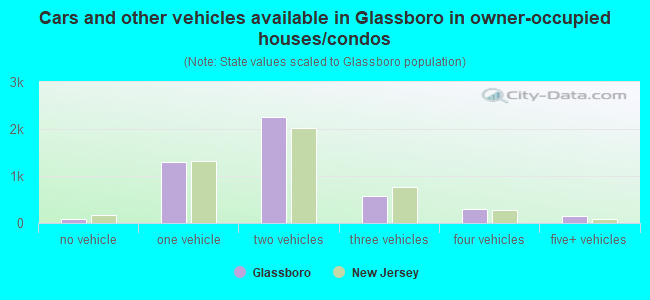
Median number of vehichles in owner occupied houses
Mean number of vehichles in owner occupied houses
Median number of vehichles in renter occupied houses
Mean number of vehichles in renter occupied houses
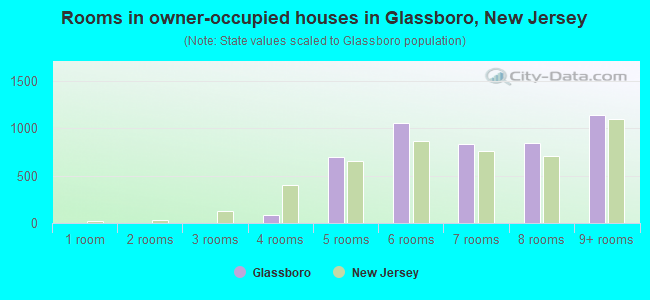
Rooms in owner-occupied houses - 1 room (%)
Rooms in owner-occupied houses - 2 rooms (%)
Rooms in owner-occupied houses - 3 rooms (%)
Rooms in owner-occupied houses - 4 rooms (%)
Rooms in owner-occupied houses - 5 rooms (%)
Rooms in owner-occupied houses - 6 rooms (%)
Rooms in owner-occupied houses - 7 rooms (%)
Rooms in owner-occupied houses - 8 rooms (%)
Rooms in owner-occupied houses - 9+ rooms (%)
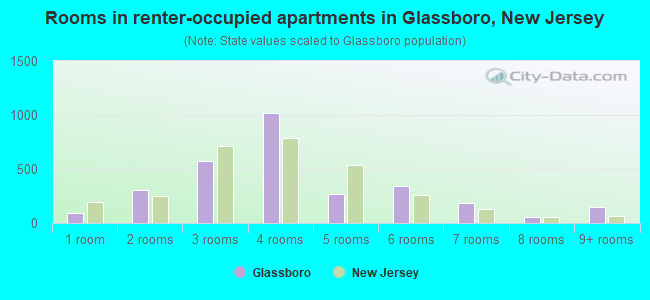
Rooms in renter-occupied houses - 1 room (%)
Rooms in renter-occupied houses - 2 rooms (%)
Rooms in renter-occupied houses - 3 rooms (%)
Rooms in renter-occupied houses - 4 rooms (%)
Rooms in renter-occupied houses - 5 rooms (%)
Rooms in renter-occupied houses - 6 rooms (%)
Rooms in renter-occupied houses - 7 rooms (%)
Rooms in renter-occupied houses - 8 rooms (%)
Rooms in renter-occupied houses - 9+ rooms (%)
Bedrooms in owner-occupied houses - no bedrooms (%)
Bedrooms in owner-occupied houses - 1 bedroom (%)
Bedrooms in owner-occupied houses - 2 bedrooms (%)
Bedrooms in owner-occupied houses - 3 bedrooms (%)
Bedrooms in owner-occupied houses - 4 bedrooms (%)
Bedrooms in owner-occupied houses - 5+ bedrooms (%)
Bedrooms in renter-occupied houses - no bedrooms (%)
Bedrooms in renter-occupied houses - 1 bedroom (%)
Bedrooms in renter-occupied houses - 2 bedrooms (%)
Bedrooms in renter-occupied houses - 3 bedrooms (%)
Bedrooms in renter-occupied houses - 4 bedrooms (%)
Bedrooms in renter-occupied houses - 5+ bedrooms (%)
Vehicles available in owner-occupied houses - no vehicle available (%)
Vehicles available in owner-occupied houses - 1 vehicle available(%)
Vehicles available in owner-occupied houses - 2 Vehicles available (%)
Vehicles available in owner-occupied houses - 3 Vehicles available (%)
Vehicles available in owner-occupied houses - 4 Vehicles available (%)
Vehicles available in owner-occupied houses - 5+ Vehicles available (%)
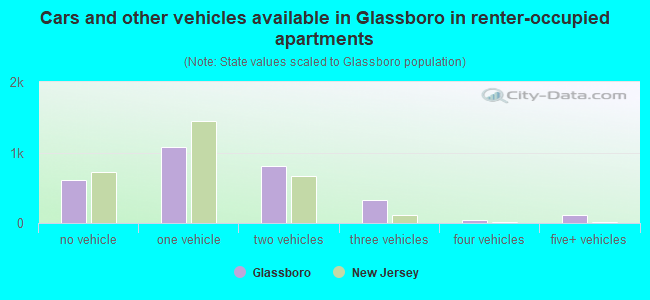
Vehicles available in renter-occupied houses - no vehicle available (%)
Vehicles available in renter-occupied houses - 1 vehicle available (%)
Vehicles available in renter-occupied houses - 2 Vehicles available (%)
Vehicles available in renter-occupied houses - 3 Vehicles available (%)
Vehicles available in renter-occupied houses - 4 Vehicles available (%)
Vehicles available in renter-occupied houses - 5+ Vehicles available (%)
Housing units in structures - 1, detached (%)
Housing units in structures - 1, attached (%)
Housing units in structures - 2 (%)
Housing units in structures - 3 or 4 (%)
Housing units in structures - 5 to 9 (%)
Housing units in structures - 10 to 19 (%)
Housing units in structures - 20 to 49 (%)
Housing units in structures - 50 or more (%)
Housing units in structures - Mobile home (%)
Housing units in structures - Boat, RV, van, etc. (%)
Housing units in structures - Owners - 1, detached (%)
Housing units in structures - Owners - 1, attached (%)
Housing units in structures - Owners - 2 (%)
Housing units in structures - Owners - 3 or 4 (%)
Housing units in structures - Owners - 5 to 9 (%)
Housing units in structures - Owners - 10 to 19 (%)
Housing units in structures - Owners - 20 to 49 (%)
Housing units in structures - Owners - 50 or more (%)
Housing units in structures - Owners - Mobile home (%)
Housing units in structures - Owners - Boat, RV, van, etc. (%)
Housing units in structures - Renters - 1, detached (%)
Housing units in structures - Renters - 1, attached (%)
Housing units in structures - Renters - 2 (%)
Housing units in structures - Renters - 3 or 4 (%)
Housing units in structures - Renters - 5 to 9 (%)
Housing units in structures - Renters - 10 to 19 (%)
Housing units in structures - Renters - 20 to 49 (%)
Housing units in structures - Renters - 50 or more (%)
Housing units in structures - Renters - Mobile home (%)
Housing units in structures - Renters - Boat, RV, van, etc. (%)
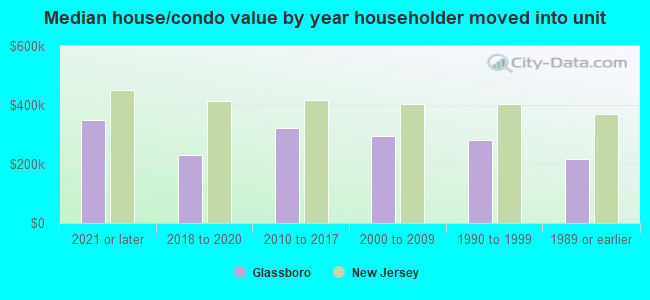
House/condo owner moved in on average (years ago)
Renter moved in on average (years ago)
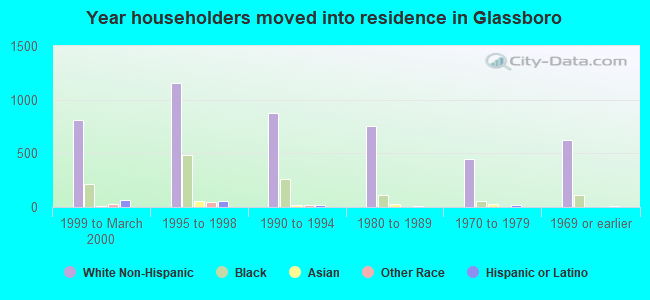
Year householder moved into unit - Moved in 1999 to March 2000 (%)
Year householder moved into unit - Moved in 1999 to March 2000 (%) - White
Year householder moved into unit - Moved in 1999 to March 2000 (%) - Black or African American
Year householder moved into unit - Moved in 1999 to March 2000 (%) - Asian
Year householder moved into unit - Moved in 1999 to March 2000 (%) - Hispanic or Latino
Year householder moved into unit - Moved in 1999 to March 2000 (%) - American Indian and Alaska Native
Year householder moved into unit - Moved in 1999 to March 2000 (%) - Multirace
Year householder moved into unit - Moved in 1999 to March 2000 (%) - Other Race
Year householder moved into unit - Moved in 1995 to 1998 (%)
Year householder moved into unit - Moved in 1995 to 1998 (%) - White
Year householder moved into unit - Moved in 1995 to 1998 (%) - Black or African American
Year householder moved into unit - Moved in 1995 to 1998 (%) - Asian
Year householder moved into unit - Moved in 1995 to 1998 (%) - Hispanic or Latino
Year householder moved into unit - Moved in 1995 to 1998 (%) - American Indian and Alaska Native
Year householder moved into unit - Moved in 1995 to 1998 (%) - Multirace
Year householder moved into unit - Moved in 1995 to 1998 (%) - Other Race
Year householder moved into unit - Moved in 1990 to 1994 (%)
Year householder moved into unit - Moved in 1990 to 1994 (%) - White
Year householder moved into unit - Moved in 1990 to 1994 (%) - Black or African American
Year householder moved into unit - Moved in 1990 to 1994 (%) - Asian
Year householder moved into unit - Moved in 1990 to 1994 (%) - Hispanic or Latino
Year householder moved into unit - Moved in 1990 to 1994 (%) - American Indian and Alaska Native
Year householder moved into unit - Moved in 1990 to 1994 (%) - Multirace
Year householder moved into unit - Moved in 1990 to 1994 (%) - Other Race
Year householder moved into unit - Moved in 1980 to 1989 (%)
Year householder moved into unit - Moved in 1980 to 1989 (%) - White
Year householder moved into unit - Moved in 1980 to 1989 (%) - Black or African American
Year householder moved into unit - Moved in 1980 to 1989 (%) - Asian
Year householder moved into unit - Moved in 1980 to 1989 (%) - Hispanic or Latino
Year householder moved into unit - Moved in 1980 to 1989 (%) - American Indian and Alaska Native
Year householder moved into unit - Moved in 1980 to 1989 (%) - Multirace
Year householder moved into unit - Moved in 1980 to 1989 (%) - Other Race
Year householder moved into unit - Moved in 1970 to 1979 (%)
Year householder moved into unit - Moved in 1970 to 1979 (%) - White
Year householder moved into unit - Moved in 1970 to 1979 (%) - Black or African American
Year householder moved into unit - Moved in 1970 to 1979 (%) - Asian
Year householder moved into unit - Moved in 1970 to 1979 (%) - Hispanic or Latino
Year householder moved into unit - Moved in 1970 to 1979 (%) - American Indian and Alaska Native
Year householder moved into unit - Moved in 1970 to 1979 (%) - Multirace
Year householder moved into unit - Moved in 1970 to 1979 (%) - Other Race
Year householder moved into unit - Moved in 1969 or earlier (%)
Year householder moved into unit - Moved in 1969 or earlier (%) - White
Year householder moved into unit - Moved in 1969 or earlier (%) - Black or African American
Year householder moved into unit - Moved in 1969 or earlier (%) - Asian
Year householder moved into unit - Moved in 1969 or earlier (%) - Hispanic or Latino
Year householder moved into unit - Moved in 1969 or earlier (%) - American Indian and Alaska Native
Year householder moved into unit - Moved in 1969 or earlier (%) - Multirace
Year householder moved into unit - Moved in 1969 or earlier (%) - Other Race
Housing units lacking complete plumbing facilities (%)
Housing units lacking complete kitchen facilities (%)
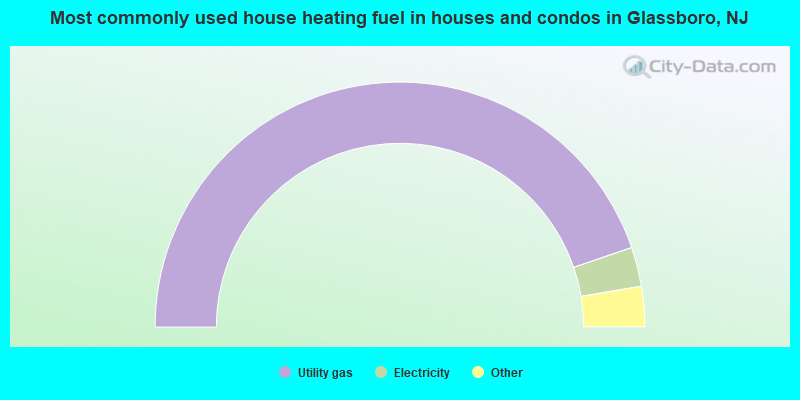
House heating fuel used in houses and condos - Utility gas (%)
House heating fuel used in houses and condos - Bottled, tank, or LP gas (%)
House heating fuel used in houses and condos - Electricity (%)
House heating fuel used in houses and condos - Fuel oil, kerosene, etc. (%)
House heating fuel used in houses and condos - Coal or coke (%)
House heating fuel used in houses and condos - Wood (%)
House heating fuel used in houses and condos - Solar energy (%)
House heating fuel used in houses and condos - Other fuel (%)
House heating fuel used in houses and condos - No fuel used (%)
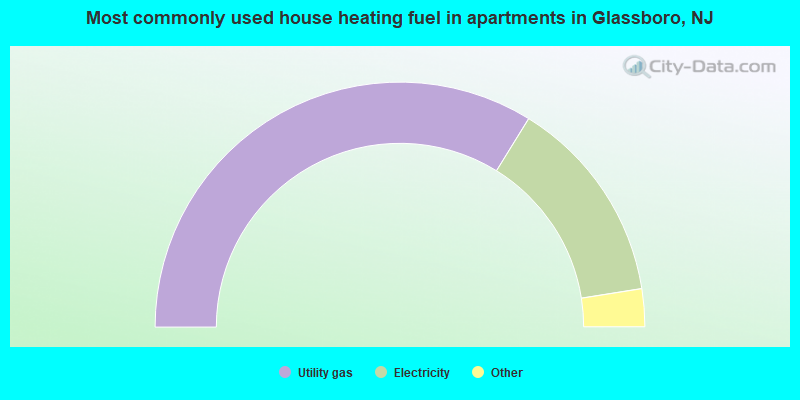
House heating fuel used in apartments - Utility gas (%)
House heating fuel used in apartments - Bottled, tank, or LP gas (%)
House heating fuel used in apartments - Electricity (%)
House heating fuel used in apartments - Fuel oil, kerosene, etc. (%)
House heating fuel used in apartments - Coal or coke (%)
House heating fuel used in apartments - Wood (%)
House heating fuel used in apartments - Solar energy (%)
House heating fuel used in apartments - Other fuel (%)
House heating fuel used in apartments - No fuel used (%)
Latest news about housing in Glassboro, NJ collected exclusively by city-data.com from local newspapers, TV, and radio stations
Median year house/condo built: 1993Median year apartment built: 1976Household type by relationship:
Households: 23,316
Male householders: 3,886 (734 living alone ), Female householders: 3,733 (1,242 living alone )3,256 spouses (3,250 opposite-sex spouses ), 397 unmarried partners , (397 opposite-sex unmarried partners ), 5,189 children (4,845 natural , 90 adopted , 253 stepchildren ), 351 grandchildren , 173 brothers or sisters , 137 parents , 0 foster children , 248 other relatives , 2,071 non-relatives In group quarters: 3,871
Size of family households: 2,152 2-persons , 1,342 3-persons , 737 4-persons , 351 5-persons , 109 6-persons , 28 7-or-more-persons .
Size of nonfamily households: 2,008 1-person , 579 2-persons , 70 3-persons , 91 4-persons , 61 5-persons , 63 6-persons , 48 7-or-more-persons .
1,837 married couples with children. single-parent households (99 men , 732 women ).
85.0% of residents of Glassboro speak English at home. of residents speak Spanish at home (62% speak English very well , 30% speak English well , 7% don't speak English at all ).of residents speak other Indo-European language at home (81% speak English very well , 14% speak English well , 4% speak English not well ).of residents speak Asian or Pacific Island language at home (46% speak English very well , 42% speak English well , 6% speak English not well , 5% don't speak English at all ).of residents speak other language at home (73% speak English very well , 27% speak English well ).
Foreign born population: 2,211 (9.5%)of them are naturalized citizens )
Median number of rooms in houses and condos:
Median number of rooms in apartments
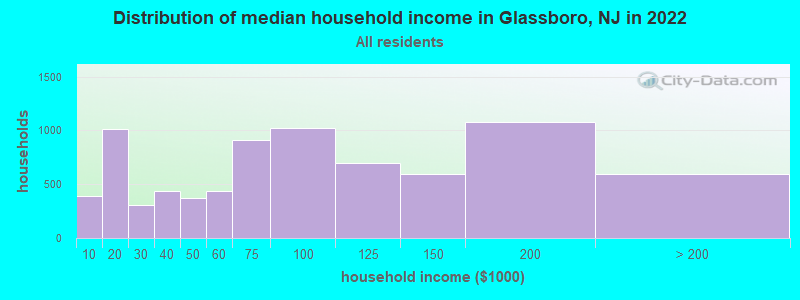
Glassboro, NJ household income distribution 392 Less than $10,0001,010 $10,000 to $19,999303 $20,000 to $29,999441 $30,000 to $39,999373 $40,000 to $49,999436 $50,000 to $59,999915 $60,000 to $74,9991,019 $75,000 to $99,999693 $100,000 to $124,999591 $125,000 to $149,9991,078 $150,000 to $199,999596 $200,000 or more
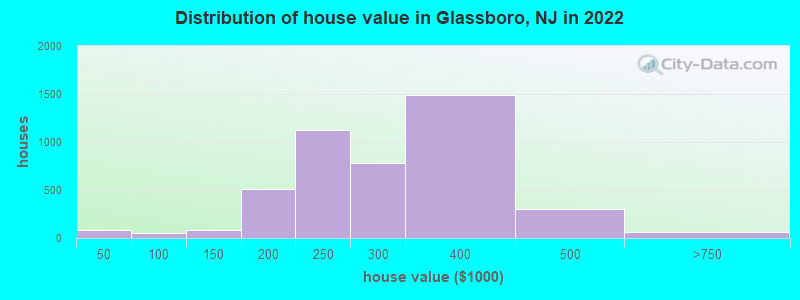
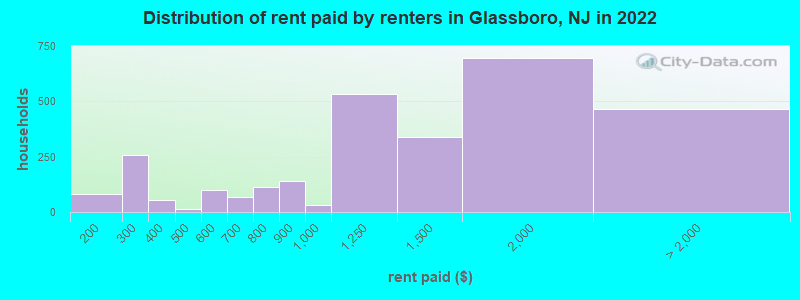
Home value of owner - occupied houses in 2022 in Glassboro, NJ 8 Less than $10,00034 $10,000 to $14,99914 $15,000 to $19,99927 $20,000 to $24,9998 $50,000 to $59,99927 $80,000 to $89,99916 $90,000 to $99,99910 $100,000 to $124,99970 $125,000 to $149,999202 $150,000 to $174,999311 $175,000 to $199,9991,123 $200,000 to $249,999779 $250,000 to $299,9991,487 $300,000 to $399,999301 $400,000 to $499,99956 $500,000 to $749,9992 $750,000 to $999,9997 $1,000,000 to $1,499,999Rent paid by renters in 2022 in Glassboro, NJ 82 $150 to $199110 $200 to $249147 $250 to $29922 $300 to $34932 $350 to $3999 $400 to $4494 $450 to $49998 $500 to $54914 $600 to $64953 $650 to $69941 $700 to $74971 $750 to $799137 $800 to $89930 $900 to $999531 $1,000 to $1,249339 $1,250 to $1,499698 $1,500 to $1,999270 $2,000 to $2,499153 $2,500 to $2,99941 No cash rent
Percentage of workers working in this county: 59.9%Number of people working at home: 1,570 (14.1% of all workers )
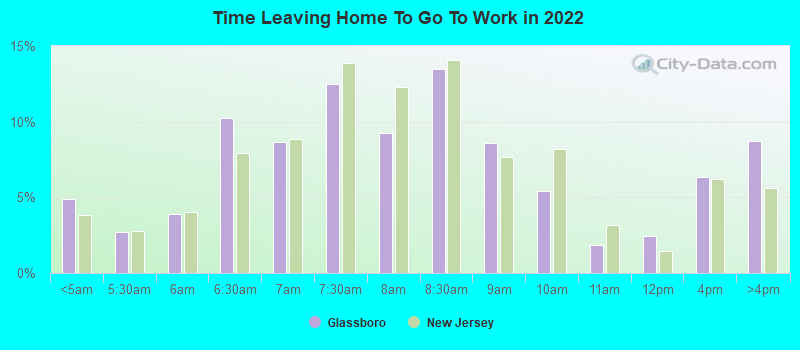
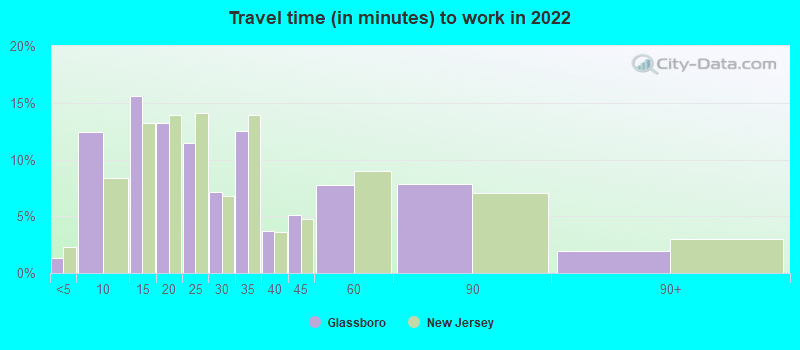
Travel time to work (commute)
Less than 5 minutes: 965 to 9 minutes: 1,13610 to 14 minutes: 1,29915 to 19 minutes: 1,36020 to 24 minutes: 88725 to 29 minutes: 46830 to 34 minutes: 1,39035 to 39 minutes: 41540 to 44 minutes: 42845 to 59 minutes: 1,00060 to 89 minutes: 77790 or more minutes: 280
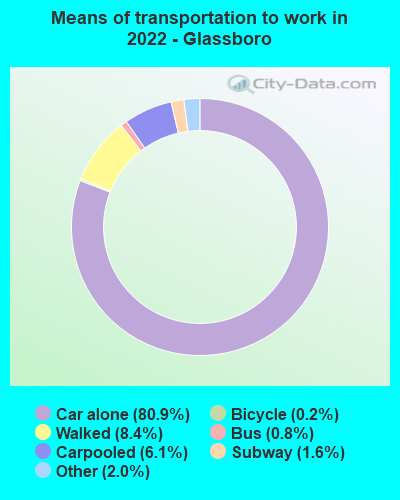
Means of transportation to work:
Drove a car alone: 7,118 (67.5%)Carpooled: 633 (6.0%)Bus : 65 (0.6%)Long-distance train or commuter rail : 264 (2.5%)Taxi: 189 (1.8%)Bicycle: 21 (0.2%)Walked: 993 (9.4%)Worked at home: 1,570 (14.9%)
Unemployment by race in 2022
Unemployment rate for White non-Hispanic residents 6.3% Males2.7% FemalesUnemployment rate for Black residents 25.6% Males5.2% FemalesUnemployment rate for Asian residents 11.6% Males3.4% FemalesUnemployment rate for other race residents 20.0% MalesUnemployment rate for two or more race residents 4.5% FemalesUnemployment rate for Hispanic or Latino residents 10.4% Males1.9% Females
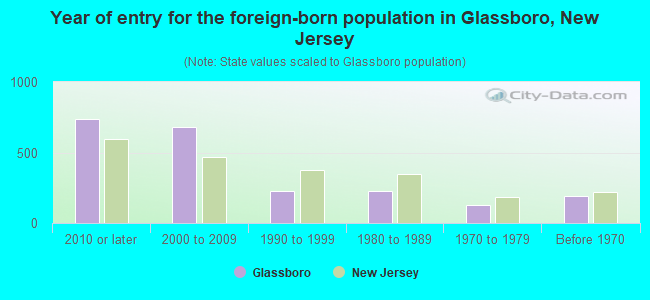
Year of entry for the foreign-born population in Glassboro, New Jersey
737 2010 or later 683 2000 to 2009 228 1990 to 1999 226 1980 to 1989 125 1970 to 1979 191 Before 1970
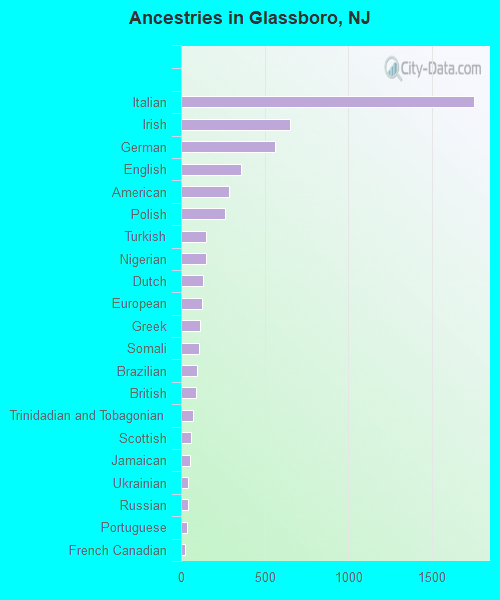
First ancestries reported:
Italian: 1,756 (16.8%)
Irish: 652 (6.2%)
German: 565 (5.4%)
English: 358 (3.4%)
American: 288 (2.8%)
Polish: 261 (2.5%)
Turkish: 150 (1.4%)
Nigerian: 150 (1.4%)
Dutch: 134 (1.3%)
European: 123 (1.2%)
Greek: 115 (1.1%)
Somali: 105 (1.0%)
Brazilian: 93 (0.9%)
British: 89 (0.9%)
Trinidadian and Tobagonian: 73 (0.7%)
Scottish: 57 (0.5%)
Jamaican: 52 (0.5%)
Ukrainian: 43 (0.4%)
Russian: 39 (0.4%)
Portuguese: 36 (0.3%)
French Canadian: 23 (0.2%)
African: 14 (0.1%)
Scotch-Irish: 12 (0.1%)
Northern European: 10 (0.10%)
Ghanaian: 10 (0.10%)
Iranian: 9 (0.09%)
Hungarian: 8 (0.08%)
Lithuanian: 8 (0.08%)
Eastern European: 5 (0.05%)
Romanian: 3 (0.03%)
Swedish: 3 (0.03%)
Armenian: 2 (0.02%)
Guyanese: 2 (0.02%) Most common places of birth for foreign-born residents (%): India Glassboro:
16.9% (347)New Jersey:
12.8% (274,609)
Turkey Glassboro:
10.4% (214)New Jersey:
0.8% (16,778)
Venezuela Glassboro:
7.2% (148)New Jersey:
0.6% (12,929)
Philippines Glassboro:
5.3% (109)New Jersey:
4.0% (85,934)
Japan Glassboro:
4.6% (95)New Jersey:
0.5% (10,042)
Brazil Glassboro:
4.5% (92)New Jersey:
2.1% (46,020)
China, excluding Hong Kong and Taiwan Glassboro:
3.9% (80)New Jersey:
3.7% (78,969)
Mexico Glassboro:
3.5% (71)New Jersey:
4.8% (102,527)
Italy Glassboro:
3.3% (67)New Jersey:
1.5% (33,198)
Colombia Glassboro:
3.1% (64)New Jersey:
4.2% (90,817)
Germany Glassboro:
2.9% (60)New Jersey:
0.8% (17,217)
Pakistan Glassboro:
2.9% (59)New Jersey:
1.3% (27,580)
Russia Glassboro:
2.7% (56)New Jersey:
0.9% (20,371)
Ecuador Glassboro:
2.5% (51)New Jersey:
4.4% (95,275)
Greece Glassboro:
2.4% (50)New Jersey:
0.3% (7,501)
Somalia Glassboro:
2.4% (49)New Jersey:
0.0% (60)
Nigeria Glassboro:
2.2% (45)New Jersey:
1.2% (25,213)
Vietnam Glassboro:
1.9% (39)New Jersey:
0.7% (15,644)
Jamaica Glassboro:
1.9% (39)New Jersey:
2.2% (47,365)
England Glassboro:
1.5% (31)New Jersey:
0.5% (10,886)
Place of birth for U.S.-born residents:
This state: 14,238Other state: 6,513Northeast: 4,590Midwest: 406South: 1,324West: 180 71.1% of Glassboro residents lived in the same house 1 years ago.
Out of people who lived in different houses, 32.3% lived in this county.
Out of people who lived in different counties, 82.5% lived in New Jersey.
Glassboro:
71.1%State average:
90.4%
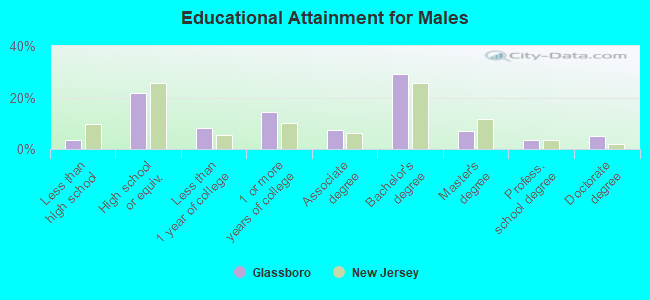
Education attainment for males 25 years and older:
No schooling: 52Nursery to 4th grade: 85th and 6th grade: 07th and 8th grade: 79th grade: 4510th grade: 5311th grade: 3212th grade, no diploma: 25High school graduate (or equivalency): 1,411Less than 1 year of college: 513Some college more than 1 year, no degree: 936Associate degree: 475Bachelor's degree: 1,885Master's degree: 448Professional school degree: 217Doctorate degree: 328
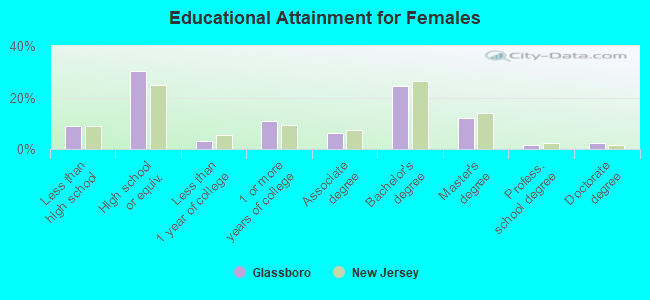
Education attainment for females 25 years and older:
No schooling: 113Nursery to 4th grade: 05th and 6th grade: 547th and 8th grade: 149th grade: 010th grade: 6011th grade: 25512th grade, no diploma: 86High school graduate (or equivalency): 1,983Less than 1 year of college: 215Some college more than 1 year, no degree: 709Associate degree: 415Bachelor's degree: 1,603Master's degree: 774Professional school degree: 103Doctorate degree: 141
Housing units in structures:
One, detached: 4,920One, attached: 779Two: 2723 or 4: 2585 to 9: 32510 to 19: 91320 to 49: 36450 or more: 503Mobile homes: 11Housing units lacking complete plumbing facilities in 2022: 0.8%Housing units lacking complete kitchen facilities in 2022: 0.8%House/condo owner moved in on average 14 years ago
Renter moved in on average 2 years ago
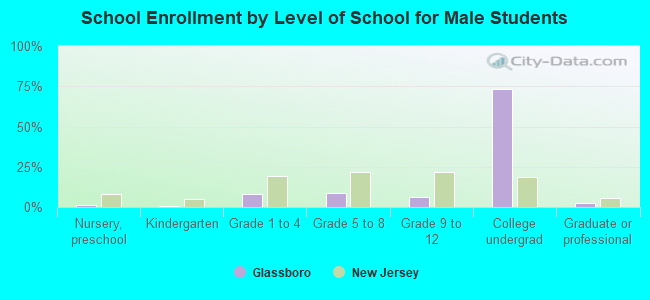
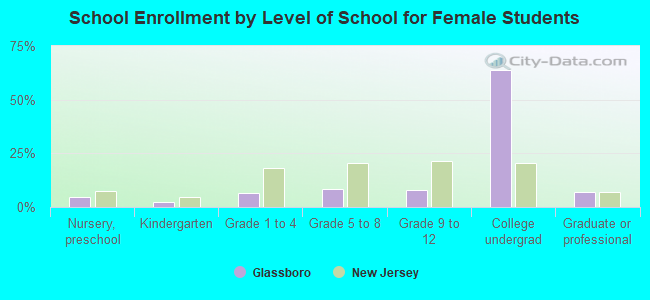
Private vs. public school enrollment:
Students in private schools in grades 1 to 8 (elementary and middle school): 75 Here:
5.4%New Jersey:
12.3%
Students in private schools in grades 9 to 12 (high school): 46 Here:
7.5%New Jersey:
13.1%
Students in private undergraduate colleges: 941 Here:
15.4%New Jersey:
33.2%