Glen Ellen, CA (California) Houses and Residents
| Glen Ellen: | $1,422,410 |
| California: | $715,900 |
Mean price in 2022:
Detached houses: $1,496,468
Here: $1,496,468 State: $988,808
Total population: 784 (Urban population: 581 (all inside urban clusters), Rural population: 353 (all nonfarm))
Houses: 625 (533 occupied: 386 owner occupied, 153 renter occupied)
| % of renters here: | 28% |
| State: | 44% |
Housing density: 298 houses/condos per square mile
Median price asked for vacant for-sale houses and condos in 2022 in this county: $439,673.
Median gross rent in Glen Ellen, CA in 2022: $-631,838,343
Housing units in Glen Ellen with a mortgage: 120 (0 second mortgage, 0 home equity loan, 0 both second mortgage and home equity loan)
Houses without a mortgage: 0
Median household income for houses/condos with a mortgage: $169,160
Median household income for apartments without a mortgage: $238,305
Median monthly housing costs: $1,406
Compare current foreclosures near Glen Ellen, CA:
| Photo | Address | Area | Beds / Baths | Price | Details |
|---|---|---|---|---|---|

|
#1
Enterprise Rd
Glen Ellen, CA 95442
|
1,220 sq. feet
|
3 baths 3 beds |
show details | |

|
#2
Trinity Rd
Glen Ellen, CA 95442
|
3,104 sq. feet
|
3 baths 3 beds |
show details | |

|
#3
Petaluma Blvd S Apt 28
Petaluma, CA 94952
|
565 sq. feet
|
1 baths 1 beds |
$359,900
|
show details |

|
#4
Mcconnell Ave
Santa Rosa, CA 95404
|
1,216 sq. feet
|
2 baths 4 beds |
show details | |

|
#5
Meadowbrook Ct
Cotati, CA 94931
|
1,733 sq. feet
|
2 baths 2 beds |
show details | |

|
#6
Berry Ln
Napa, CA 94558
|
840 sq. feet
|
1 baths 3 beds |
show details | |

|
#7
Alton Ln
Santa Rosa, CA 95403
|
1,422 sq. feet
|
2 baths 3 beds |
show details | |

|
#8
Terrace Dr
Napa, CA 94559
|
2,140 sq. feet
|
2 baths 4 beds |
show details | |

|
#9
Foothill Blvd
Calistoga, CA 94515
|
3,158 sq. feet
|
3 baths 4 beds |
show details | |

|
#10
Amanda Ct
Napa, CA 94559
|
1,823 sq. feet
|
3 baths 4 beds |
show details |
| Photo | Address | Area | Beds / Baths | Price | Details |
|---|---|---|---|---|---|

|
#11
Carson St
Santa Rosa, CA 95403
|
1,408 sq. feet
|
2 baths 3 beds |
show details | |

|
#12
Harvest Ln
Santa Rosa, CA 95401
|
1,062 sq. feet
|
2 baths 2 beds |
show details | |

|
#13
Ridgway Ave
Santa Rosa, CA 95401
|
1,603 sq. feet
|
2 baths 3 beds |
show details | |

|
#14
Montecito Ave
Santa Rosa, CA 95404
|
1,537 sq. feet
|
2 baths 2 beds |
show details | |

|
#15
Jewett Rd
Petaluma, CA 94952
|
1,600 sq. feet
|
2 baths 4 beds |
show details | |

|
#16
Corby Ave
Santa Rosa, CA 95407
|
836 sq. feet
|
1 baths 2 beds |
show details | |

|
#17
Highway 12
Sonoma, CA 95476
|
1,170 sq. feet
|
2 baths 3 beds |
show details | |

|
#18
Melvin Ave
Sonoma, CA 95476
|
1,417 sq. feet
|
2 baths 3 beds |
show details | |

|
#19
Springdale St
Sebastopol, CA 95472
|
1,864 sq. feet
|
2 baths 3 beds |
show details | |

|
#20
Debbie Dr
Santa Rosa, CA 95407
|
1,077 sq. feet
|
2 baths 3 beds |
show details |
| Photo | Address | Area | Beds / Baths | Price | Details |
|---|---|---|---|---|---|

|
#21
Hewett St
Santa Rosa, CA 95401
|
2,432 sq. feet
|
2 baths 4 beds |
show details | |

|
#22
Goldpan Cir
Santa Rosa, CA 95407
|
1,700 sq. feet
|
3 baths 3 beds |
show details | |

|
#23
Antelope Ln
Santa Rosa, CA 95407
|
1,700 sq. feet
|
3 baths 4 beds |
show details | |

|
#24
Stony Point Rd
Santa Rosa, CA 95407
|
1,844 sq. feet
|
3 baths 3 beds |
show details | |

|
#25
Wright St
Santa Rosa, CA 95404
|
1,208 sq. feet
|
1 baths 2 beds |
show details | |

|
#26
Leo Dr
Santa Rosa, CA 95407
|
1,873 sq. feet
|
2 baths 3 beds |
show details | |

|
#27
Saint Helena Rd
Santa Rosa, CA 95404
|
1,809 sq. feet
|
2 baths 3 beds |
show details | |

|
#28
Grange Rd
Santa Rosa, CA 95404
|
3,732 sq. feet
|
3 baths 3 beds |
show details | |

|
#29
Erland Rd
Santa Rosa, CA 95404
|
1,016 sq. feet
|
1 baths 2 beds |
show details | |

|
#30
Lavender Ter
Petaluma, CA 94952
|
2,618 sq. feet
|
3 baths 5 beds |
show details |
| Photo | Address | Area | Beds / Baths | Price | Details |
|---|---|---|---|---|---|

|
#31
Glen Eagle Dr
Petaluma, CA 94952
|
6,762 sq. feet
|
3 baths 3 beds |
show details | |

|
#32
Ernest Dr
Sonoma, CA 95476
|
1,466 sq. feet
|
2 baths 3 beds |
show details | |

|
#33
Ashwood Dr
Santa Rosa, CA 95407
|
1,287 sq. feet
|
1 baths 4 beds |
show details | |

|
#34
Everglade Dr
Santa Rosa, CA 95409
|
1,344 sq. feet
|
2 baths 4 beds |
show details | |

|
#35
Colgan Ave
Santa Rosa, CA 95404
|
1,340 sq. feet
|
1 baths 2 beds |
show details | |

|
#36
Parkside Dr
Santa Rosa, CA 95404
|
1,198 sq. feet
|
2 baths 3 beds |
show details | |

|
#37
Santa Barbara Dr
Santa Rosa, CA 95404
|
877 sq. feet
|
1 baths 2 beds |
show details | |

|
#38
Aston Cir
Santa Rosa, CA 95404
|
1,012 sq. feet
|
3 baths 3 beds |
show details | |

|
#39
Cypress Ave
Cotati, CA 94931
|
2,110 sq. feet
|
3 baths 3 beds |
show details | |

|
#40
Tokay St
Santa Rosa, CA 95404
|
1,569 sq. feet
|
3 baths 4 beds |
show details |
| Photo | Address | Area | Beds / Baths | Price | Details |
|---|---|---|---|---|---|

|
#41
Claremont Dr
Santa Rosa, CA 95405
|
1,268 sq. feet
|
1 baths 3 beds |
show details | |

|
#42
Midway Dr
Santa Rosa, CA 95405
|
930 sq. feet
|
1 baths 2 beds |
show details | |

|
#43
De Meo St
Santa Rosa, CA 95407
|
1,901 sq. feet
|
3 baths 4 beds |
show details | |

|
#44
Ridgway Ave
Santa Rosa, CA 95401
|
1,603 sq. feet
|
2 baths 3 beds |
show details | |

|
#45
Williams Dr
Petaluma, CA 94954
|
1,997 sq. feet
|
3 baths 5 beds |
show details | |

|
#46
Spinnaker Pl
Santa Rosa, CA 95403
|
1,307 sq. feet
|
2 baths 3 beds |
show details | |

|
#47
Santana Rd
Novato, CA 94945
|
2,078 sq. feet
|
2 baths 3 beds |
show details | |

|
#48
Wood Rd
Fulton, CA 95439
|
2,864 sq. feet
|
3 baths 3 beds |
show details | |

|
#49
El Mercado Pkwy
Santa Rosa, CA 95403
|
1,439 sq. feet
|
3 baths 3 beds |
show details | |

|
Check over 1 million property listings on Foreclosure.com!
|
browse all offers | |||


 | Where are the Modern Homes in Northern California? (3 replies) |
| Things You Should Know Before Moving to Sonoma County (49 replies) |
| Love children moving to Petaluma, are we going to hate it??! (22 replies) |
| Is Napa gay friendly? (7 replies) |
| Moving from New York to Wine Country (3 replies) |
| I used to live in Glen Ellen... (0 replies) |

Median year apartment built: 1940
Household type by relationship:
Households: 986- Male householders: 206 (116 living alone), Female householders: 313 (48 living alone)
123 spouses (94 opposite-sex spouses), 254 unmarried partners, (254 opposite-sex unmarried partners), 64 children (64 natural, 0 adopted, 0 stepchildren), 0 grandchildren, 0 brothers or sisters, 23 parents, 0 foster children, 0 other relatives, 0 non-relatives
Size of family households: 98 2-persons, 10 4-persons, 19 5-persons.
Size of nonfamily households: 181 1-person, 228 2-persons.
62 married couples with children.
0 single-parent households (0 men, 0 women).
91.2% of residents of Glen Ellen speak English at home.
7.2% of residents speak Spanish at home (100% speak English well).
Foreign born population: 70 (7.1%)
(8.6% of them are naturalized citizens)
| Here: | 5.8 |
| State: | 6.0 |
| Here: | 4.9 |
| State: | 3.9 |

- Bedrooms in owner-occupied houses and condos in Glen Ellen, California
- 0no bedroom
- 01 bedroom
- 212 bedrooms
- 3313 bedrooms
- 354 bedrooms
- 05+ bedrooms

- Bedrooms in renter-occupied apartments in Glen Ellen, California
- 60no bedroom
- 01 bedroom
- 332 bedrooms
- 623 bedrooms
- 04 bedrooms
- 05+ bedrooms

- Cars and other vehicles available in Glen Ellen in owner-occupied houses/condos
- 0no vehicle
- 2881 vehicle
- 492 vehicles
- 483 vehicles
- 04 vehicles
- 05+ vehicles

- Cars and other vehicles available in Glen Ellen in renter-occupied apartments
- 60no vehicle
- 331 vehicle
- 02 vehicles
- 03 vehicles
- 624 vehicles
- 05+ vehicles

- Rooms in owner-occupied houses in Glen Ellen, California
- 01 room
- 02 rooms
- 03 rooms
- 424 rooms
- 215 rooms
- 2886 rooms
- 127 rooms
- 238 rooms
- 09+ rooms

- Rooms in renter-occupied apartments in Glen Ellen, California
- 601 room
- 02 rooms
- 03 rooms
- 04 rooms
- 335 rooms
- 626 rooms
- 07 rooms
- 08 rooms
- 09+ rooms


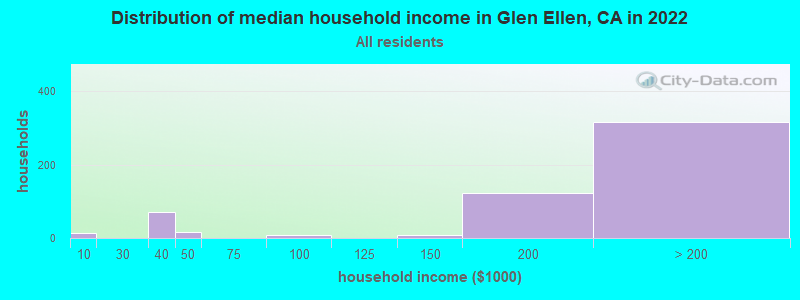
Glen Ellen, CA household income distribution

- 14Less than $10,000
- 71$30,000 to $39,999
- 16$40,000 to $49,999
- 8$75,000 to $99,999
- 7$125,000 to $149,999
- 122$150,000 to $199,999
- 316$200,000 or more
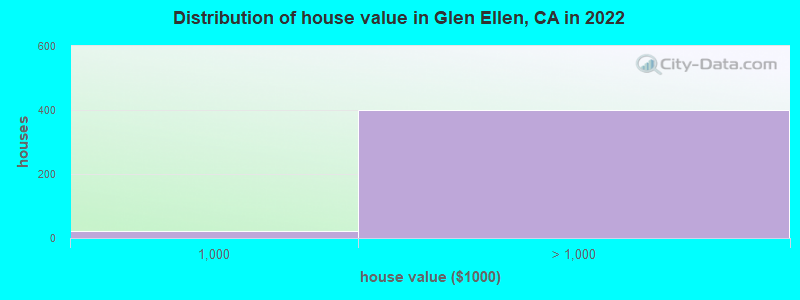
Home value of owner - occupied houses in 2022 in Glen Ellen, CA
-
- 20$750,000 to $999,999
- 325$1,000,000 to $1,499,999
- 62$1,500,000 to $1,999,999
- 11$2,000,000 or more
Rent paid by renters in 2022 in Glen Ellen, CA
-
- 94$1,500 to $1,999
- 54No cash rent


Percentage of workers working in this county: 41.2%
Number of people working at home: 0 (0.0% of all workers)
Travel time to work (commute)
- Less than 5 minutes: 0
- 5 to 9 minutes: 219
- 10 to 14 minutes: 12
- 15 to 19 minutes: 120
- 20 to 24 minutes: 19
- 25 to 29 minutes: 19
- 30 to 34 minutes: 61
- 35 to 39 minutes: 0
- 40 to 44 minutes: 0
- 45 to 59 minutes: 0
- 60 to 89 minutes: 21
- 90 or more minutes: 16
Means of transportation to work:
- Drove a car alone: 260 (67.2%)
- Carpooled: 30 (7.8%)
- Bicycle: 16 (4.1%)
- Walked: 20 (5.2%)
- Worked at home: 61 (15.8%)

- Unemployment by race in 2022
- Unemployment rate for White non-Hispanic residents
- 12.1%Males
- 2.5%Females

- Year of entry for the foreign-born population in Glen Ellen, California
- 672010 or later
- 02000 to 2009
- 01990 to 1999
- 181980 to 1989
- 01970 to 1979
- 18Before 1970

First ancestries reported:
- Eastern European: 280 (57.1%)
- French: 61 (12.5%)
- European: 26 (5.3%)
- Irish: 25 (5.1%)
- Welsh: 12 (2.4%)
- American: 11 (2.2%)
Most common places of birth for foreign-born residents (%):
| Glen Ellen: | 90.0% (63) |
| California: | 37.2% (3,881,193) |
| Glen Ellen: | 7.1% (5) |
| California: | 0.7% (73,304) |
Place of birth for U.S.-born residents:
- This state: 216
- Other state: 726
- Northeast: 585
- Midwest: 55
- South: 73
- West: 0
101.6% of Glen Ellen residents lived in the same house 1 years ago.
| Glen Ellen: | 101.6% |
| State average: | 88.9% |
Education attainment for males 25 years and older:
- No schooling: 0
- Nursery to 4th grade: 0
- 5th and 6th grade: 0
- 7th and 8th grade: 0
- 9th grade: 0
- 10th grade: 0
- 11th grade: 0
- 12th grade, no diploma: 0
- High school graduate (or equivalency): 134
- Less than 1 year of college: 5
- Some college more than 1 year, no degree: 0
- Associate degree: 0
- Bachelor's degree: 315
- Master's degree: 0
- Professional school degree: 20
- Doctorate degree: 45

Education attainment for females 25 years and older:
- No schooling: 0
- Nursery to 4th grade: 0
- 5th and 6th grade: 0
- 7th and 8th grade: 0
- 9th grade: 0
- 10th grade: 0
- 11th grade: 0
- 12th grade, no diploma: 0
- High school graduate (or equivalency): 0
- Less than 1 year of college: 6
- Some college more than 1 year, no degree: 40
- Associate degree: 0
- Bachelor's degree: 35
- Master's degree: 299
- Professional school degree: 6
- Doctorate degree: 24


Housing units in structures:
- One, detached: 533
- Two: 91
House/condo owner moved in on average 6 years ago
Renter moved in on average 3 years ago

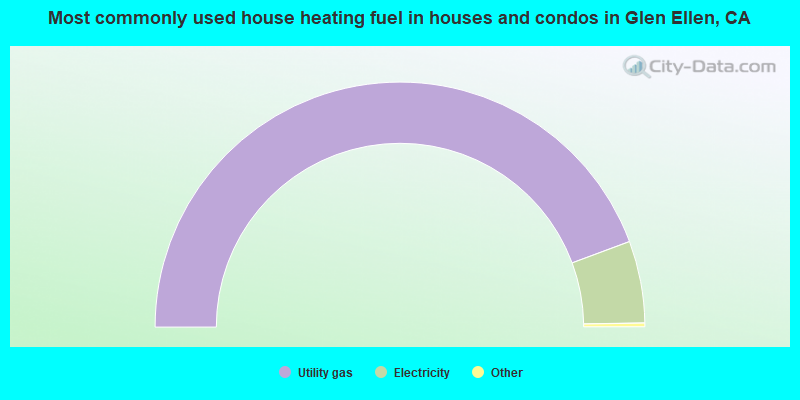
- 89.1%Utility gas
- 10.9%Electricity
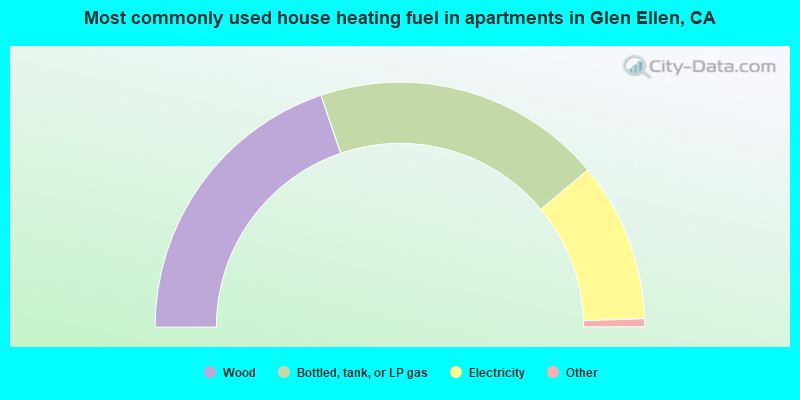
- 40.0%Wood
- 38.7%Bottled, tank, or LP gas
- 21.3%Electricity
Private vs. public school enrollment:
| Here: | 0.0% |
| California: | 10.5% |
| Here: | 100.0% |
| California: | 8.5% |


