Jump to a detailed profile or search site with Google Custom Search

Glendale, CA (California) Houses and Residents

Estimated median house or condo value in 2022: $1,036,800 (it was $290,400 in 2000)
Glendale:

$1,036,800
California:

$715,900
Lower value quartile - upper value quartile: $713,600 - $1,389,100

Mean price in 2022:

Detached houses: $1,324,567
Here:

$1,324,567
State:

$988,808

Townhouses or other attached units: $797,501
Here:

$797,501
State:

$838,546

In 2-unit structures: $725,409
Here:

$725,409
State:

$1,138,100

In 3-to-4-unit structures: $678,213
Here:

$678,213
State:

$824,253

In 5-or-more-unit structures: $608,891
Here:

$608,891
State:

$730,996

Mobile homes: $917,250
Here:

$917,250
State:

$184,506

Total population: 200,167 (Urban population: 192,901, Rural population: 2,146 (all nonfarm))

Houses: 78,332 (74,010 occupied: 24,629 owner occupied, 49,381 renter occupied)

% of renters here:

67%
State:

44%

Housing density: 2,556 houses/condos per square mile

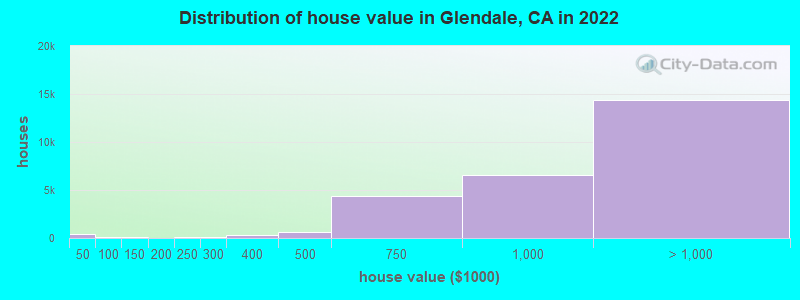
Median price asked for vacant for-sale houses and condos in 2022: $967,334.

Median contract rent in 2022: $1,841 (lower quartile is $1,486, upper quartile is over $2,000)


Median rent asked for vacant for-rent units in 2022: $2,586


Median gross rent in Glendale, CA in 2022: over $2,000

Housing units in Glendale with a mortgage: 17,977 (2,028 second mortgage, 64 home equity loan, 1,602 both second mortgage and home equity loan)
Houses without a mortgage: 117

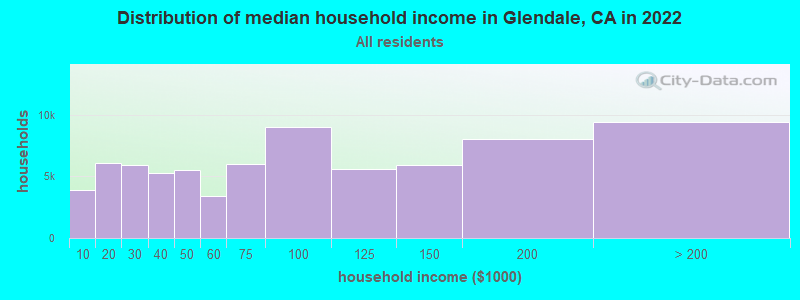
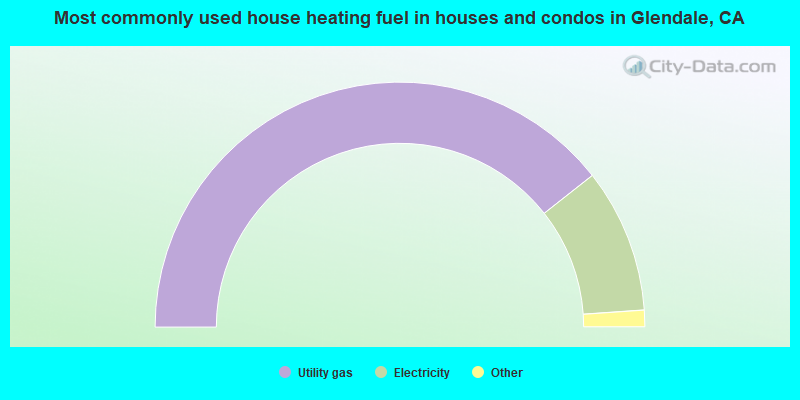
Median household income for houses/condos with a mortgage: $136,021

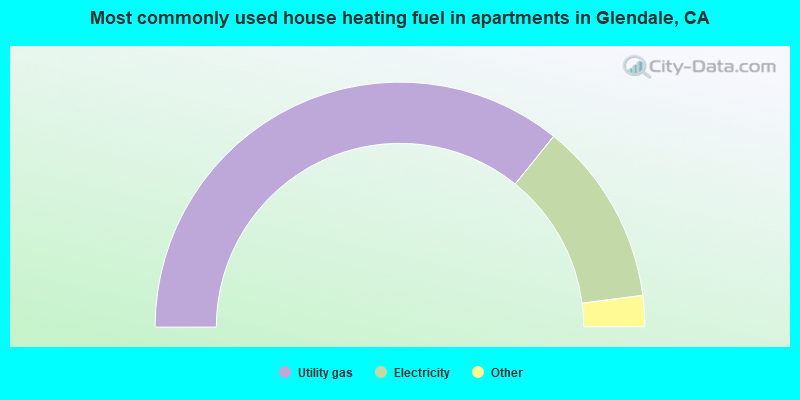
Median household income for apartments without a mortgage: $112,536

Median monthly housing costs: $2,125

Compare current foreclosures in Glendale, CA:

Check out more offers in Glendale, CA.
Powered by Foreclosure.com

Settings
X
Data:
Loading data...
Based on 2000-2022 data
Loading data...

123
Hide US histogram

Latest news about housing in Glendale, CA collected exclusively by city-data.com from local newspapers, TV, and radio stations

Glendale, California Age and Sex of Residents
Median year house/condo built: 1955

Median year apartment built: 1968

Household type by relationship:

Households: 189,228
  • Male householders: 36,820 (9,069 living alone), Female householders: 37,190 (12,982 living alone)
  • 32,771 spouses (32,423 opposite-sex spouses), 5,187 unmarried partners, (4,838 opposite-sex unmarried partners), 53,183 children (52,214 natural, 220 adopted, 749 stepchildren), 2,408 grandchildren, 2,636 brothers or sisters, 9,392 parents, 0 foster children, 3,616 other relatives, 3,578 non-relatives
  • In group quarters: 2,447

Size of family households: 16,926 2-persons, 11,735 3-persons, 11,595 4-persons, 4,779 5-persons, 933 6-persons, 303 7-or-more-persons.

Size of nonfamily households: 22,051 1-person, 5,330 2-persons, 358 3-persons.

25,069 married couples with children.
7,120 single-parent households (1,324 men, 5,796 women).

34.6% of residents of Glendale speak English at home.
13.6% of residents speak Spanish at home (64% speak English very well, 24% speak English well, 10% speak English not well, 1% don't speak English at all).
40.4% of residents speak other Indo-European language at home (50% speak English very well, 27% speak English well, 16% speak English not well, 7% don't speak English at all).
9.6% of residents speak Asian or Pacific Island language at home (61% speak English very well, 28% speak English well, 9% speak English not well, 2% don't speak English at all).
1.8% of residents speak other language at home (56% speak English very well, 17% speak English well, 21% speak English not well, 6% don't speak English at all).

Foreign born population: 92,498 (48.9%)
(73.6% of them are naturalized citizens)

Median number of rooms in houses and condos:
Here:

5.8
State:

6.0

Median number of rooms in apartments
Here:

3.9
State:

3.9

Owner-occupied Renter-occupied
Bedrooms in owner-occupied houses and condos in Glendale, California
  • Bedrooms in owner-occupied houses and condos in Glendale, California
  • 230no bedroom
  • 1,3241 bedroom
  • 7,2682 bedrooms
  • 11,5923 bedrooms
  • 3,8974 bedrooms
  • 3185+ bedrooms
Bedrooms in renter-occupied apartments in Glendale, California
  • Bedrooms in renter-occupied apartments in Glendale, California
  • 4,543no bedroom
  • 18,7491 bedroom
  • 21,5282 bedrooms
  • 4,2663 bedrooms
  • 1724 bedrooms
  • 1235+ bedrooms
Owner-occupied Renter-occupied
Cars and other vehicles available in Glendale in owner-occupied houses/condos
  • Cars and other vehicles available in Glendale in owner-occupied houses/condos
  • 1,634no vehicle
  • 5,8661 vehicle
  • 10,7572 vehicles
  • 4,6353 vehicles
  • 1,2124 vehicles
  • 5255+ vehicles
Cars and other vehicles available in Glendale in renter-occupied apartments
  • Cars and other vehicles available in Glendale in renter-occupied apartments
  • 7,991no vehicle
  • 22,6071 vehicle
  • 13,4882 vehicles
  • 3,5673 vehicles
  • 1,5714 vehicles
  • 1575+ vehicles
Owner-occupied Renter-occupied
Rooms in owner-occupied houses in Glendale, California
  • Rooms in owner-occupied houses in Glendale, California
  • 1581 room
  • 5692 rooms
  • 1,7523 rooms
  • 3,5534 rooms
  • 4,3845 rooms
  • 6,3516 rooms
  • 3,3297 rooms
  • 2,2118 rooms
  • 2,3229+ rooms
Rooms in renter-occupied apartments in Glendale, California
  • Rooms in renter-occupied apartments in Glendale, California
  • 4,0671 room
  • 3,8422 rooms
  • 9,8473 rooms
  • 19,4174 rooms
  • 6,7255 rooms
  • 4,6876 rooms
  • 5107 rooms
  • 1138 rooms
  • 1739+ rooms
Year house built
Median 2022 house/condo value by year built
Median house/condo value by year householder moved into unit
Breakdown of mean house values by ages of householders
Owners and renters by unit type in Glendale, CA
  • Glendale, CA household income distribution

  • Distribution of median household income in Glendale, CA in 2022
  • 3,879Less than $10,000
  • 6,059$10,000 to $19,999
  • 5,955$20,000 to $29,999
  • 5,306$30,000 to $39,999
  • 5,522$40,000 to $49,999
  • 3,406$50,000 to $59,999
  • 5,978$60,000 to $74,999
  • 8,995$75,000 to $99,999
  • 5,590$100,000 to $124,999
  • 5,902$125,000 to $149,999
  • 8,008$150,000 to $199,999
  • 9,410$200,000 or more
  • Home value of owner - occupied houses in 2022 in Glendale, CA

  • Distribution of house value in Glendale, CA in 2022
  • 325Less than $10,000
  • 17$10,000 to $14,999
  • 5$15,000 to $19,999
  • 10$30,000 to $34,999
  • 6$40,000 to $49,999
  • 15$50,000 to $59,999
  • 36$60,000 to $69,999
  • 16$80,000 to $89,999
  • 28$90,000 to $99,999
  • 61$100,000 to $124,999
  • 8$150,000 to $174,999
  • 2$175,000 to $199,999
  • 68$200,000 to $249,999
  • 66$250,000 to $299,999
  • 363$300,000 to $399,999
  • 668$400,000 to $499,999
  • 4,325$500,000 to $749,999
  • 6,565$750,000 to $999,999
  • 9,566$1,000,000 to $1,499,999
  • 3,248$1,500,000 to $1,999,999
  • 1,588$2,000,000 or more
  • Rent paid by renters in 2022 in Glendale, CA

  • Distribution of rent paid by renters in Glendale, CA in 2022
  • 28Less than $100
  • 41$100 to $149
  • 233$150 to $199
  • 585$200 to $249
  • 185$250 to $299
  • 151$300 to $349
  • 235$350 to $399
  • 171$400 to $449
  • 167$450 to $499
  • 250$500 to $549
  • 259$550 to $599
  • 218$600 to $649
  • 120$650 to $699
  • 151$700 to $749
  • 209$750 to $799
  • 667$800 to $899
  • 627$900 to $999
  • 3,803$1,000 to $1,249
  • 4,823$1,250 to $1,499
  • 16,507$1,500 to $1,999
  • 10,500$2,000 to $2,499
  • 4,336$2,500 to $2,999
  • 1,893$3,000 to $3,499
  • 1,831$3,500 or more
  • 1,580No cash rent
Time Leaving Home To Go To Work in 2022

Percentage of workers working in this county: 98.3%
Number of people working at home: 19,094 (21.6% of all workers)

Travel time (in minutes) to work in 2022

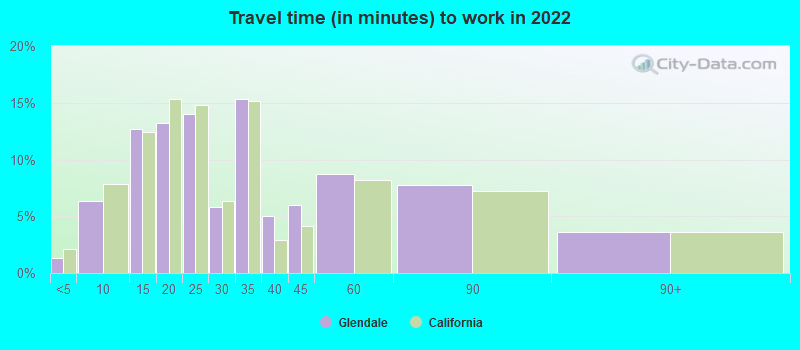
Travel time to work (commute)

  • Less than 5 minutes: 979
  • 5 to 9 minutes: 4,787
  • 10 to 14 minutes: 8,144
  • 15 to 19 minutes: 11,188
  • 20 to 24 minutes: 10,735
  • 25 to 29 minutes: 3,074
  • 30 to 34 minutes: 14,161
  • 35 to 39 minutes: 2,197
  • 40 to 44 minutes: 4,465
  • 45 to 59 minutes: 4,975
  • 60 to 89 minutes: 3,503
  • 90 or more minutes: 1,199
Means of transportation to work in 2022 - Glendale

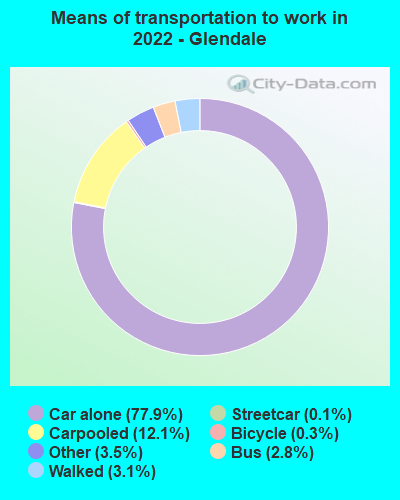
Means of transportation to work:

  • Drove a car alone: 58,473 (62.1%)
  • Carpooled: 9,075 (9.6%)
  • Bus: 2,096 (2.2%)
  • Subway or elevated rail: 103 (0.1%)
  • Long-distance train or commuter rail: 53 (0.1%)
  • Ferryboat: 53 (0.1%)
  • Taxi: 2,661 (2.8%)
  • Bicycle: 211 (0.2%)
  • Walked: 2,308 (2.5%)
  • Worked at home: 19,094 (20.3%)
Class of Workers in 2022
  • Unemployment by race in 2022
  • Unemployment rate for White non-Hispanic residents
  • 8.3%Males
  • 7.3%Females
  • Unemployment rate for Black residents
  • 4.1%Males
  • 13.3%Females
  • Unemployment rate for American Indian and Alaska Native residents
  • 2.9%Females
  • Unemployment rate for Asian residents
  • 0.7%Males
  • 2.6%Females
  • Unemployment rate for other race residents
  • 3.2%Males
  • 9.0%Females
  • Unemployment rate for two or more race residents
  • 12.1%Males
  • 9.7%Females
  • Unemployment rate for Hispanic or Latino residents
  • 2.6%Males
  • 8.8%Females
Year of entry for the foreign-born population in Glendale, California
  • Year of entry for the foreign-born population in Glendale, California
  • 26,1532010 or later
  • 20,4702000 to 2009
  • 17,3521990 to 1999
  • 37,8391980 to 1989
  • 16,2351970 to 1979
  • 8,175Before 1970
Ancestries in Glendale, CA

First ancestries reported:

  • Armenian: 56,958 (43.4%)
  • Iranian: 1,787 (1.4%)
  • Russian: 1,575 (1.2%)
  • German: 1,448 (1.1%)
  • Irish: 1,347 (1.0%)
  • English: 1,202 (0.9%)
  • Italian: 1,195 (0.9%)
  • American: 906 (0.7%)
  • European: 773 (0.6%)
  • Lebanese: 527 (0.4%)
  • Egyptian: 495 (0.4%)
  • Syrian: 435 (0.3%)
  • Polish: 314 (0.2%)
  • Greek: 283 (0.2%)
  • Eastern European: 266 (0.2%)
  • Arab: 241 (0.2%)
  • Brazilian: 231 (0.2%)
  • Ukrainian: 196 (0.1%)
  • British: 185 (0.1%)
  • Afghan: 182 (0.1%)
  • Norwegian: 172 (0.1%)
  • Swedish: 148 (0.1%)
  • Hungarian: 147 (0.1%)
  • African: 146 (0.1%)
  • French: 145 (0.1%)
  • Scottish: 143 (0.1%)
  • Iraqi: 140 (0.1%)
  • Croatian: 126 (0.10%)
  • Romanian: 126 (0.10%)
  • Danish: 126 (0.10%)
  • Canadian: 116 (0.09%)
  • Slovak: 111 (0.08%)
  • Portuguese: 102 (0.08%)
  • Assyrian: 97 (0.07%)
  • Scotch-Irish: 96 (0.07%)
  • Welsh: 90 (0.07%)
  • Scandinavian: 86 (0.07%)
  • Lithuanian: 80 (0.06%)
  • Palestinian: 79 (0.06%)
  • Jamaican: 74 (0.06%)
  • Australian: 72 (0.05%)
  • Ethiopian: 71 (0.05%)
  • Czech: 70 (0.05%)
  • Finnish: 67 (0.05%)
  • Turkish: 67 (0.05%)
  • Belizean: 63 (0.05%)
  • Dutch: 61 (0.05%)
  • Jordanian: 57 (0.04%)
  • Moroccan: 54 (0.04%)
  • Northern European: 49 (0.04%)
  • Bulgarian: 37 (0.03%)
  • Nigerian: 37 (0.03%)
  • Basque: 36 (0.03%)
  • French Canadian: 36 (0.03%)
  • Trinidadian and Tobagonian: 27 (0.02%)
  • Swiss: 24 (0.02%)
  • South African: 22 (0.02%)
  • Estonian: 20 (0.02%)
  • Slovene: 17 (0.01%)
  • Austrian: 16 (0.01%)
  • Guyanese: 16 (0.01%)
  • Haitian: 15 (0.01%)
  • West Indian: 13 (0.01%)
  • Czechoslovakian: 11 (0.01%)
  • Israeli: 10 (0.01%)

Most common places of birth for foreign-born residents (%):

Iran
Glendale:

27.3% (26,360)
California:

2.0% (206,004)

Armenia
Glendale:

23.8% (23,049)
California:

0.8% (78,847)

Philippines
Glendale:

7.3% (7,089)
California:

7.8% (818,297)

Mexico
Glendale:

6.8% (6,526)
California:

37.2% (3,881,193)

Korea
Glendale:

4.6% (4,464)
California:

3.0% (315,248)

Iraq
Glendale:

3.6% (3,447)
California:

0.4% (40,941)

El Salvador
Glendale:

2.6% (2,525)
California:

4.2% (440,287)

Lebanon
Glendale:

2.2% (2,164)
California:

0.3% (31,757)

Russia
Glendale:

1.9% (1,829)
California:

0.7% (71,932)

Syria
Glendale:

1.6% (1,584)
California:

0.3% (30,949)

Azerbaijan
Glendale:

1.6% (1,554)
California:

0.1% (6,119)

Place of birth for U.S.-born residents:

  • This state: 71,898
  • Other state: 21,937
  • Northeast: 5,202
  • Midwest: 6,789
  • South: 6,310
  • West: 3,636

88.0% of Glendale residents lived in the same house 1 years ago.
   Out of people who lived in different houses, 41.7% lived in this county.
   Out of people who lived in different counties, 40.7% lived in California.


Glendale:

88.0%
State average:

88.9%

Education attainment for males 25 years and older:

  • No schooling: 2,076
  • Nursery to 4th grade: 312
  • 5th and 6th grade: 2,346
  • 7th and 8th grade: 1,183
  • 9th grade: 290
  • 10th grade: 469
  • 11th grade: 663
  • 12th grade, no diploma: 792
  • High school graduate (or equivalency): 15,772
  • Less than 1 year of college: 2,598
  • Some college more than 1 year, no degree: 8,013
  • Associate degree: 5,059
  • Bachelor's degree: 16,594
  • Master's degree: 5,952
  • Professional school degree: 1,748
  • Doctorate degree: 1,631
Educational Attainment for Males

Education attainment for females 25 years and older:

  • No schooling: 2,493
  • Nursery to 4th grade: 421
  • 5th and 6th grade: 1,702
  • 7th and 8th grade: 927
  • 9th grade: 1,000
  • 10th grade: 494
  • 11th grade: 177
  • 12th grade, no diploma: 725
  • High school graduate (or equivalency): 14,681
  • Less than 1 year of college: 3,331
  • Some college more than 1 year, no degree: 7,783
  • Associate degree: 6,331
  • Bachelor's degree: 22,696
  • Master's degree: 9,534
  • Professional school degree: 2,207
  • Doctorate degree: 938
Educational Attainment for Females
Glendale marital status for males
Glendale marital status for females

Housing units in structures:

  • One, detached: 24,847
  • One, attached: 3,953
  • Two: 2,484
  • 3 or 4: 5,535
  • 5 to 9: 9,152
  • 10 to 19: 10,849
  • 20 to 49: 11,986
  • 50 or more: 9,449
  • Mobile homes: 77
Housing units lacking complete plumbing facilities in 2022: 0.5%

Housing units lacking complete kitchen facilities in 2022: 4.7%

House/condo owner moved in on average 15 years ago

Renter moved in on average 4 years ago

Year householders moved into residence in Glendale
Houses and condos Apartments
Most commonly used house heating fuel in houses and condos in Glendale, CA
  • 78.7%Utility gas
  • 19.0%Electricity
  • 1.0%Bottled, tank, or LP gas
  • 0.7%No fuel used
  • 0.3%Solar energy
  • 0.2%Wood
Most commonly used house heating fuel in apartments in Glendale, CA
  • 71.6%Utility gas
  • 24.3%Electricity
  • 2.3%No fuel used
  • 1.4%Bottled, tank, or LP gas
  • 0.2%Solar energy
  • 0.1%Fuel oil, kerosene, etc.

Private vs. public school enrollment:

Students in private schools in grades 1 to 8 (elementary and middle school): 1,532
Here:

10.3%
California:

10.5%

Students in private schools in grades 9 to 12 (high school): 668
Here:

7.0%
California:

8.5%

Students in private undergraduate colleges: 1,571
Here:

16.5%
California:

15.9%
School Enrollment by Level of School for Male Students
School Enrollment by Level of School for Female Students
Age and Sex of Sensory-Disabled Noninstitutionalized Residents
Age and Sex of Physically-Disabled Noninstitutionalized Residents
Age and Sex of Mentally-Disabled Noninstitutionalized Residents
Age and Sex of Self-Care Disabled Noninstitutionalized Residents
Age and Sex of Go-Outside-Home Disabled Noninstitutionalized Residents
Age and Sex of Noninstitutionalized Residents with Employment Disability