Jump to a detailed profile or search site with Google Custom Search

Glendora, CA (California) Houses and Residents

Estimated median house or condo value in 2022: $824,524 (it was $218,700 in 2000)
Glendora:

$824,524
California:

$715,900
Lower value quartile - upper value quartile: $627,580 - $1,046,693

Mean price in 2022:

Detached houses: $1,086,945
Here:

$1,086,945
State:

$988,808

Townhouses or other attached units: $726,426
Here:

$726,426
State:

$838,546

In 2-unit structures: $455,928
Here:

$455,928
State:

$1,138,100

In 3-to-4-unit structures: $576,655
Here:

$576,655
State:

$824,253

In 5-or-more-unit structures: $737,161
Here:

$737,161
State:

$730,996

Mobile homes: $66,753
Here:

$66,753
State:

$184,506

Total population: 51,442 (Urban population: 49,719, Rural population: 0)

Houses: 17,607 (16,948 occupied: 11,543 owner occupied, 5,469 renter occupied)

% of renters here:

32%
State:

44%

Housing density: 920 houses/condos per square mile

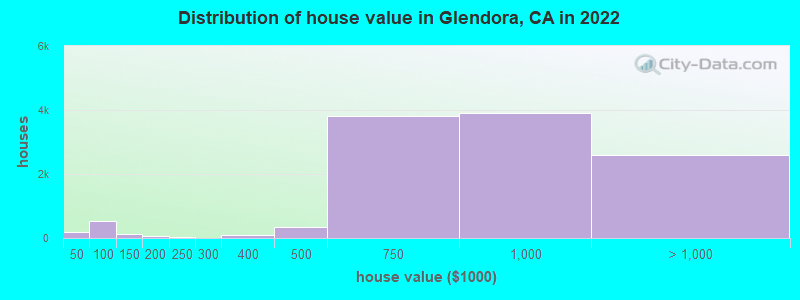
Median price asked for vacant for-sale houses and condos in 2022: $946,809.

Median contract rent in 2022: $1,941 (lower quartile is $1,476, upper quartile is over $2,000)


Median rent asked for vacant for-rent units in 2022: $2,346


Median gross rent in Glendora, CA in 2022: over $2,000

Housing units in Glendora with a mortgage: 7,430 (844 second mortgage, 79 home equity loan, 603 both second mortgage and home equity loan)
Houses without a mortgage: 85

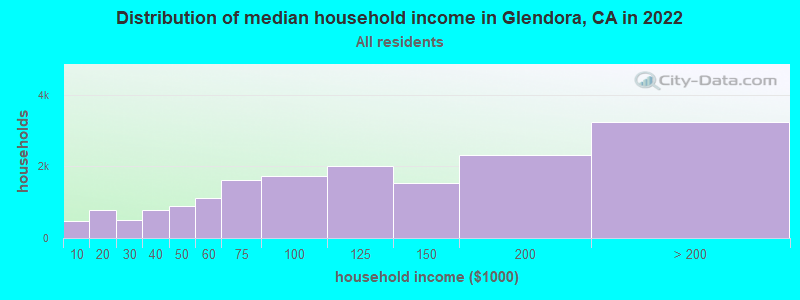
Median household income for houses/condos with a mortgage: $146,063

Median household income for apartments without a mortgage: $103,250

Median monthly housing costs: $2,146

Compare current foreclosures in Glendora, CA:

Check out more offers in Glendora, CA.
Powered by Foreclosure.com

Settings
X
Data:
Loading data...
Based on 2000-2022 data
Loading data...

123
Hide US histogram

Latest news about housing in Glendora, CA collected exclusively by city-data.com from local newspapers, TV, and radio stations

Glendora, California Age and Sex of Residents
Median year house/condo built: 1962

Median year apartment built: 1967

Household type by relationship:

Households: 50,964
  • Male householders: 8,200 (1,398 living alone), Female householders: 8,187 (1,609 living alone)
  • 9,542 spouses (9,462 opposite-sex spouses), 853 unmarried partners, (816 opposite-sex unmarried partners), 16,600 children (16,012 natural, 272 adopted, 315 stepchildren), 1,761 grandchildren, 518 brothers or sisters, 1,306 parents, 0 foster children, 1,077 other relatives, 1,772 non-relatives
  • In group quarters: 1,144

Size of family households: 4,542 2-persons, 2,718 3-persons, 3,385 4-persons, 1,486 5-persons, 485 6-persons, 220 7-or-more-persons.

Size of nonfamily households: 3,225 1-person, 707 2-persons, 86 3-persons, 73 4-persons, 7 7-or-more-persons.

7,608 married couples with children.
1,919 single-parent households (762 men, 1,157 women).

70.3% of residents of Glendora speak English at home.
18.0% of residents speak Spanish at home (76% speak English very well, 14% speak English well, 9% speak English not well, 2% don't speak English at all).
2.3% of residents speak other Indo-European language at home (71% speak English very well, 21% speak English well, 8% speak English not well).
7.4% of residents speak Asian or Pacific Island language at home (62% speak English very well, 25% speak English well, 11% speak English not well, 2% don't speak English at all).
2.7% of residents speak other language at home (53% speak English very well, 21% speak English well, 21% speak English not well, 5% don't speak English at all).

Foreign born population: 9,430 (18.5%)
(68.2% of them are naturalized citizens)

Median number of rooms in houses and condos:
Here:

6.2
State:

6.0

Median number of rooms in apartments
Here:

4.4
State:

3.9

Owner-occupied Renter-occupied
Bedrooms in owner-occupied houses and condos in Glendora, California
  • Bedrooms in owner-occupied houses and condos in Glendora, California
  • 20no bedroom
  • 2051 bedroom
  • 1,2912 bedrooms
  • 6,0303 bedrooms
  • 3,5324 bedrooms
  • 4655+ bedrooms
Bedrooms in renter-occupied apartments in Glendora, California
  • Bedrooms in renter-occupied apartments in Glendora, California
  • 254no bedroom
  • 9631 bedroom
  • 2,2002 bedrooms
  • 1,6013 bedrooms
  • 3774 bedrooms
  • 755+ bedrooms
Owner-occupied Renter-occupied
Cars and other vehicles available in Glendora in owner-occupied houses/condos
  • Cars and other vehicles available in Glendora in owner-occupied houses/condos
  • 145no vehicle
  • 1,9201 vehicle
  • 4,7822 vehicles
  • 2,8033 vehicles
  • 1,3474 vehicles
  • 5475+ vehicles
Cars and other vehicles available in Glendora in renter-occupied apartments
  • Cars and other vehicles available in Glendora in renter-occupied apartments
  • 247no vehicle
  • 1,8821 vehicle
  • 2,2892 vehicles
  • 6783 vehicles
  • 2384 vehicles
  • 1355+ vehicles
Owner-occupied Renter-occupied
Rooms in owner-occupied houses in Glendora, California
  • Rooms in owner-occupied houses in Glendora, California
  • 201 room
  • 542 rooms
  • 2733 rooms
  • 7854 rooms
  • 2,3605 rooms
  • 2,9646 rooms
  • 2,2447 rooms
  • 1,1468 rooms
  • 1,6989+ rooms
Rooms in renter-occupied apartments in Glendora, California
  • Rooms in renter-occupied apartments in Glendora, California
  • 2031 room
  • 3762 rooms
  • 9643 rooms
  • 1,3164 rooms
  • 1,4085 rooms
  • 5486 rooms
  • 3027 rooms
  • 2988 rooms
  • 559+ rooms
Year house built
Median 2022 house/condo value by year built
Median house/condo value by year householder moved into unit
Breakdown of mean house values by ages of householders
Owners and renters by unit type in Glendora, CA
  • Glendora, CA household income distribution

  • Distribution of median household income in Glendora, CA in 2022
  • 486Less than $10,000
  • 787$10,000 to $19,999
  • 494$20,000 to $29,999
  • 772$30,000 to $39,999
  • 897$40,000 to $49,999
  • 1,107$50,000 to $59,999
  • 1,606$60,000 to $74,999
  • 1,737$75,000 to $99,999
  • 2,002$100,000 to $124,999
  • 1,527$125,000 to $149,999
  • 2,331$150,000 to $199,999
  • 3,239$200,000 or more
  • Home value of owner - occupied houses in 2022 in Glendora, CA

  • Distribution of house value in Glendora, CA in 2022
  • 122Less than $10,000
  • 19$20,000 to $24,999
  • 13$25,000 to $29,999
  • 9$30,000 to $34,999
  • 8$40,000 to $49,999
  • 95$50,000 to $59,999
  • 80$60,000 to $69,999
  • 175$70,000 to $79,999
  • 72$80,000 to $89,999
  • 89$90,000 to $99,999
  • 104$100,000 to $124,999
  • 19$125,000 to $149,999
  • 64$150,000 to $174,999
  • 9$175,000 to $199,999
  • 16$200,000 to $249,999
  • 9$250,000 to $299,999
  • 102$300,000 to $399,999
  • 345$400,000 to $499,999
  • 3,798$500,000 to $749,999
  • 3,902$750,000 to $999,999
  • 1,890$1,000,000 to $1,499,999
  • 442$1,500,000 to $1,999,999
  • 262$2,000,000 or more
  • Rent paid by renters in 2022 in Glendora, CA

  • Distribution of rent paid by renters in Glendora, CA in 2022
  • 16Less than $100
  • 9$150 to $199
  • 95$250 to $299
  • 8$500 to $549
  • 21$550 to $599
  • 10$750 to $799
  • 105$800 to $899
  • 30$900 to $999
  • 288$1,000 to $1,249
  • 699$1,250 to $1,499
  • 1,518$1,500 to $1,999
  • 1,309$2,000 to $2,499
  • 823$2,500 to $2,999
  • 149$3,000 to $3,499
  • 95$3,500 or more
  • 333No cash rent
Time Leaving Home To Go To Work in 2022

Percentage of workers working in this county: 86.7%
Number of people working at home: 4,073 (17.0% of all workers)

Travel time (in minutes) to work in 2022

Travel time to work (commute)

  • Less than 5 minutes: 342
  • 5 to 9 minutes: 1,617
  • 10 to 14 minutes: 2,217
  • 15 to 19 minutes: 1,710
  • 20 to 24 minutes: 2,713
  • 25 to 29 minutes: 1,177
  • 30 to 34 minutes: 3,144
  • 35 to 39 minutes: 771
  • 40 to 44 minutes: 1,061
  • 45 to 59 minutes: 2,117
  • 60 to 89 minutes: 1,952
  • 90 or more minutes: 1,039
Means of transportation to work in 2022 - Glendora

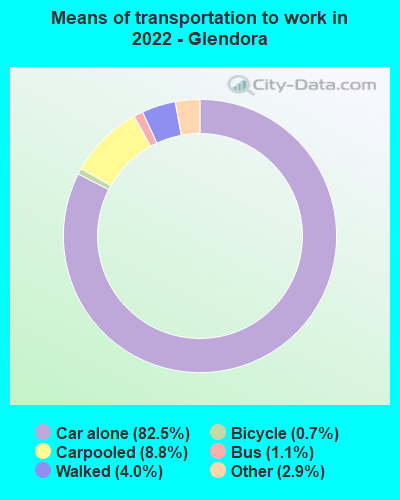
Means of transportation to work:

  • Drove a car alone: 13,620 (66.3%)
  • Carpooled: 1,608 (7.8%)
  • Bus: 161 (0.8%)
  • Taxi: 527 (2.6%)
  • Bicycle: 115 (0.6%)
  • Walked: 712 (3.5%)
  • Worked at home: 4,073 (19.8%)
Class of Workers in 2022
  • Unemployment by race in 2022
  • Unemployment rate for White non-Hispanic residents
  • 6.4%Males
  • 4.9%Females
  • Unemployment rate for Black residents
  • 24.7%Females
  • Unemployment rate for Asian residents
  • 2.3%Males
  • 5.3%Females
  • Unemployment rate for other race residents
  • 1.8%Males
  • 5.2%Females
  • Unemployment rate for two or more race residents
  • 4.3%Males
  • 9.7%Females
  • Unemployment rate for Hispanic or Latino residents
  • 2.3%Males
  • 6.6%Females
Year of entry for the foreign-born population in Glendora, California
  • Year of entry for the foreign-born population in Glendora, California
  • 2,0232010 or later
  • 1,8992000 to 2009
  • 1,5901990 to 1999
  • 2,1051980 to 1989
  • 1,7461970 to 1979
  • 1,582Before 1970
Ancestries in Glendora, CA

First ancestries reported:

  • English: 1,251 (4.6%)
  • German: 1,070 (3.9%)
  • American: 966 (3.5%)
  • Italian: 699 (2.6%)
  • Irish: 690 (2.5%)
  • Syrian: 454 (1.7%)
  • European: 441 (1.6%)
  • Egyptian: 279 (1.0%)
  • Scotch-Irish: 258 (0.9%)
  • Norwegian: 249 (0.9%)
  • Lebanese: 243 (0.9%)
  • Armenian: 236 (0.9%)
  • Eastern European: 160 (0.6%)
  • Scottish: 156 (0.6%)
  • Polish: 152 (0.6%)
  • Russian: 150 (0.5%)
  • African: 142 (0.5%)
  • Dutch: 135 (0.5%)
  • Israeli: 134 (0.5%)
  • Danish: 106 (0.4%)
  • Welsh: 96 (0.4%)
  • Swedish: 89 (0.3%)
  • Palestinian: 74 (0.3%)
  • French Canadian: 59 (0.2%)
  • Greek: 43 (0.2%)
  • Iranian: 43 (0.2%)
  • Hungarian: 42 (0.2%)
  • British: 41 (0.2%)
  • Assyrian: 40 (0.1%)
  • French: 38 (0.1%)
  • Canadian: 34 (0.1%)
  • Swiss: 32 (0.1%)
  • Northern European: 23 (0.08%)
  • Austrian: 22 (0.08%)
  • Czech: 21 (0.08%)
  • Scandinavian: 21 (0.08%)
  • Romanian: 18 (0.07%)
  • Portuguese: 16 (0.06%)
  • Arab: 16 (0.06%)
  • Ukrainian: 15 (0.05%)
  • Latvian: 13 (0.05%)
  • Australian: 11 (0.04%)
  • Slavic: 11 (0.04%)
  • Basque: 9 (0.03%)
  • Lithuanian: 7 (0.03%)
  • Nigerian: 7 (0.03%)
  • Turkish: 7 (0.03%)
  • Slovak: 6 (0.02%)
  • Ethiopian: 6 (0.02%)
  • Serbian: 6 (0.02%)
  • Belizean: 6 (0.02%)
  • Maltese: 5 (0.02%)
  • Iraqi: 5 (0.02%)
  • Bahamian: 3 (0.01%)

Most common places of birth for foreign-born residents (%):

Mexico
Glendora:

23.6% (2,225)
California:

37.2% (3,881,193)

Philippines
Glendora:

8.6% (812)
California:

7.8% (818,297)

China, excluding Hong Kong and Taiwan
Glendora:

8.2% (769)
California:

6.6% (684,672)

El Salvador
Glendora:

6.8% (638)
California:

4.2% (440,287)

Taiwan
Glendora:

5.8% (544)
California:

1.7% (176,274)

India
Glendora:

5.7% (537)
California:

5.2% (539,184)

Syria
Glendora:

5.4% (512)
California:

0.3% (30,949)

Egypt
Glendora:

2.8% (262)
California:

0.4% (42,718)

Guatemala
Glendora:

2.4% (227)
California:

2.8% (290,436)

Lebanon
Glendora:

2.4% (225)
California:

0.3% (31,757)

Hong Kong
Glendora:

2.2% (211)
California:

1.0% (105,215)

Korea
Glendora:

1.7% (159)
California:

3.0% (315,248)

Vietnam
Glendora:

1.6% (152)
California:

4.9% (512,335)

Place of birth for U.S.-born residents:

  • This state: 34,417
  • Other state: 6,560
  • Northeast: 1,521
  • Midwest: 2,254
  • South: 1,362
  • West: 1,352

89.5% of Glendora residents lived in the same house 1 years ago.
   Out of people who lived in different houses, 41.1% lived in this county.
   Out of people who lived in different counties, 64.1% lived in California.


Glendora:

89.5%
State average:

88.9%

Education attainment for males 25 years and older:

  • No schooling: 227
  • Nursery to 4th grade: 27
  • 5th and 6th grade: 152
  • 7th and 8th grade: 74
  • 9th grade: 72
  • 10th grade: 102
  • 11th grade: 90
  • 12th grade, no diploma: 402
  • High school graduate (or equivalency): 3,951
  • Less than 1 year of college: 1,051
  • Some college more than 1 year, no degree: 2,433
  • Associate degree: 1,899
  • Bachelor's degree: 4,259
  • Master's degree: 1,849
  • Professional school degree: 382
  • Doctorate degree: 291
Educational Attainment for Males

Education attainment for females 25 years and older:

  • No schooling: 257
  • Nursery to 4th grade: 148
  • 5th and 6th grade: 134
  • 7th and 8th grade: 154
  • 9th grade: 156
  • 10th grade: 125
  • 11th grade: 77
  • 12th grade, no diploma: 324
  • High school graduate (or equivalency): 3,807
  • Less than 1 year of college: 1,226
  • Some college more than 1 year, no degree: 3,129
  • Associate degree: 2,004
  • Bachelor's degree: 4,185
  • Master's degree: 2,260
  • Professional school degree: 223
  • Doctorate degree: 320
Educational Attainment for Females
Glendora marital status for males
Glendora marital status for females

Housing units in structures:

  • One, detached: 12,419
  • One, attached: 1,593
  • Two: 201
  • 3 or 4: 401
  • 5 to 9: 751
  • 10 to 19: 366
  • 20 to 49: 525
  • 50 or more: 653
  • Mobile homes: 688
  • Boats, RVs, vans, etc.: 7

Median worth of mobile homes: $101,210

Housing units lacking complete plumbing facilities in 2022: 1.5%

Housing units lacking complete kitchen facilities in 2022: 2.5%

House/condo owner moved in on average 16 years ago

Renter moved in on average 3 years ago

Year householders moved into residence in Glendora
Houses and condos Apartments
Most commonly used house heating fuel in houses and condos in Glendora, CA
  • 85.2%Utility gas
  • 10.7%Electricity
  • 2.0%Bottled, tank, or LP gas
  • 0.9%Solar energy
  • 0.5%No fuel used
  • 0.3%Wood
  • 0.2%Fuel oil, kerosene, etc.
  • 0.2%Other fuel
Most commonly used house heating fuel in apartments in Glendora, CA
  • 77.2%Utility gas
  • 18.9%Electricity
  • 1.9%Bottled, tank, or LP gas
  • 0.9%Solar energy
  • 0.5%No fuel used
  • 0.3%Wood
  • 0.1%Coal or coke

Private vs. public school enrollment:

Students in private schools in grades 1 to 8 (elementary and middle school): 781
Here:

16.2%
California:

10.5%

Students in private schools in grades 9 to 12 (high school): 438
Here:

15.3%
California:

8.5%

Students in private undergraduate colleges: 643
Here:

19.2%
California:

15.9%
School Enrollment by Level of School for Male Students
School Enrollment by Level of School for Female Students
Age and Sex of Sensory-Disabled Noninstitutionalized Residents
Age and Sex of Physically-Disabled Noninstitutionalized Residents
Age and Sex of Mentally-Disabled Noninstitutionalized Residents
Age and Sex of Self-Care Disabled Noninstitutionalized Residents
Age and Sex of Go-Outside-Home Disabled Noninstitutionalized Residents
Age and Sex of Noninstitutionalized Residents with Employment Disability