Glens Falls, NY (New York) Houses and Residents
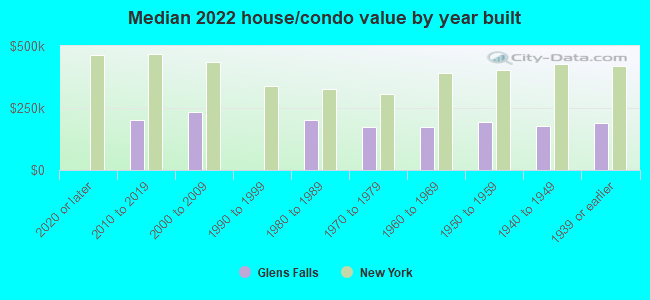
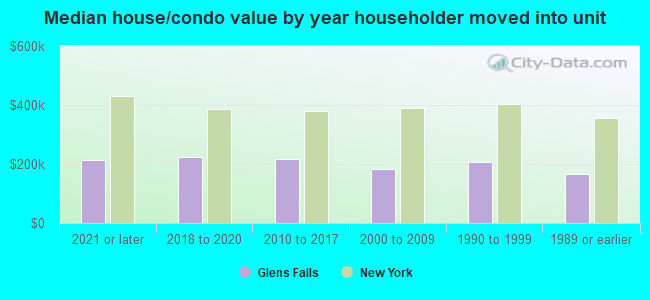
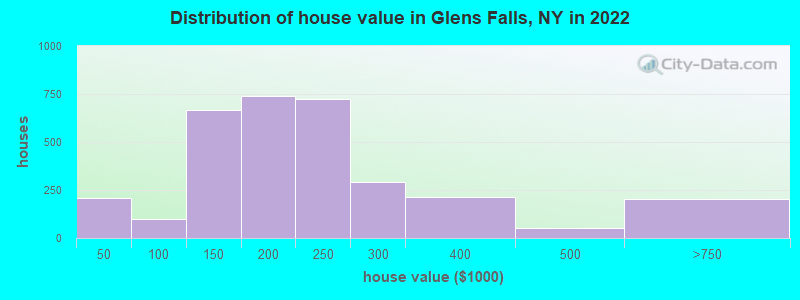
Estimated median house or condo value in 2022: $193,779 (it was $81,800 in 2000 )
Glens Falls:
$193,779New York:
$400,400
Lower value quartile - upper value quartile: $149,767 - $252,744Total population: 14,428 (All urban)
Houses: 7,276 (6,730 occupied: 3,483 owner occupied, 3,379 renter occupied )
% of renters here:
49%State:
46%
Housing density: 1,902 houses/condos per square mile
Median price asked for vacant for-sale houses and condos in 2022: $207,222.
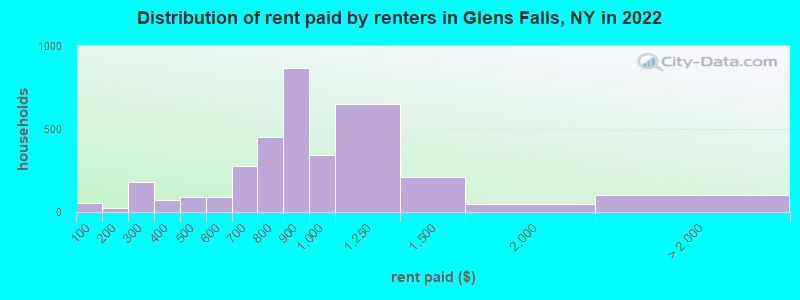
Median contract rent in 2022: $846 (lower quartile is $718, upper quartile is $1,028)
Median rent asked for vacant for-rent units in 2022: $2,057
Median gross rent in Glens Falls, NY in 2022: $1,029
Housing units in Glens Falls with a mortgage: 2,362 (291 second mortgage, 19 home equity loan, 278 both second mortgage and home equity loan )Houses without a mortgage: 192
Median household income for houses/condos with a mortgage: $77,748
Median household income for apartments without a mortgage: $58,937
Median monthly housing costs: $1,103
Data:
Median house or condo value ($)
Median house or condo value ($ change since 2000)
Median house or condo value ($) - White
Median house or condo value ($) - Black or African American
Median house or condo value ($) - Asian
Median house or condo value ($) - Hispanic or Latino
Median house or condo value ($) - American Indian and Alaska Native
Median house or condo value ($) - Multirace
Median house or condo value ($) - Other Race
Median price asked for mobile homes ($)
Household density (households per square mile)
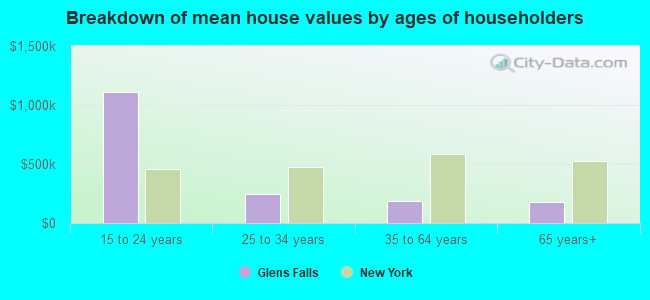
Mean house or condo value by units in structure - 1, detached ($)
Mean house or condo value by units in structure - 1, attached ($)
Mean house or condo value by units in structure - 2 ($)
Mean house or condo value by units in structure by units in structure - 3 or 4 ($)
Mean house or condo value by units in structure - 5 or more ($)
Mean house or condo value by units in structure - Boat, RV, van, etc. ($)
Mean house or condo value by units in structure - Mobile home ($)
Median contract rent ($)
Median contract rent - Lower quartile ($)
Median contract rent - Upper quartile ($)
Median gross rent ($)
Urban houses (%)
Rural houses (%)
Houses occupied (%)
Houses occupied (% change since 2000)
Houses owner occupied (%)
Houses owner occupied (% change since 2000)
Houses renter occupied (%)
Houses renter occupied (% change since 2000)
Vacant housing units - For rent (%)
Vacant housing units - For rent (% change since 2000)
Vacant housing units - For sale only (%)
Vacant housing units - For sale only (% change since 2000)
Vacant housing units - Rented or sold, not occupied (%)
Vacant housing units - Rented or sold, not occupied (% change since 2000)
Vacant housing units - For seasonal, recreational, or occasional use (%)
Vacant housing units - For seasonal, recreational, or occasional use (% change since 2000)
Vacant housing units - For migrant workers (%)
Vacant housing units - For migrant workers (% change since 2000)
Vacant housing units - Other vacant (%)
Vacant housing units - Other vacant (% change since 2000)
Median monthly housing costs ($)
Median household income for houses/condos with a mortgage ($)
Median household income for houses/condos without a mortgage ($)
Median household income ($)
Median household income ($) - White
Median household income ($) - Black or African American
Median household income ($) - Asian
Median household income ($) - Hispanic or Latino
Median household income ($) - American Indian and Alaska Native
Median household income ($) - Multirace
Median household income ($) - Other Race
Mortgage status - with mortgage (%)
Mortgage status - with second mortgage (%)
Mortgage status - with home equity loan (%)
Mortgage status - with both second mortgage and home equity loan (%)
Mortgage status - without a mortgage (%)
Median year house/condo built
Median year apartment built
Household type by relationship - Male householder living alone (%)
Household type by relationship - Male householder not living alone (%)
Household type by relationship - Female householder living alone (%)
Household type by relationship - Female householder not living alone (%)
Household type by relationship - Opposite-Sex spouse (%)
Household type by relationship - Same-Sex spouse (%)
Household type by relationship - Opposite-Sex unmarried partner (%)
Household type by relationship - Same-Sex unmarried partner (%)
Household type by relationship - In group quarters (%)
Size of family households - 2-person household (%)
Size of family households - 3-person household (%)
Size of family households - 4-person household (%)
Size of family households - 5-person household (%)
Size of family households - 6-person household (%)
Size of family households - 7-or-more-person household (%)
Size of nonfamily households - 1-person household (%)
Size of nonfamily households - 2-person household (%)
Size of nonfamily households - 3-person household (%)
Size of nonfamily households - 4-person household (%)
Size of nonfamily households - 5-person household (%)
Size of nonfamily households - 6-person household (%)
Size of nonfamily households - 7-or-moreperson household (%)
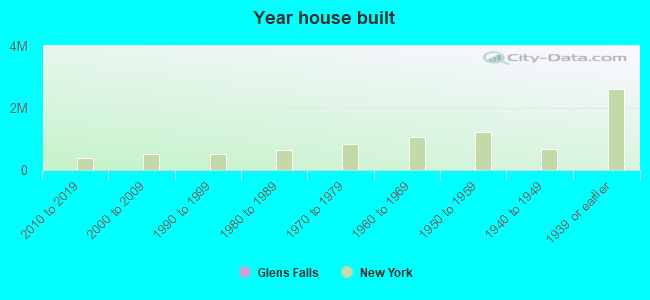
Year house built - Built 2010 or later (%)
Year house built - Built 2000 to 2009 (%)
Year house built - Built 1990 to 1999 (%)
Year house built - Built 1980 to 1989 (%)
Year house built - Built 1970 to 1979 (%)
Year house built - Built 1960 to 1969 (%)
Year house built - Built 1950 to 1959 (%)
Year house built - Built 1940 to 1949 (%)
Year house built - Built 1939 or earlier (%)
Median number of rooms in houses and condos
Median number of rooms in apartments
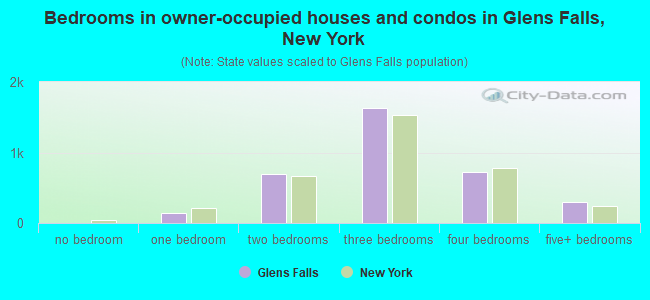
Median number of bedrooms in owner occupied houses
Mean number of bedrooms in owner occupied houses
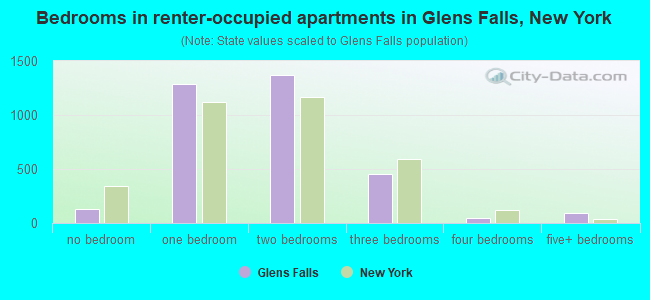
Median number of bedrooms in renter occupied houses
Mean number of bedrooms in renter occupied houses
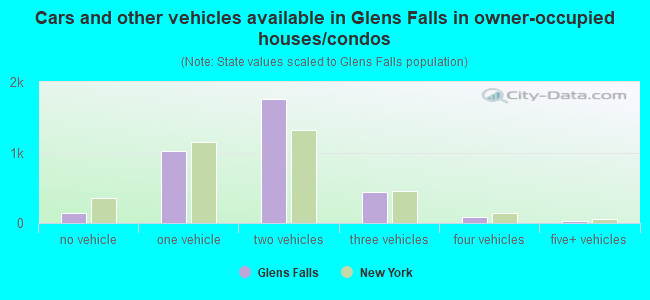
Median number of vehichles in owner occupied houses
Mean number of vehichles in owner occupied houses
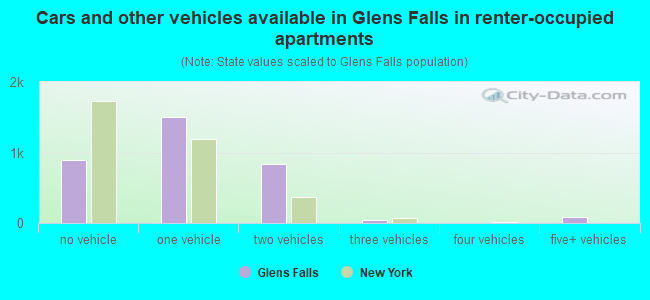
Median number of vehichles in renter occupied houses
Mean number of vehichles in renter occupied houses
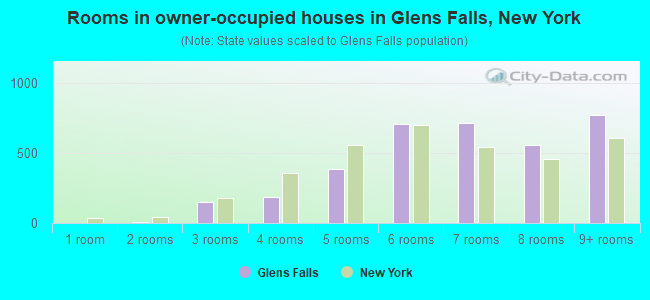
Rooms in owner-occupied houses - 1 room (%)
Rooms in owner-occupied houses - 2 rooms (%)
Rooms in owner-occupied houses - 3 rooms (%)
Rooms in owner-occupied houses - 4 rooms (%)
Rooms in owner-occupied houses - 5 rooms (%)
Rooms in owner-occupied houses - 6 rooms (%)
Rooms in owner-occupied houses - 7 rooms (%)
Rooms in owner-occupied houses - 8 rooms (%)
Rooms in owner-occupied houses - 9+ rooms (%)
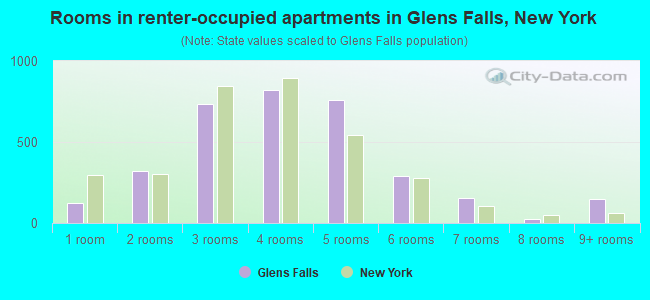
Rooms in renter-occupied houses - 1 room (%)
Rooms in renter-occupied houses - 2 rooms (%)
Rooms in renter-occupied houses - 3 rooms (%)
Rooms in renter-occupied houses - 4 rooms (%)
Rooms in renter-occupied houses - 5 rooms (%)
Rooms in renter-occupied houses - 6 rooms (%)
Rooms in renter-occupied houses - 7 rooms (%)
Rooms in renter-occupied houses - 8 rooms (%)
Rooms in renter-occupied houses - 9+ rooms (%)
Bedrooms in owner-occupied houses - no bedrooms (%)
Bedrooms in owner-occupied houses - 1 bedroom (%)
Bedrooms in owner-occupied houses - 2 bedrooms (%)
Bedrooms in owner-occupied houses - 3 bedrooms (%)
Bedrooms in owner-occupied houses - 4 bedrooms (%)
Bedrooms in owner-occupied houses - 5+ bedrooms (%)
Bedrooms in renter-occupied houses - no bedrooms (%)
Bedrooms in renter-occupied houses - 1 bedroom (%)
Bedrooms in renter-occupied houses - 2 bedrooms (%)
Bedrooms in renter-occupied houses - 3 bedrooms (%)
Bedrooms in renter-occupied houses - 4 bedrooms (%)
Bedrooms in renter-occupied houses - 5+ bedrooms (%)
Vehicles available in owner-occupied houses - no vehicle available (%)
Vehicles available in owner-occupied houses - 1 vehicle available(%)
Vehicles available in owner-occupied houses - 2 Vehicles available (%)
Vehicles available in owner-occupied houses - 3 Vehicles available (%)
Vehicles available in owner-occupied houses - 4 Vehicles available (%)
Vehicles available in owner-occupied houses - 5+ Vehicles available (%)
Vehicles available in renter-occupied houses - no vehicle available (%)
Vehicles available in renter-occupied houses - 1 vehicle available (%)
Vehicles available in renter-occupied houses - 2 Vehicles available (%)
Vehicles available in renter-occupied houses - 3 Vehicles available (%)
Vehicles available in renter-occupied houses - 4 Vehicles available (%)
Vehicles available in renter-occupied houses - 5+ Vehicles available (%)
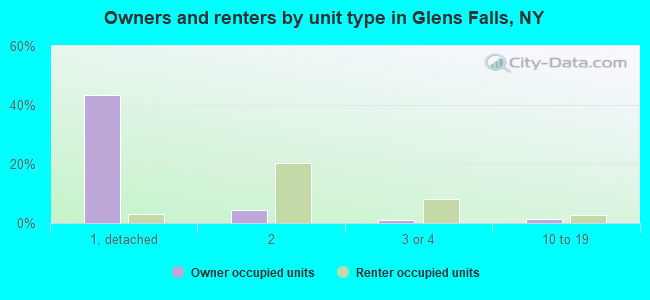
Housing units in structures - 1, detached (%)
Housing units in structures - 1, attached (%)
Housing units in structures - 2 (%)
Housing units in structures - 3 or 4 (%)
Housing units in structures - 5 to 9 (%)
Housing units in structures - 10 to 19 (%)
Housing units in structures - 20 to 49 (%)
Housing units in structures - 50 or more (%)
Housing units in structures - Mobile home (%)
Housing units in structures - Boat, RV, van, etc. (%)
Housing units in structures - Owners - 1, detached (%)
Housing units in structures - Owners - 1, attached (%)
Housing units in structures - Owners - 2 (%)
Housing units in structures - Owners - 3 or 4 (%)
Housing units in structures - Owners - 5 to 9 (%)
Housing units in structures - Owners - 10 to 19 (%)
Housing units in structures - Owners - 20 to 49 (%)
Housing units in structures - Owners - 50 or more (%)
Housing units in structures - Owners - Mobile home (%)
Housing units in structures - Owners - Boat, RV, van, etc. (%)
Housing units in structures - Renters - 1, detached (%)
Housing units in structures - Renters - 1, attached (%)
Housing units in structures - Renters - 2 (%)
Housing units in structures - Renters - 3 or 4 (%)
Housing units in structures - Renters - 5 to 9 (%)
Housing units in structures - Renters - 10 to 19 (%)
Housing units in structures - Renters - 20 to 49 (%)
Housing units in structures - Renters - 50 or more (%)
Housing units in structures - Renters - Mobile home (%)
Housing units in structures - Renters - Boat, RV, van, etc. (%)
House/condo owner moved in on average (years ago)
Renter moved in on average (years ago)
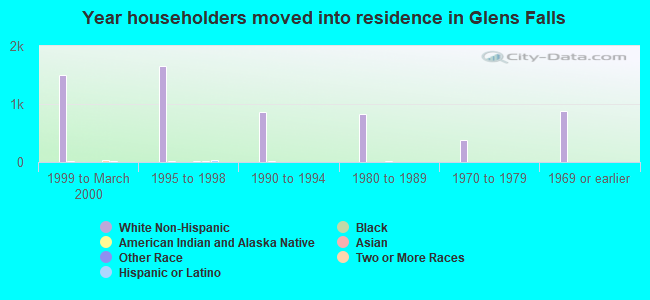
Year householder moved into unit - Moved in 1999 to March 2000 (%)
Year householder moved into unit - Moved in 1999 to March 2000 (%) - White
Year householder moved into unit - Moved in 1999 to March 2000 (%) - Black or African American
Year householder moved into unit - Moved in 1999 to March 2000 (%) - Asian
Year householder moved into unit - Moved in 1999 to March 2000 (%) - Hispanic or Latino
Year householder moved into unit - Moved in 1999 to March 2000 (%) - American Indian and Alaska Native
Year householder moved into unit - Moved in 1999 to March 2000 (%) - Multirace
Year householder moved into unit - Moved in 1999 to March 2000 (%) - Other Race
Year householder moved into unit - Moved in 1995 to 1998 (%)
Year householder moved into unit - Moved in 1995 to 1998 (%) - White
Year householder moved into unit - Moved in 1995 to 1998 (%) - Black or African American
Year householder moved into unit - Moved in 1995 to 1998 (%) - Asian
Year householder moved into unit - Moved in 1995 to 1998 (%) - Hispanic or Latino
Year householder moved into unit - Moved in 1995 to 1998 (%) - American Indian and Alaska Native
Year householder moved into unit - Moved in 1995 to 1998 (%) - Multirace
Year householder moved into unit - Moved in 1995 to 1998 (%) - Other Race
Year householder moved into unit - Moved in 1990 to 1994 (%)
Year householder moved into unit - Moved in 1990 to 1994 (%) - White
Year householder moved into unit - Moved in 1990 to 1994 (%) - Black or African American
Year householder moved into unit - Moved in 1990 to 1994 (%) - Asian
Year householder moved into unit - Moved in 1990 to 1994 (%) - Hispanic or Latino
Year householder moved into unit - Moved in 1990 to 1994 (%) - American Indian and Alaska Native
Year householder moved into unit - Moved in 1990 to 1994 (%) - Multirace
Year householder moved into unit - Moved in 1990 to 1994 (%) - Other Race
Year householder moved into unit - Moved in 1980 to 1989 (%)
Year householder moved into unit - Moved in 1980 to 1989 (%) - White
Year householder moved into unit - Moved in 1980 to 1989 (%) - Black or African American
Year householder moved into unit - Moved in 1980 to 1989 (%) - Asian
Year householder moved into unit - Moved in 1980 to 1989 (%) - Hispanic or Latino
Year householder moved into unit - Moved in 1980 to 1989 (%) - American Indian and Alaska Native
Year householder moved into unit - Moved in 1980 to 1989 (%) - Multirace
Year householder moved into unit - Moved in 1980 to 1989 (%) - Other Race
Year householder moved into unit - Moved in 1970 to 1979 (%)
Year householder moved into unit - Moved in 1970 to 1979 (%) - White
Year householder moved into unit - Moved in 1970 to 1979 (%) - Black or African American
Year householder moved into unit - Moved in 1970 to 1979 (%) - Asian
Year householder moved into unit - Moved in 1970 to 1979 (%) - Hispanic or Latino
Year householder moved into unit - Moved in 1970 to 1979 (%) - American Indian and Alaska Native
Year householder moved into unit - Moved in 1970 to 1979 (%) - Multirace
Year householder moved into unit - Moved in 1970 to 1979 (%) - Other Race
Year householder moved into unit - Moved in 1969 or earlier (%)
Year householder moved into unit - Moved in 1969 or earlier (%) - White
Year householder moved into unit - Moved in 1969 or earlier (%) - Black or African American
Year householder moved into unit - Moved in 1969 or earlier (%) - Asian
Year householder moved into unit - Moved in 1969 or earlier (%) - Hispanic or Latino
Year householder moved into unit - Moved in 1969 or earlier (%) - American Indian and Alaska Native
Year householder moved into unit - Moved in 1969 or earlier (%) - Multirace
Year householder moved into unit - Moved in 1969 or earlier (%) - Other Race
Housing units lacking complete plumbing facilities (%)
Housing units lacking complete kitchen facilities (%)
House heating fuel used in houses and condos - Utility gas (%)
House heating fuel used in houses and condos - Bottled, tank, or LP gas (%)
House heating fuel used in houses and condos - Electricity (%)
House heating fuel used in houses and condos - Fuel oil, kerosene, etc. (%)
House heating fuel used in houses and condos - Coal or coke (%)
House heating fuel used in houses and condos - Wood (%)
House heating fuel used in houses and condos - Solar energy (%)
House heating fuel used in houses and condos - Other fuel (%)
House heating fuel used in houses and condos - No fuel used (%)
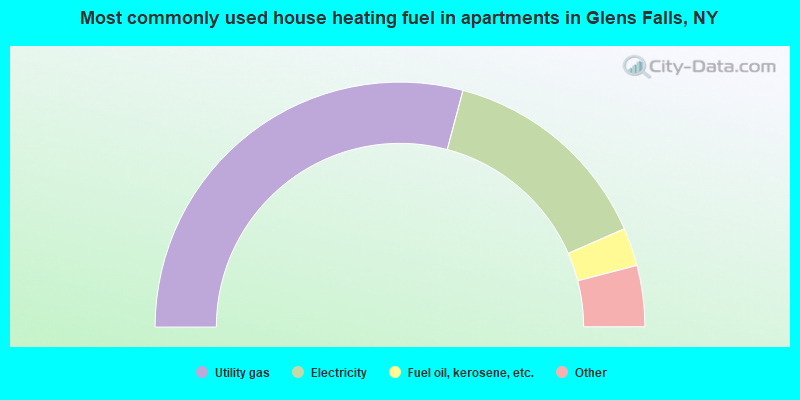
House heating fuel used in apartments - Utility gas (%)
House heating fuel used in apartments - Bottled, tank, or LP gas (%)
House heating fuel used in apartments - Electricity (%)
House heating fuel used in apartments - Fuel oil, kerosene, etc. (%)
House heating fuel used in apartments - Coal or coke (%)
House heating fuel used in apartments - Wood (%)
House heating fuel used in apartments - Solar energy (%)
House heating fuel used in apartments - Other fuel (%)
House heating fuel used in apartments - No fuel used (%)
Median year house/condo built: 1939Median year apartment built: 1940Household type by relationship:
Households: 14,723
Male householders: 3,487 (1,318 living alone ), Female householders: 3,172 (1,068 living alone )2,509 spouses (2,444 opposite-sex spouses ), 967 unmarried partners , (932 opposite-sex unmarried partners ), 3,388 children (3,110 natural , 39 adopted , 237 stepchildren ), 284 grandchildren , 95 brothers or sisters , 46 parents , 0 foster children , 226 other relatives , 235 non-relatives In group quarters: 307
Size of family households: 1,698 2-persons , 1,028 3-persons , 596 4-persons , 191 5-persons , 102 6-persons , 22 7-or-more-persons .
Size of nonfamily households: 2,349 1-person , 769 2-persons .
1,588 married couples with children. single-parent households (417 men , 618 women ).
95.1% of residents of Glens Falls speak English at home. of residents speak Spanish at home (64% speak English very well , 35% speak English well , 1% don't speak English at all ).of residents speak other Indo-European language at home (87% speak English very well , 13% speak English not well ).of residents speak Asian or Pacific Island language at home (100% speak English very well ).of residents speak other language at home (100% speak English very well ).
Foreign born population: 383 (2.6%)of them are naturalized citizens )
Median number of rooms in houses and condos:
Median number of rooms in apartments
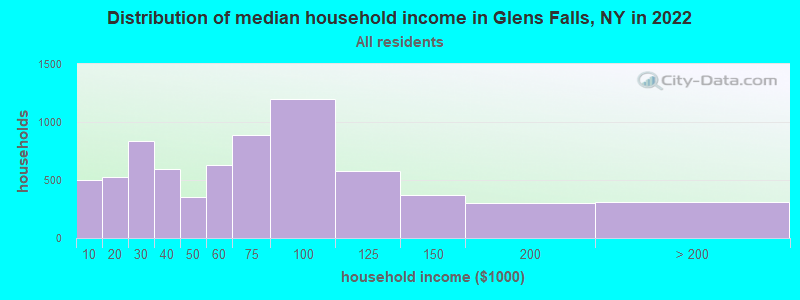
Glens Falls, NY household income distribution 498 Less than $10,000529 $10,000 to $19,999838 $20,000 to $29,999592 $30,000 to $39,999356 $40,000 to $49,999629 $50,000 to $59,999892 $60,000 to $74,9991,198 $75,000 to $99,999575 $100,000 to $124,999372 $125,000 to $149,999301 $150,000 to $199,999309 $200,000 or more
Home value of owner - occupied houses in 2022 in Glens Falls, NY 30 Less than $10,0008 $10,000 to $14,99919 $15,000 to $19,99941 $20,000 to $24,999107 $30,000 to $34,9999 $50,000 to $59,99920 $60,000 to $69,99913 $70,000 to $79,99920 $80,000 to $89,99932 $90,000 to $99,999356 $100,000 to $124,999307 $125,000 to $149,999378 $150,000 to $174,999359 $175,000 to $199,999723 $200,000 to $249,999289 $250,000 to $299,999211 $300,000 to $399,99952 $400,000 to $499,999190 $500,000 to $749,99911 $750,000 to $999,999Rent paid by renters in 2022 in Glens Falls, NY 52 Less than $1008 $100 to $14918 $150 to $199113 $200 to $24965 $250 to $29953 $300 to $34920 $350 to $39957 $400 to $44931 $450 to $49974 $500 to $54915 $550 to $59994 $600 to $649186 $650 to $699207 $700 to $749242 $750 to $799869 $800 to $899345 $900 to $999648 $1,000 to $1,249210 $1,250 to $1,49946 $1,500 to $1,99923 $2,000 to $2,49926 $2,500 to $2,9991 $3,500 or more53 No cash rent
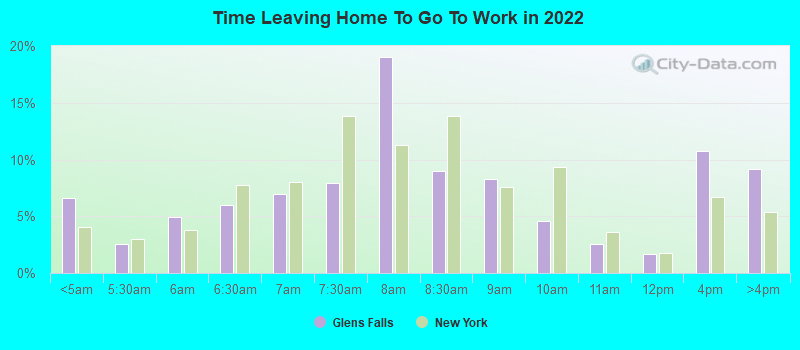
Percentage of workers working in this county: 74.4%Number of people working at home: 515 (6.9% of all workers )
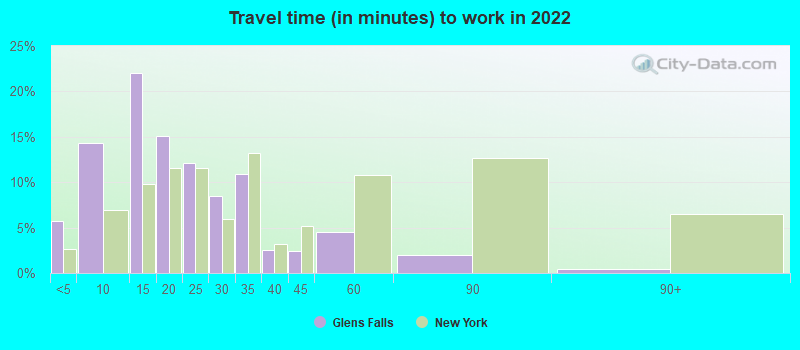
Travel time to work (commute)
Less than 5 minutes: 6885 to 9 minutes: 1,14110 to 14 minutes: 1,76315 to 19 minutes: 84220 to 24 minutes: 38525 to 29 minutes: 39430 to 34 minutes: 57335 to 39 minutes: 11240 to 44 minutes: 21445 to 59 minutes: 29460 to 89 minutes: 19390 or more minutes: 79
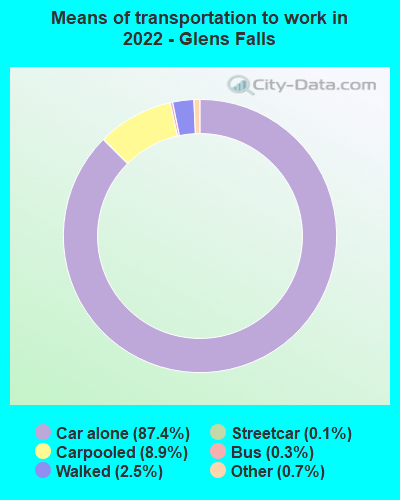
Means of transportation to work:
Drove a car alone: 9,587 (82.1%)Carpooled: 1,032 (8.8%)Bus : 37 (0.3%)Subway or elevated rail : 11 (0.1%)Taxi: 99 (0.8%)Bicycle: 5 (0.0%)Walked: 278 (2.4%)Worked at home: 515 (4.4%)
Unemployment by race in 2022
Unemployment rate for White non-Hispanic residents 4.1% Males5.2% FemalesUnemployment rate for Black residents 33.1% Males16.0% FemalesUnemployment rate for two or more race residents 7.8% Males14.7% FemalesUnemployment rate for Hispanic or Latino residents 9.5% Males23.4% Females
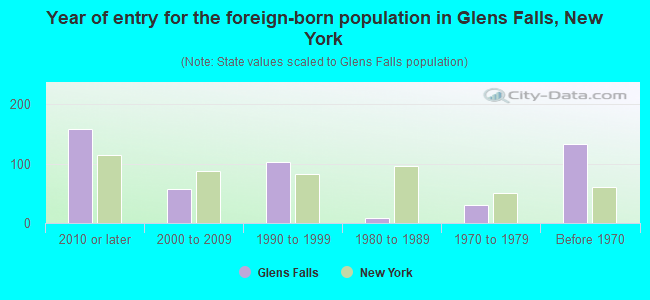
Year of entry for the foreign-born population in Glens Falls, New York
158 2010 or later 57 2000 to 2009 103 1990 to 1999 8 1980 to 1989 30 1970 to 1979 132 Before 1970
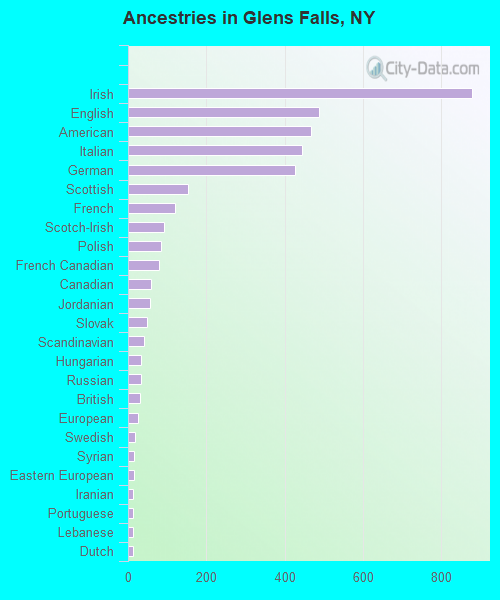
First ancestries reported:
Irish: 878 (17.7%)
English: 488 (9.8%)
American: 467 (9.4%)
Italian: 445 (8.9%)
German: 427 (8.6%)
Scottish: 154 (3.1%)
French: 121 (2.4%)
Scotch-Irish: 92 (1.9%)
Polish: 84 (1.7%)
French Canadian: 78 (1.6%)
Canadian: 58 (1.2%)
Jordanian: 55 (1.1%)
Slovak: 49 (1.0%)
Scandinavian: 40 (0.8%)
Hungarian: 32 (0.6%)
Russian: 32 (0.6%)
British: 30 (0.6%)
European: 26 (0.5%)
Swedish: 17 (0.3%)
Syrian: 16 (0.3%)
Eastern European: 16 (0.3%)
Iranian: 14 (0.3%)
Portuguese: 14 (0.3%)
Lebanese: 12 (0.2%)
Dutch: 12 (0.2%)
Swiss: 11 (0.2%)
Welsh: 11 (0.2%)
Norwegian: 9 (0.2%)
Slovene: 7 (0.1%)
Guyanese: 6 (0.1%)
Northern European: 2 (0.04%) Most common places of birth for foreign-born residents (%): Canada Glens Falls:
24.0% (127)New York:
1.3% (59,107)
Jordan Glens Falls:
13.4% (71)New York:
0.1% (5,923)
Germany Glens Falls:
11.3% (60)New York:
0.9% (38,713)
Argentina Glens Falls:
7.9% (42)New York:
0.5% (21,928)
El Salvador Glens Falls:
7.2% (38)New York:
2.4% (108,067)
Jamaica Glens Falls:
4.7% (25)New York:
5.0% (227,557)
Hungary Glens Falls:
4.3% (23)New York:
0.2% (8,808)
Peru Glens Falls:
3.4% (18)New York:
1.2% (54,759)
Kuwait Glens Falls:
2.6% (14)New York:
0.0% (1,860)
Iran Glens Falls:
2.5% (13)New York:
0.4% (18,283)
Switzerland Glens Falls:
2.3% (12)New York:
0.1% (4,429)
India Glens Falls:
2.3% (12)New York:
3.5% (158,432)
Saudi Arabia Glens Falls:
2.1% (11)New York:
0.1% (3,194)
England Glens Falls:
1.7% (9)New York:
0.5% (23,058)
Pakistan Glens Falls:
1.7% (9)New York:
1.4% (62,442)
Poland Glens Falls:
1.7% (9)New York:
1.4% (65,102)
Korea Glens Falls:
1.5% (8)New York:
1.8% (82,786)
Place of birth for U.S.-born residents:
This state: 11,513Other state: 2,725Northeast: 1,249Midwest: 419South: 746West: 293 83.9% of Glens Falls residents lived in the same house 1 years ago.
Out of people who lived in different houses, 34.8% lived in this county.
Out of people who lived in different counties, 75.1% lived in New York.
Glens Falls:
83.9%State average:
89.6%
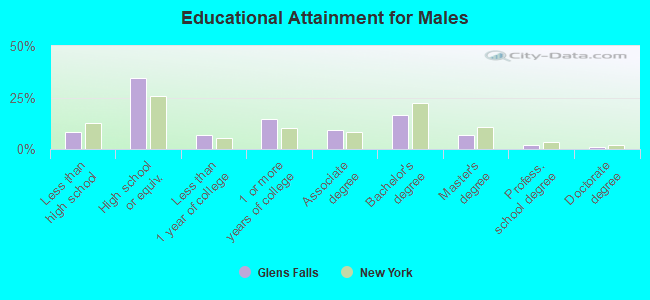
Education attainment for males 25 years and older:
No schooling: 33Nursery to 4th grade: 25th and 6th grade: 197th and 8th grade: 179th grade: 5310th grade: 10511th grade: 8012th grade, no diploma: 132High school graduate (or equivalency): 1,861Less than 1 year of college: 363Some college more than 1 year, no degree: 789Associate degree: 504Bachelor's degree: 900Master's degree: 377Professional school degree: 111Doctorate degree: 41
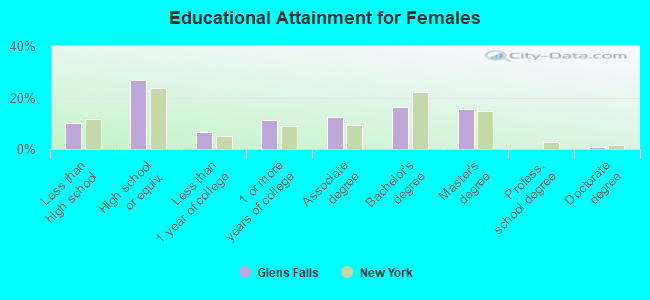
Education attainment for females 25 years and older:
No schooling: 95Nursery to 4th grade: 05th and 6th grade: 77th and 8th grade: 489th grade: 5210th grade: 8011th grade: 10312th grade, no diploma: 123High school graduate (or equivalency): 1,343Less than 1 year of college: 339Some college more than 1 year, no degree: 570Associate degree: 621Bachelor's degree: 808Master's degree: 771Professional school degree: 9Doctorate degree: 43
Housing units in structures:
One, detached: 3,463One, attached: 81Two: 1,5573 or 4: 5925 to 9: 65810 to 19: 27120 to 49: 26150 or more: 373Mobile homes: 16Housing units lacking complete plumbing facilities in 2022: 1.7%Housing units lacking complete kitchen facilities in 2022: 2.7%House/condo owner moved in on average 11 years ago
Renter moved in on average 2 years ago
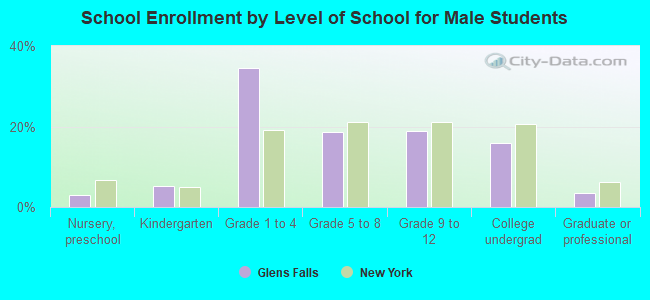
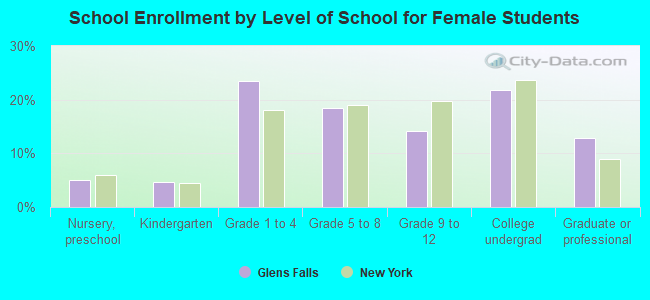
Private vs. public school enrollment:
Students in private schools in grades 1 to 8 (elementary and middle school): 43 Students in private schools in grades 9 to 12 (high school): 97 Students in private undergraduate colleges: 207