Gold Bar, WA (Washington) Houses and Residents
| Gold Bar: | $484,129 |
| Washington: | $569,500 |
Mean price in 2022:
Detached houses: $369,137
Here: $369,137 State: $734,307 Mobile homes: $112,293
Here: $112,293 State: $218,362
Total population: 2,101 (Urban population: 1,969 (all inside urban clusters), Rural population: 0)
Houses: 877 (854 occupied: 687 owner occupied, 159 renter occupied)
| % of renters here: | 19% |
| State: | 36% |
Housing density: 822 houses/condos per square mile
Median price asked for vacant for-sale houses and condos in 2022 in this county: $628,500.
Median contract rent in 2022: $1,216 (lower quartile is $1,041, upper quartile is $1,537)
Median rent asked for vacant for-rent units in 2022: $1,486
Median gross rent in Gold Bar, WA in 2022: $1,362
Housing units in Gold Bar with a mortgage: 481 (78 second mortgage, 0 home equity loan, 80 both second mortgage and home equity loan)
Houses without a mortgage: 0
Median household income for houses/condos with a mortgage: $96,990
Median household income for apartments without a mortgage: $42,545
Median monthly housing costs: $1,539
Compare current foreclosures near Gold Bar, WA:
| Photo | Address | Area | Beds / Baths | Price | Details |
|---|---|---|---|---|---|

|
#1
433rd Ave SE
Gold Bar, WA 98251
|
1,140 sq. feet
|
2 baths 3 beds |
show details | |

|
#2
13th St
Gold Bar, WA 98251
|
1,996 sq. feet
|
2 baths 3 beds |
show details | |

|
#3
May Creek Rd
Gold Bar, WA 98251
|
2,159 sq. feet
|
2 baths 3 beds |
show details | |

|
#4
Goldbar Blvd
Gold Bar, WA 98251
|
2,579 sq. feet
|
- baths - beds |
show details | |

|
#5
Mountain View Pl E
Gold Bar, WA 98251
|
- sq. feet
|
- baths - beds |
show details | |

|
#6
320th Ave NE
Duvall, WA 98019
|
3,140 sq. feet
|
2 baths 3 beds |
show details | |

|
#7
Deerfield Dr SE
Monroe, WA 98272
|
1,923 sq. feet
|
3 baths 3 beds |
show details | |

|
#8
Chain Lake Rd
Monroe, WA 98272
|
1,262 sq. feet
|
3 baths 3 beds |
show details | |

|
#9
296th Pl NE
Duvall, WA 98019
|
2,930 sq. feet
|
5 baths 4 beds |
show details | |

|
#10
NE 172nd St
Duvall, WA 98019
|
3,780 sq. feet
|
3 baths 4 beds |
show details |
| Photo | Address | Area | Beds / Baths | Price | Details |
|---|---|---|---|---|---|

|
#11
317th Ave NE
Carnation, WA 98014
|
3,000 sq. feet
|
4 baths 3 beds |
show details | |

|
#12
Storm Lake Rd
Snohomish, WA 98290
|
2,323 sq. feet
|
3 baths 3 beds |
show details | |

|
#13
Heintz Ave SE
Monroe, WA 98272
|
1,455 sq. feet
|
2 baths 3 beds |
show details | |

|
#14
152nd St SE
Monroe, WA 98272
|
2,573 sq. feet
|
3 baths 3 beds |
show details | |

|
#15
NE 152nd St
Duvall, WA 98019
|
1,720 sq. feet
|
2 baths 3 beds |
show details | |

|
#16
NE 141st St
Duvall, WA 98019
|
2,000 sq. feet
|
3 baths 3 beds |
show details | |

|
#17
231st Dr NE
Granite Falls, WA 98252
|
1,080 sq. feet
|
3 baths 4 beds |
show details | |

|
#18
Lost Lake Rd
Snohomish, WA 98296
|
2,782 sq. feet
|
2 baths 5 beds |
show details | |

|
#19
Woods Creek Rd
Monroe, WA 98272
|
2,496 sq. feet
|
2 baths 4 beds |
show details | |

|
#20
Cherry Valley Rd
Monroe, WA 98272
|
2,045 sq. feet
|
3 baths 3 beds |
show details |
| Photo | Address | Area | Beds / Baths | Price | Details |
|---|---|---|---|---|---|

|
#21
Alder Ave
Sultan, WA 98294
|
1,486 sq. feet
|
2 baths 3 beds |
show details | |

|
#22
Gohr Rd
Sultan, WA 98294
|
1,188 sq. feet
|
3 baths 5 beds |
show details | |

|
#23
Cascade St
Sultan, WA 98294
|
- sq. feet
|
2 baths 3 beds |
show details | |

|
#24
3 Lakes Rd
Snohomish, WA 98290
|
1,740 sq. feet
|
1 baths 2 beds |
show details | |

|
#25
Mcallister Rd
Snohomish, WA 98290
|
2,624 sq. feet
|
3 baths 4 beds |
show details | |

|
#26
158th Pl SE
Monroe, WA 98272
|
1,632 sq. feet
|
2 baths 3 beds |
show details | |

|
#27
173rd Ave SE
Monroe, WA 98272
|
1,589 sq. feet
|
2 baths 3 beds |
show details | |

|
#28
Austin Ave SE
Monroe, WA 98272
|
1,580 sq. feet
|
2 baths 3 beds |
show details | |

|
#29
Junction Ln
Sultan, WA 98294
|
1,652 sq. feet
|
2 baths 3 beds |
show details | |

|
#30
167th Ave SE
Monroe, WA 98272
|
1,254 sq. feet
|
2 baths 3 beds |
show details |
| Photo | Address | Area | Beds / Baths | Price | Details |
|---|---|---|---|---|---|

|
#31
Batten Rd NE
Duvall, WA 98019
|
1,380 sq. feet
|
1 baths 2 beds |
show details | |

|
#32
NE 155th Pl
Duvall, WA 98019
|
2,410 sq. feet
|
2 baths 3 beds |
show details | |

|
#33
178th Dr SE
Snohomish, WA 98290
|
1,625 sq. feet
|
2 baths 3 beds |
show details | |

|
#34
NE 141st Pl
Duvall, WA 98019
|
2,000 sq. feet
|
2 baths 3 beds |
show details | |

|
#35
195th Ave SE
Snohomish, WA 98290
|
4,836 sq. feet
|
3 baths 3 beds |
show details | |

|
#36
Alyson Dr
Granite Falls, WA 98252
|
980 sq. feet
|
1 baths 3 beds |
show details | |

|
#37
35th Pl NE
Granite Falls, WA 98252
|
1,456 sq. feet
|
2 baths 3 beds |
show details | |

|
#38
153rd Ave SE
Snohomish, WA 98296
|
2,112 sq. feet
|
2 baths 3 beds |
show details | |

|
#39
153rd Ave SE
Snohomish, WA 98290
|
1,196 sq. feet
|
1 baths 2 beds |
show details | |

|
#40
148th Ave SE
Snohomish, WA 98296
|
4,320 sq. feet
|
4 baths 4 beds |
show details |
| Photo | Address | Area | Beds / Baths | Price | Details |
|---|---|---|---|---|---|

|
#41
Welch Rd
Snohomish, WA 98296
|
3,228 sq. feet
|
2 baths 4 beds |
show details | |

|
#42
Welch Rd
Snohomish, WA 98296
|
3,228 sq. feet
|
2 baths 4 beds |
show details | |

|
#43
230th Ave NE
Woodinville, WA 98077
|
3,400 sq. feet
|
4 baths 4 beds |
show details | |

|
#44
Esther Ave SE
Monroe, WA 98272
|
1,208 sq. feet
|
2 baths 3 beds |
show details | |

|
#45
Laurel Ln SE
Monroe, WA 98272
|
1,227 sq. feet
|
2 baths 3 beds |
show details | |

|
#46
160th St SE
Monroe, WA 98272
|
1,562 sq. feet
|
2 baths 2 beds |
show details | |

|
#47
Powell St
Monroe, WA 98272
|
1,240 sq. feet
|
1 baths 2 beds |
show details | |

|
#48
219th Ave SE
Snohomish, WA 98290
|
3,531 sq. feet
|
3 baths 4 beds |
show details | |

|
#49
Ingraham Rd
Snohomish, WA 98290
|
1,312 sq. feet
|
1 baths 3 beds |
show details | |

|
Check over 1 million property listings on Foreclosure.com!
|
browse all offers | |||


Median year apartment built: 1993
Household type by relationship:
Households: 2,371- Male householders: 396 (147 living alone), Female householders: 443 (100 living alone)
485 spouses (485 opposite-sex spouses), 23 unmarried partners, (23 opposite-sex unmarried partners), 852 children (740 natural, 0 adopted, 112 stepchildren), 59 grandchildren, 39 brothers or sisters, 17 parents, 6 foster children, 19 other relatives, 27 non-relatives
Size of family households: 156 2-persons, 140 3-persons, 134 4-persons, 58 5-persons, 54 6-persons.
Size of nonfamily households: 263 1-person, 31 2-persons, 6 3-persons.
562 married couples with children.
22 single-parent households (13 men, 9 women).
89.5% of residents of Gold Bar speak English at home.
9.2% of residents speak Spanish at home (48% speak English very well, 36% speak English well, 17% speak English not well).
0.1% of residents speak other Indo-European language at home (100% speak English very well).
0.5% of residents speak Asian or Pacific Island language at home (100% speak English well).
Foreign born population: 305 (12.9%)
(11.1% of them are naturalized citizens)
| Here: | 5.6 |
| State: | 6.5 |
| Here: | 4.2 |
| State: | 3.9 |

- Bedrooms in owner-occupied houses and condos in Gold Bar, Washington
- 0no bedroom
- 401 bedroom
- 702 bedrooms
- 4683 bedrooms
- 1044 bedrooms
- 65+ bedrooms

- Bedrooms in renter-occupied apartments in Gold Bar, Washington
- 0no bedroom
- 111 bedroom
- 712 bedrooms
- 543 bedrooms
- 244 bedrooms
- 05+ bedrooms

- Cars and other vehicles available in Gold Bar in owner-occupied houses/condos
- 17no vehicle
- 1581 vehicle
- 1912 vehicles
- 2083 vehicles
- 934 vehicles
- 205+ vehicles

- Cars and other vehicles available in Gold Bar in renter-occupied apartments
- 20no vehicle
- 311 vehicle
- 852 vehicles
- 113 vehicles
- 124 vehicles
- 05+ vehicles

- Rooms in owner-occupied houses in Gold Bar, Washington
- 01 room
- 72 rooms
- 73 rooms
- 1074 rooms
- 2075 rooms
- 1086 rooms
- 957 rooms
- 1008 rooms
- 559+ rooms

- Rooms in renter-occupied apartments in Gold Bar, Washington
- 01 room
- 02 rooms
- 273 rooms
- 704 rooms
- 295 rooms
- 246 rooms
- 07 rooms
- 08 rooms
- 119+ rooms


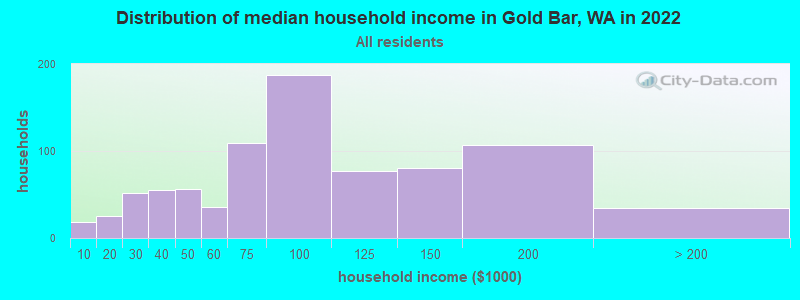
Gold Bar, WA household income distribution

- 18Less than $10,000
- 25$10,000 to $19,999
- 52$20,000 to $29,999
- 55$30,000 to $39,999
- 56$40,000 to $49,999
- 36$50,000 to $59,999
- 109$60,000 to $74,999
- 187$75,000 to $99,999
- 77$100,000 to $124,999
- 80$125,000 to $149,999
- 107$150,000 to $199,999
- 34$200,000 or more
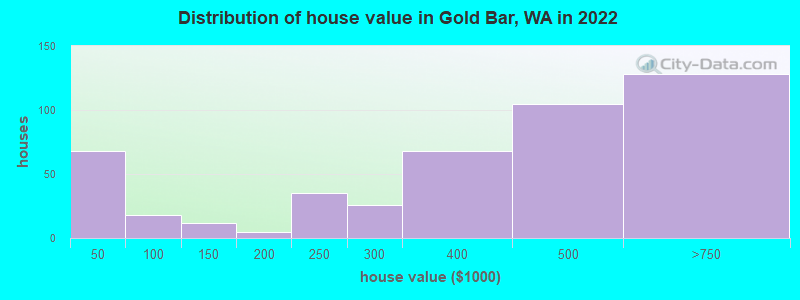
Home value of owner - occupied houses in 2022 in Gold Bar, WA
-
- 48Less than $10,000
- 6$10,000 to $14,999
- 6$15,000 to $19,999
- 6$25,000 to $29,999
- 12$50,000 to $59,999
- 4$60,000 to $69,999
- 12$125,000 to $149,999
- 5$150,000 to $174,999
- 35$200,000 to $249,999
- 25$250,000 to $299,999
- 68$300,000 to $399,999
- 105$400,000 to $499,999
- 128$500,000 to $749,999
Rent paid by renters in 2022 in Gold Bar, WA
-
- 8$200 to $249
- 8$750 to $799
- 11$900 to $999
- 42$1,000 to $1,249
- 21$1,250 to $1,499
- 36$1,500 to $1,999
- 3$2,000 to $2,499
- 13No cash rent

Percentage of workers working in this county: 83.3%
Number of people working at home: 175 (16.2% of all workers)
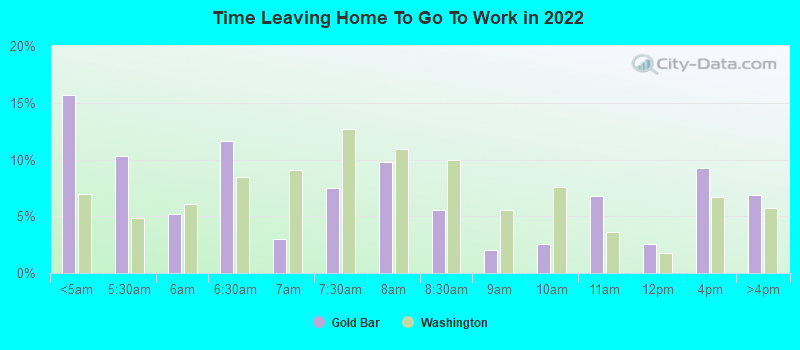
Travel time to work (commute)
- Less than 5 minutes: 17
- 5 to 9 minutes: 77
- 10 to 14 minutes: 42
- 15 to 19 minutes: 59
- 20 to 24 minutes: 33
- 25 to 29 minutes: 57
- 30 to 34 minutes: 74
- 35 to 39 minutes: 78
- 40 to 44 minutes: 17
- 45 to 59 minutes: 183
- 60 to 89 minutes: 166
- 90 or more minutes: 61
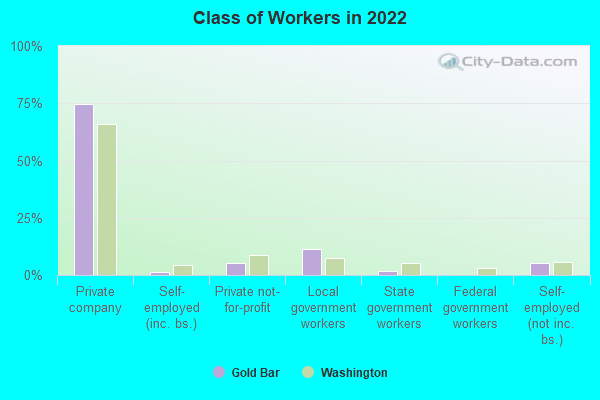
Means of transportation to work:
- Drove a car alone: 688 (74.4%)
- Carpooled: 172 (18.6%)
- Bus or trolley bus: 20 (2.2%)
- Walked: 12 (1.3%)
- Other means: 3 (0.3%)
- Worked at home: 30 (3.2%)
- Unemployment by race in 2022
- Unemployment rate for White non-Hispanic residents
- 1.8%Males
- 7.7%Females
- Unemployment rate for two or more race residents
- 18.6%Females

- Year of entry for the foreign-born population in Gold Bar, Washington
- 2202010 or later
- 602000 to 2009
- 271990 to 1999
- 101980 to 1989
- 51970 to 1979
- 10Before 1970
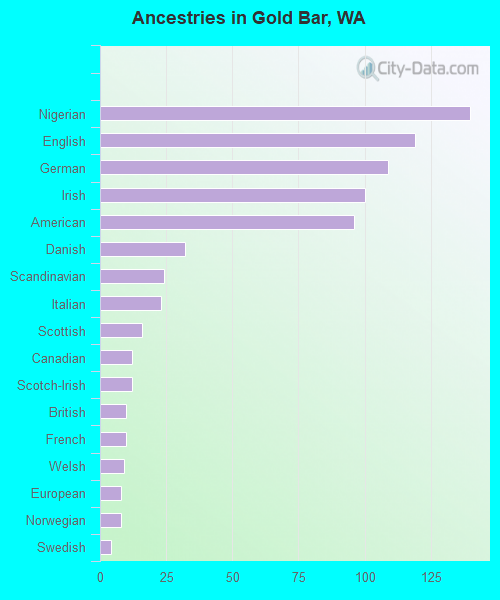
First ancestries reported:
- Nigerian: 140 (13.9%)
- English: 119 (11.8%)
- German: 109 (10.8%)
- Irish: 100 (10.0%)
- American: 96 (9.6%)
- Danish: 32 (3.2%)
- Scandinavian: 24 (2.4%)
- Italian: 23 (2.3%)
- Scottish: 16 (1.6%)
- Canadian: 12 (1.2%)
- Scotch-Irish: 12 (1.2%)
- British: 10 (1.0%)
- French: 10 (1.0%)
- Welsh: 9 (0.9%)
- European: 8 (0.8%)
- Norwegian: 8 (0.8%)
- Swedish: 4 (0.4%)
Most common places of birth for foreign-born residents (%):
| Gold Bar: | 44.6% (135) |
| Washington: | 0.2% (2,660) |
| Gold Bar: | 14.9% (45) |
| Washington: | 21.1% (241,655) |
| Gold Bar: | 13.9% (42) |
| Washington: | 1.2% (13,745) |
| Gold Bar: | 11.9% (36) |
| Washington: | 1.2% (13,855) |
| Gold Bar: | 5.9% (18) |
| Washington: | 0.8% (9,457) |
| Gold Bar: | 5.6% (17) |
| Washington: | 0.2% (1,831) |
| Gold Bar: | 3.6% (11) |
| Washington: | 6.3% (71,661) |
| Gold Bar: | 3.6% (11) |
| Washington: | 0.6% (6,500) |
| Gold Bar: | 3.3% (10) |
| Washington: | 4.1% (47,238) |
Place of birth for U.S.-born residents:
- This state: 1,161
- Other state: 847
- Northeast: 115
- Midwest: 270
- South: 73
- West: 397
89.3% of Gold Bar residents lived in the same house 1 years ago.
Out of people who lived in different houses, 21.8% lived in this county.
Out of people who lived in different counties, 64.6% lived in Washington.
| Gold Bar: | 89.3% |
| State average: | 85.2% |
Education attainment for males 25 years and older:
- No schooling: 10
- Nursery to 4th grade: 0
- 5th and 6th grade: 11
- 7th and 8th grade: 31
- 9th grade: 0
- 10th grade: 5
- 11th grade: 12
- 12th grade, no diploma: 25
- High school graduate (or equivalency): 269
- Less than 1 year of college: 49
- Some college more than 1 year, no degree: 163
- Associate degree: 114
- Bachelor's degree: 60
- Master's degree: 0
- Professional school degree: 6
- Doctorate degree: 0

Education attainment for females 25 years and older:
- No schooling: 8
- Nursery to 4th grade: 0
- 5th and 6th grade: 0
- 7th and 8th grade: 9
- 9th grade: 7
- 10th grade: 0
- 11th grade: 0
- 12th grade, no diploma: 6
- High school graduate (or equivalency): 175
- Less than 1 year of college: 80
- Some college more than 1 year, no degree: 194
- Associate degree: 141
- Bachelor's degree: 61
- Master's degree: 59
- Professional school degree: 0
- Doctorate degree: 0


Housing units in structures:
- One, detached: 632
- Two: 4
- 10 to 19: 9
- Mobile homes: 214
- Boats, RVs, vans, etc.: 16
House/condo owner moved in on average 8 years ago
Renter moved in on average 3 years ago

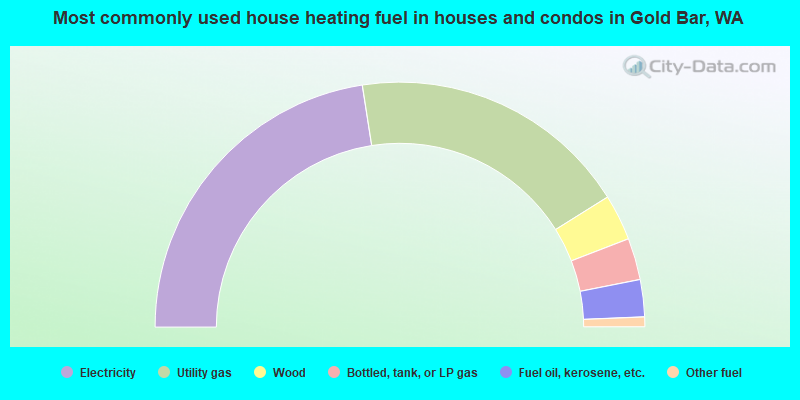
- 45.1%Electricity
- 37.1%Utility gas
- 6.1%Wood
- 5.5%Bottled, tank, or LP gas
- 4.9%Fuel oil, kerosene, etc.
- 1.3%Other fuel
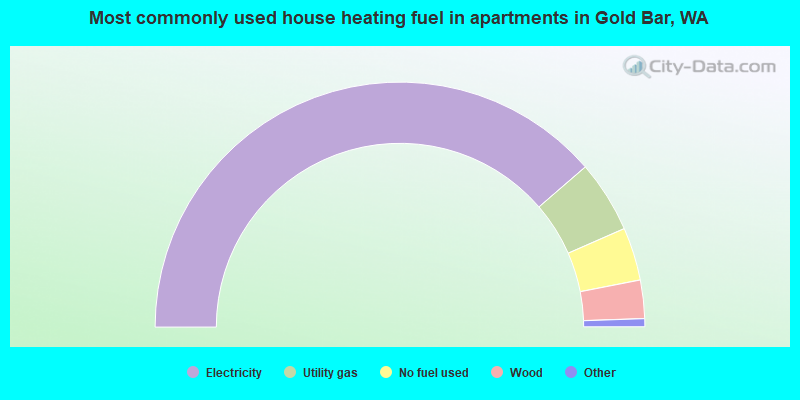
- 78.2%Electricity
- 9.6%Utility gas
- 7.1%No fuel used
- 5.1%Wood
Private vs. public school enrollment:
| Here: | 0.0% |
| Washington: | 12.4% |
| Here: | 0.0% |
| Washington: | 9.2% |
| Here: | 9.6% |
| Washington: | 16.5% |


