Gonzales, CA (California) Houses and Residents
| Gonzales: | $618,291 |
| California: | $715,900 |
Total population: 8,440 (Urban population: 7,726 (all inside urban clusters), Rural population: 0)
Houses: 2,401 (2,379 occupied: 1,385 owner occupied, 995 renter occupied)
| % of renters here: | 42% |
| State: | 44% |
Housing density: 1,732 houses/condos per square mile
Median price asked for vacant for-sale houses and condos in 2022 in this county: $440,221.
Median contract rent in 2022: $1,378 (lower quartile is $886, upper quartile is $1,730)
Median gross rent in Gonzales, CA in 2022: $1,465
Housing units in Gonzales with a mortgage: 1,014 (11 second mortgage, 0 home equity loan, 0 both second mortgage and home equity loan)
Houses without a mortgage: 0
Median household income for houses/condos with a mortgage: $108,259
Median household income for apartments without a mortgage: $81,389
Median monthly housing costs: $1,733
Compare current foreclosures near Gonzales, CA:
| Photo | Address | Area | Beds / Baths | Price | Details |
|---|---|---|---|---|---|

|
#1
Burgundy Way
Gonzales, CA 93926
|
- sq. feet
|
3 baths 5 beds |
show details | |

|
#2
Holstein Way
Gonzales, CA 93926
|
- sq. feet
|
2 baths 4 beds |
show details | |

|
#3
Charolais Dr
Gonzales, CA 93926
|
- sq. feet
|
2 baths 4 beds |
show details | |

|
#4
Zinfandel Dr
Gonzales, CA 93926
|
- sq. feet
|
- baths - beds |
show details | |

|
#5
Chardonnay Dr Apt A
Gonzales, CA 93926
|
- sq. feet
|
- baths - beds |
show details | |

|
#6
Little River Dr
Salinas, CA 93906
|
2,405 sq. feet
|
2 baths 4 beds |
show details | |

|
#7
Legends Ct
Salinas, CA 93908
|
3,821 sq. feet
|
4 baths 5 beds |
show details | |

|
#8
Amarillo Way
Salinas, CA 93905
|
1,065 sq. feet
|
2 baths 3 beds |
show details | |

|
#9
3rd St
Soledad, CA 93960
|
1,165 sq. feet
|
2 baths 4 beds |
show details | |

|
#10
La Mesa Dr
Salinas, CA 93901
|
1,456 sq. feet
|
2 baths 3 beds |
show details |
| Photo | Address | Area | Beds / Baths | Price | Details |
|---|---|---|---|---|---|

|
#11
Alameda Ave
Salinas, CA 93901
|
1,720 sq. feet
|
2 baths 3 beds |
show details | |

|
#12
W Alisal St
Salinas, CA 93901
|
2,122 sq. feet
|
1 baths 3 beds |
show details | |

|
#13
Arezzo Cir
Salinas, CA 93905
|
2,131 sq. feet
|
2 baths 5 beds |
show details | |

|
#14
Main St
Soledad, CA 93960
|
1,542 sq. feet
|
2 baths 3 beds |
show details | |

|
#15
Garner Ave
Salinas, CA 93905
|
1,152 sq. feet
|
1 baths 3 beds |
show details | |

|
#16
Burke St
Salinas, CA 93905
|
1,362 sq. feet
|
2 baths 3 beds |
show details | |

|
#17
2nd Ave
Salinas, CA 93905
|
1,130 sq. feet
|
1 baths 2 beds |
show details | |

|
#18
La Mesa Dr
Salinas, CA 93901
|
1,874 sq. feet
|
2 baths 3 beds |
show details | |

|
#19
Terrace St
Salinas, CA 93905
|
1,315 sq. feet
|
2 baths 3 beds |
show details | |

|
#20
Amarillo Way
Salinas, CA 93905
|
1,277 sq. feet
|
2 baths 4 beds |
show details |
| Photo | Address | Area | Beds / Baths | Price | Details |
|---|---|---|---|---|---|

|
#21
Carmel Ave
Salinas, CA 93901
|
1,240 sq. feet
|
1 baths 2 beds |
show details | |

|
#22
Garner Ave
Salinas, CA 93905
|
1,030 sq. feet
|
3 baths 3 beds |
show details | |

|
#23
Bernardo Ave
Salinas, CA 93905
|
1,282 sq. feet
|
2 baths 4 beds |
show details | |

|
#24
Josephine St
Salinas, CA 93905
|
1,107 sq. feet
|
2 baths 3 beds |
show details | |

|
#25
Pacific Ave
Salinas, CA 93905
|
1,008 sq. feet
|
1 baths 3 beds |
show details | |

|
#26
Portola Dr
Salinas, CA 93908
|
1,748 sq. feet
|
2 baths 3 beds |
show details | |

|
#27
Alameda Ave
Salinas, CA 93901
|
1,720 sq. feet
|
2 baths 3 beds |
show details | |

|
#28
Saint Augustine Dr
Salinas, CA 93905
|
1,384 sq. feet
|
2 baths 3 beds |
show details | |

|
#29
Saint Edwards Dr
Salinas, CA 93905
|
1,456 sq. feet
|
2 baths 3 beds |
show details | |

|
#30
Oak St
Salinas, CA 93901
|
1,392 sq. feet
|
1 baths 3 beds |
show details |
| Photo | Address | Area | Beds / Baths | Price | Details |
|---|---|---|---|---|---|

|
#31
Calle De La Paloma
Carmel Valley, CA 93924
|
1,895 sq. feet
|
2 baths 4 beds |
show details | |

|
#32
Paloma Dr
Greenfield, CA 93927
|
1,146 sq. feet
|
2 baths 3 beds |
show details | |

|
#33
W Alisal St
Salinas, CA 93901
|
1,525 sq. feet
|
2 baths 3 beds |
show details | |

|
#34
Greenbriar Way
Salinas, CA 93907
|
1,624 sq. feet
|
2 baths 3 beds |
show details | |

|
#35
Los Altos Way
Salinas, CA 93906
|
1,742 sq. feet
|
2 baths 4 beds |
show details | |

|
#36
Preston St
Salinas, CA 93901
|
1,060 sq. feet
|
2 baths 3 beds |
show details | |

|
#37
Los Altos Way
Salinas, CA 93906
|
1,440 sq. feet
|
2 baths 3 beds |
show details | |

|
#38
Atherton Way
Salinas, CA 93906
|
1,763 sq. feet
|
2 baths 4 beds |
show details | |

|
#39
Primavera Ct
Greenfield, CA 93927
|
871 sq. feet
|
1 baths 2 beds |
show details | |

|
#40
Franscioni Dr
Greenfield, CA 93927
|
1,272 sq. feet
|
1 baths 4 beds |
show details |
| Photo | Address | Area | Beds / Baths | Price | Details |
|---|---|---|---|---|---|

|
#41
Baywood Pl
Salinas, CA 93901
|
1,674 sq. feet
|
2 baths 2 beds |
show details | |

|
#42
Maple St
Salinas, CA 93901
|
1,245 sq. feet
|
1 baths 3 beds |
show details | |

|
#43
Los Olivos Dr Unit 20
Salinas, CA 93901
|
1,275 sq. feet
|
1 baths 2 beds |
show details | |

|
#44
Woodside Dr Unit 110
Salinas, CA 93901
|
1,773 sq. feet
|
2 baths 3 beds |
show details | |

|
#45
Coleridge Dr
Salinas, CA 93901
|
2,190 sq. feet
|
2 baths 3 beds |
show details | |

|
#46
Boston St
Salinas, CA 93906
|
2,071 sq. feet
|
2 baths 4 beds |
show details | |

|
#47
Chaucer Dr
Salinas, CA 93901
|
1,360 sq. feet
|
2 baths 3 beds |
show details | |

|
#48
Chestnut St
Salinas, CA 93901
|
1,913 sq. feet
|
2 baths 2 beds |
show details | |

|
#49
Mayfair Dr
Salinas, CA 93905
|
1,063 sq. feet
|
1 baths 3 beds |
show details | |

|
Check over 1 million property listings on Foreclosure.com!
|
browse all offers | |||

Latest news about housing in Gonzales, CA collected exclusively by city-data.com from local newspapers, TV, and radio stations

 | Is Monterey Conservative? (18 replies) |
| Living in Monterey County with kids (43 replies) |
| Being forced to move to King City (25 replies) |
| Monterey County/Salinas/Monterey Places to Live (14 replies) |

Median year apartment built: 1981
Household type by relationship:
Households: 8,487- Male householders: 1,056 (129 living alone), Female householders: 1,273 (79 living alone)
1,402 spouses (1,376 opposite-sex spouses), 252 unmarried partners, (252 opposite-sex unmarried partners), 3,404 children (3,342 natural, 0 adopted, 62 stepchildren), 666 grandchildren, 40 brothers or sisters, 109 parents, 52 foster children, 210 other relatives, 12 non-relatives
- In group quarters: 5
Size of family households: 647 2-persons, 387 3-persons, 161 4-persons, 515 5-persons, 370 6-persons, 61 7-or-more-persons.
Size of nonfamily households: 209 1-person, 75 2-persons.
1,099 married couples with children.
621 single-parent households (246 men, 375 women).
26.5% of residents of Gonzales speak English at home.
73.3% of residents speak Spanish at home (53% speak English very well, 12% speak English well, 13% speak English not well, 22% don't speak English at all).
0.5% of residents speak other Indo-European language at home (83% speak English very well, 17% speak English well).
0.4% of residents speak Asian or Pacific Island language at home (74% speak English well, 26% speak English not well).
Foreign born population: 2,746 (32.4%)
(20.2% of them are naturalized citizens)
| Here: | 5.8 |
| State: | 6.0 |
| Here: | 4.1 |
| State: | 3.9 |

- Bedrooms in owner-occupied houses and condos in Gonzales, California
- 0no bedroom
- 01 bedroom
- 512 bedrooms
- 4893 bedrooms
- 8054 bedrooms
- 405+ bedrooms

- Bedrooms in renter-occupied apartments in Gonzales, California
- 29no bedroom
- 1461 bedroom
- 5052 bedrooms
- 1523 bedrooms
- 1284 bedrooms
- 355+ bedrooms

- Cars and other vehicles available in Gonzales in owner-occupied houses/condos
- 55no vehicle
- 1791 vehicle
- 4362 vehicles
- 3553 vehicles
- 1714 vehicles
- 1905+ vehicles

- Cars and other vehicles available in Gonzales in renter-occupied apartments
- 12no vehicle
- 4671 vehicle
- 2872 vehicles
- 1313 vehicles
- 354 vehicles
- 635+ vehicles

- Rooms in owner-occupied houses in Gonzales, California
- 01 room
- 02 rooms
- 03 rooms
- 1254 rooms
- 3485 rooms
- 5756 rooms
- 1527 rooms
- 1218 rooms
- 649+ rooms

- Rooms in renter-occupied apartments in Gonzales, California
- 291 room
- 432 rooms
- 1333 rooms
- 4744 rooms
- 1425 rooms
- 1286 rooms
- 457 rooms
- 08 rooms
- 09+ rooms


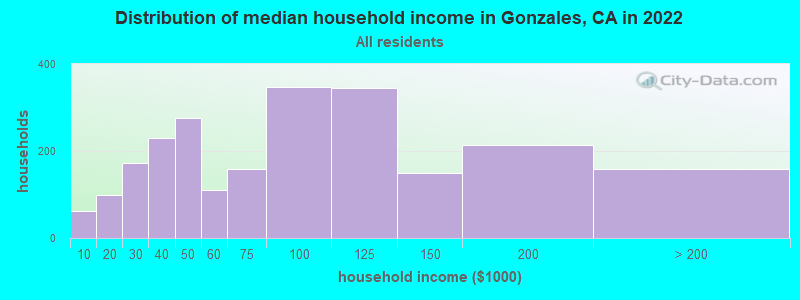
Gonzales, CA household income distribution

- 61Less than $10,000
- 99$10,000 to $19,999
- 172$20,000 to $29,999
- 230$30,000 to $39,999
- 277$40,000 to $49,999
- 111$50,000 to $59,999
- 158$60,000 to $74,999
- 347$75,000 to $99,999
- 345$100,000 to $124,999
- 149$125,000 to $149,999
- 213$150,000 to $199,999
- 158$200,000 or more
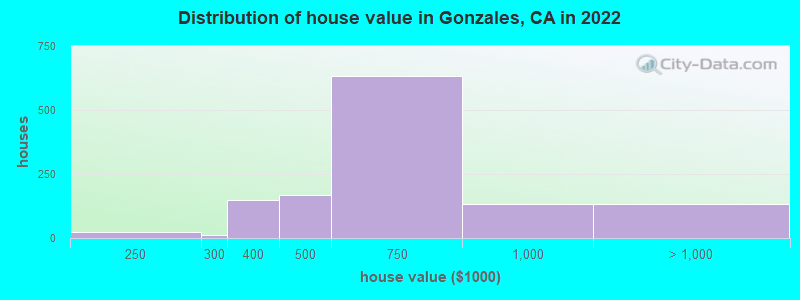
Home value of owner - occupied houses in 2022 in Gonzales, CA
-
- 25$200,000 to $249,999
- 12$250,000 to $299,999
- 150$300,000 to $399,999
- 167$400,000 to $499,999
- 634$500,000 to $749,999
- 131$750,000 to $999,999
- 54$1,000,000 to $1,499,999
- 79$1,500,000 to $1,999,999
Rent paid by renters in 2022 in Gonzales, CA
-
- 7$250 to $299
- 29$350 to $399
- 21$550 to $599
- 23$600 to $649
- 63$750 to $799
- 81$800 to $899
- 107$1,000 to $1,249
- 137$1,250 to $1,499
- 377$1,500 to $1,999
- 10$2,000 to $2,499
- 30$2,500 to $2,999
- 54No cash rent


Percentage of workers working in this county: 93.9%
Number of people working at home: 110 (3.0% of all workers)
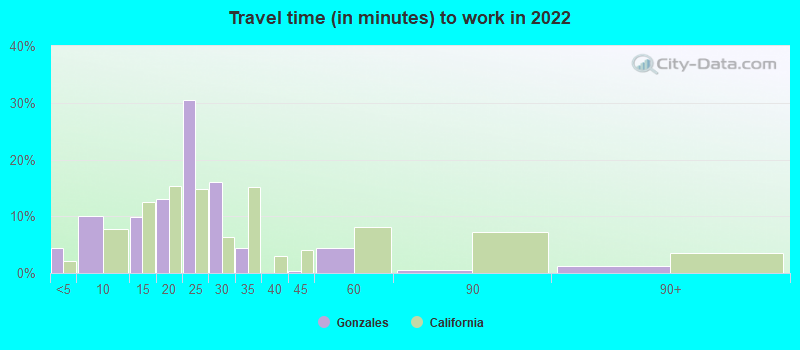
Travel time to work (commute)
- Less than 5 minutes: 0
- 5 to 9 minutes: 121
- 10 to 14 minutes: 245
- 15 to 19 minutes: 335
- 20 to 24 minutes: 1,396
- 25 to 29 minutes: 416
- 30 to 34 minutes: 341
- 35 to 39 minutes: 251
- 40 to 44 minutes: 212
- 45 to 59 minutes: 40
- 60 to 89 minutes: 65
- 90 or more minutes: 91
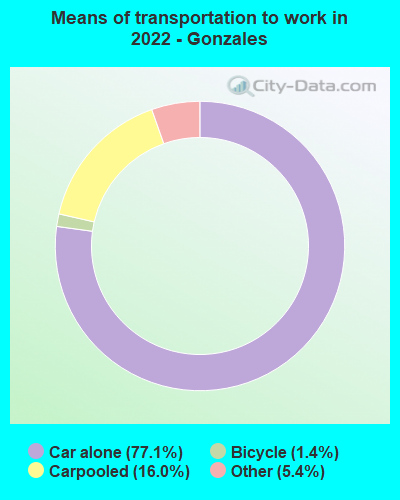
Means of transportation to work:
- Drove a car alone: 1,300 (71.4%)
- Carpooled: 244 (13.4%)
- Taxi: 71 (3.9%)
- Bicycle: 33 (1.8%)
- Worked at home: 110 (6.0%)

- Unemployment by race in 2022
- Unemployment rate for White non-Hispanic residents
- 11.2%Females
- Unemployment rate for American Indian and Alaska Native residents
- 54.8%Males
- Unemployment rate for other race residents
- 5.7%Females
- Unemployment rate for two or more race residents
- 7.5%Females
- Unemployment rate for Hispanic or Latino residents
- 2.1%Males
- 7.8%Females

- Year of entry for the foreign-born population in Gonzales, California
- 1872010 or later
- 3822000 to 2009
- 1,0411990 to 1999
- 7581980 to 1989
- 6631970 to 1979
- 461Before 1970

First ancestries reported:
- English: 122 (1.8%)
- Italian: 52 (0.8%)
- Irish: 41 (0.6%)
- Slovak: 34 (0.5%)
- Portuguese: 30 (0.4%)
- American: 27 (0.4%)
- Scottish: 26 (0.4%)
- Swiss: 26 (0.4%)
- German: 25 (0.4%)
- European: 9 (0.1%)
- Scotch-Irish: 8 (0.1%)
Most common places of birth for foreign-born residents (%):
| Gonzales: | 93.1% (2,515) |
| California: | 37.2% (3,881,193) |
| Gonzales: | 2.6% (70) |
| California: | 4.2% (440,287) |
Place of birth for U.S.-born residents:
- This state: 5,434
- Other state: 273
- Northeast: 24
- Midwest: 0
- South: 142
- West: 114
91.8% of Gonzales residents lived in the same house 1 years ago.
Out of people who lived in different houses, 45.3% lived in this county.
Out of people who lived in different counties, 36.9% lived in California.
| Gonzales: | 91.8% |
| State average: | 88.9% |
Education attainment for males 25 years and older:
- No schooling: 138
- Nursery to 4th grade: 157
- 5th and 6th grade: 224
- 7th and 8th grade: 58
- 9th grade: 199
- 10th grade: 0
- 11th grade: 87
- 12th grade, no diploma: 71
- High school graduate (or equivalency): 609
- Less than 1 year of college: 221
- Some college more than 1 year, no degree: 335
- Associate degree: 123
- Bachelor's degree: 42
- Master's degree: 120
- Professional school degree: 0
- Doctorate degree: 22

Education attainment for females 25 years and older:
- No schooling: 112
- Nursery to 4th grade: 98
- 5th and 6th grade: 352
- 7th and 8th grade: 54
- 9th grade: 222
- 10th grade: 90
- 11th grade: 36
- 12th grade, no diploma: 46
- High school graduate (or equivalency): 670
- Less than 1 year of college: 123
- Some college more than 1 year, no degree: 388
- Associate degree: 150
- Bachelor's degree: 165
- Master's degree: 57
- Professional school degree: 10
- Doctorate degree: 0


Housing units in structures:
- One, detached: 1,666
- One, attached: 136
- 3 or 4: 77
- 5 to 9: 263
- 10 to 19: 123
- 20 to 49: 40
- Mobile homes: 93
Housing units lacking complete kitchen facilities in 2022: 4.0%
House/condo owner moved in on average 16 years ago
Renter moved in on average 6 years ago

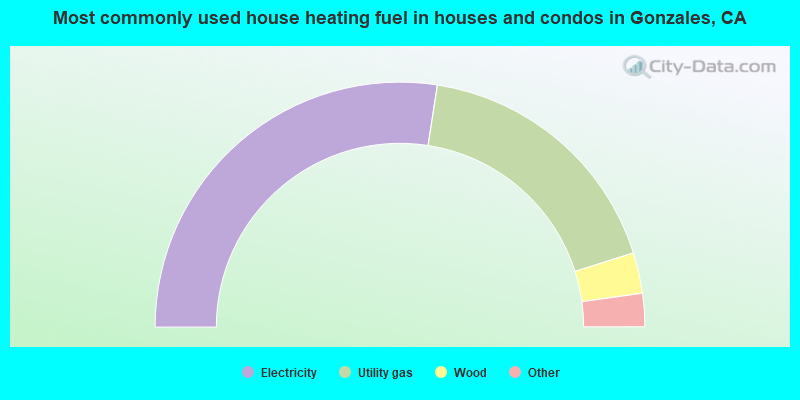
- 55.0%Electricity
- 35.4%Utility gas
- 5.4%Wood
- 1.9%Bottled, tank, or LP gas
- 1.4%No fuel used
- 0.9%Solar energy
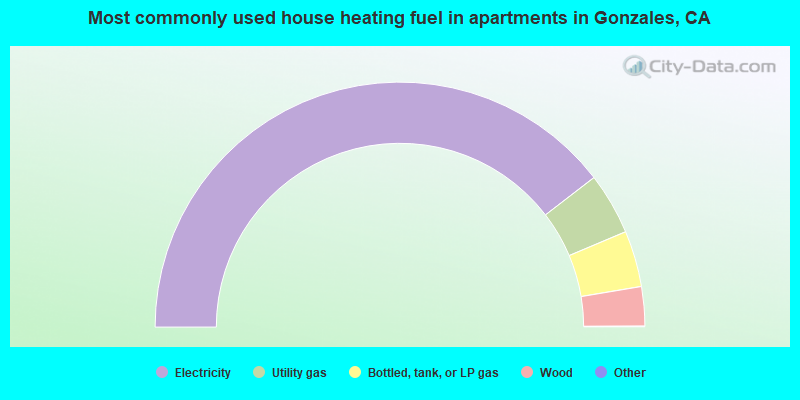
- 79.2%Electricity
- 8.2%Utility gas
- 7.4%Bottled, tank, or LP gas
- 5.2%Wood
Private vs. public school enrollment:
| Here: | 0.0% |
| California: | 10.5% |
| Here: | 6.9% |
| California: | 8.5% |
| Here: | 1.5% |
| California: | 15.9% |


