Grant, MI (Michigan) Houses and Residents
| Grant: | $174,744 |
| Michigan: | $224,400 |
Mean price in 2022:
Detached houses: $184,035
Here: $184,035 State: $280,038 Townhouses or other attached units: $153,216
Here: $153,216 State: $239,520 Mobile homes: $34,407
Here: $34,407 State: $72,868
Total population: 881 (Urban population: 0, Rural population: 911 (all nonfarm))
Houses: 488 (457 occupied: 279 owner occupied, 184 renter occupied)
| % of renters here: | 40% |
| State: | 27% |
Housing density: 748 houses/condos per square mile
Median price asked for vacant for-sale houses and condos in 2022 in this county: $104,017.
Median contract rent in 2022: $748 (lower quartile is $352, upper quartile is $994)
Median rent asked for vacant for-rent units in 2022: $2,206
Median gross rent in Grant, MI in 2022: $809
Housing units in Grant with a mortgage: 178 (10 second mortgage, 0 home equity loan, 8 both second mortgage and home equity loan)
Houses without a mortgage: 0
Median household income for houses/condos with a mortgage: $82,477
Median household income for apartments without a mortgage: $40,765
Median monthly housing costs: $906
Compare current foreclosures near Grant, MI:
| Photo | Address | Area | Beds / Baths | Price | Details |
|---|---|---|---|---|---|

|
#1
Willow Ave
Grant, MI 49327
|
- sq. feet
|
2 baths 3 beds |
show details | |

|
#2
Lincoln St
Grant, MI 49327
|
1,646 sq. feet
|
2 baths 3 beds |
show details | |

|
#3
Exchange St
Grant, MI 49327
|
- sq. feet
|
2 baths 2 beds |
show details | |

|
#4
E 136th St
Grant, MI 49327
|
- sq. feet
|
- baths - beds |
show details | |

|
#5
W 112th St
Grant, MI 49327
|
- sq. feet
|
- baths - beds |
show details | |

|
#6
W 116th St
Grant, MI 49327
|
- sq. feet
|
- baths - beds |
show details | |

|
#7
W 136th St
Grant, MI 49327
|
- sq. feet
|
- baths - beds |
show details | |

|
#8
S Lake St
Grant, MI 49327
|
- sq. feet
|
- baths - beds |
show details | |

|
#9
Spruce Ave
Grant, MI 49327
|
- sq. feet
|
- baths - beds |
show details | |

|
#10
E 88th St
Newaygo, MI 49337
|
1,500 sq. feet
|
2 baths 3 beds |
show details |
| Photo | Address | Area | Beds / Baths | Price | Details |
|---|---|---|---|---|---|

|
#11
Almy Rd
Howard City, MI 49329
|
1,352 sq. feet
|
2 baths 3 beds |
show details | |

|
#12
Holton Duck Lake Rd
Holton, MI 49425
|
1,447 sq. feet
|
1 baths 3 beds |
show details | |

|
#13
Prairie Run Dr
Cedar Springs, MI 49319
|
1,613 sq. feet
|
2 baths 2 beds |
show details | |

|
#14
Ritchie Ave
Sand Lake, MI 49343
|
1,097 sq. feet
|
2 baths 3 beds |
show details | |

|
#15
E 8th St
White Cloud, MI 49349
|
2,200 sq. feet
|
2 baths 6 beds |
show details | |

|
#16
Bolen Rd
Muskegon, MI 49442
|
1,158 sq. feet
|
1 baths 3 beds |
show details | |

|
#17
Main St
Newaygo, MI 49337
|
1,380 sq. feet
|
1 baths 3 beds |
show details | |

|
#18
Ellis Rd
Ravenna, MI 49451
|
1,872 sq. feet
|
1 baths 3 beds |
show details | |

|
#19
Oak Ave
Twin Lake, MI 49457
|
1,196 sq. feet
|
1 baths 3 beds |
show details | |

|
#20
S Croton Hardy Dr
Newaygo, MI 49337
|
- sq. feet
|
1 baths 1 beds |
show details |
| Photo | Address | Area | Beds / Baths | Price | Details |
|---|---|---|---|---|---|

|
#21
N Kenwood St
Muskegon, MI 49442
|
1,308 sq. feet
|
1 baths 3 beds |
show details | |

|
#22
Prospect St
Sparta, MI 49345
|
- sq. feet
|
1 baths 4 beds |
show details | |

|
#23
Shaw Rd
Bailey, MI 49303
|
1,384 sq. feet
|
1 baths - beds |
show details | |

|
#24
Bailey Rd
Ravenna, MI 49451
|
1,716 sq. feet
|
1 baths - beds |
show details | |

|
#25
Hall Rd
Muskegon, MI 49442
|
1,056 sq. feet
|
1 baths - beds |
show details | |

|
#26
Northland Dr # 7
Sand Lake, MI 49343
|
- sq. feet
|
- baths - beds |
show details | |

|
#27
Allen
Cedar Springs, MI 49319
|
- sq. feet
|
- baths - beds |
show details | |

|
#28
Lilyfield
Cedar Springs, MI 49319
|
- sq. feet
|
- baths - beds |
show details | |

|
#29
Holton Duck Lake Rd
Holton, MI 49425
|
- sq. feet
|
- baths - beds |
show details | |

|
#30
S Tall Pine Trl
Newaygo, MI 49337
|
- sq. feet
|
- baths - beds |
show details |
| Photo | Address | Area | Beds / Baths | Price | Details |
|---|---|---|---|---|---|

|
#31
Hemlock Ave
Cedar Springs, MI 49319
|
- sq. feet
|
- baths - beds |
show details | |

|
#32
Ida Red Ave Apt 107
Sparta, MI 49345
|
- sq. feet
|
- baths - beds |
show details | |

|
#33
Winston View Dr NE
Cedar Springs, MI 49319
|
- sq. feet
|
- baths - beds |
show details | |

|
#34
Wagonwheel Ct NE
Cedar Springs, MI 49319
|
- sq. feet
|
- baths - beds |
show details | |

|
#35
Ida Red Ave Apt 102
Sparta, MI 49345
|
- sq. feet
|
- baths - beds |
show details | |

|
#36
Red Pine St
Sparta, MI 49345
|
- sq. feet
|
- baths - beds |
show details | |

|
#37
Chary Ln
Sparta, MI 49345
|
- sq. feet
|
- baths - beds |
show details | |

|
#38
18 Mile Rd NE
Cedar Springs, MI 49319
|
- sq. feet
|
- baths - beds |
show details | |

|
#39
Chary Glen Dr
Kent City, MI 49330
|
- sq. feet
|
- baths - beds |
show details | |

|
#40
Ward St
Holton, MI 49425
|
- sq. feet
|
- baths - beds |
show details |
| Photo | Address | Area | Beds / Baths | Price | Details |
|---|---|---|---|---|---|

|
#41
Edgerton Ave
Cedar Springs, MI 49319
|
- sq. feet
|
- baths - beds |
show details | |

|
#42
Country View Dr
Sparta, MI 49345
|
- sq. feet
|
- baths - beds |
show details | |

|
#43
Ironwood Rd
Ravenna, MI 49451
|
- sq. feet
|
- baths - beds |
show details | |

|
#44
Dusk Ave
Sparta, MI 49345
|
- sq. feet
|
- baths - beds |
show details | |

|
#45
Kentridge Dr Apt A3
Kent City, MI 49330
|
- sq. feet
|
- baths - beds |
show details | |

|
#46
W Main St Apt 2
Fremont, MI 49412
|
- sq. feet
|
- baths - beds |
show details | |

|
#47
Maple Island Rd
Twin Lake, MI 49457
|
- sq. feet
|
- baths - beds |
show details | |

|
#48
N Darling Ave
Fremont, MI 49412
|
- sq. feet
|
- baths - beds |
show details | |

|
#49
Cottage Grove Ave
Fremont, MI 49412
|
- sq. feet
|
- baths - beds |
show details | |

|
Check over 1 million property listings on Foreclosure.com!
|
browse all offers | |||

Latest news about housing in Grant, MI collected exclusively by city-data.com from local newspapers, TV, and radio stations

 | U.S. Grant house at Michigan State fairgrounds (3 replies) |
| Go East... and become homeless (154 replies) |
| Free tuition for All Detroit students by WSU (17 replies) |
| Women's Cancer Fund, Clawson, MI (16 replies) |
| Grosse Pointe Park Student Grant (9 replies) |
| Birmingham and the snob factor............ (41 replies) |

Median year apartment built: 1989
Household type by relationship:
Households: 1,343- Male householders: 177 (25 living alone), Female householders: 276 (143 living alone)
138 spouses (138 opposite-sex spouses), 38 unmarried partners, (38 opposite-sex unmarried partners), 340 children (307 natural, 13 adopted, 18 stepchildren), 32 grandchildren, 24 brothers or sisters, 16 parents, 0 foster children, 30 other relatives, 263 non-relatives
- In group quarters: 2
Size of family households: 78 2-persons, 64 3-persons, 66 4-persons, 26 5-persons, 24 7-or-more-persons.
Size of nonfamily households: 176 1-person, 16 2-persons, 11 7-or-more-persons.
144 married couples with children.
140 single-parent households (40 men, 100 women).
87.7% of residents of Grant speak English at home.
12.5% of residents speak Spanish at home (81% speak English very well, 12% speak English well, 7% speak English not well).
0.7% of residents speak other language at home (100% speak English not well).
Foreign born population: 41 (3.1%)
(2.4% of them are naturalized citizens)
| Here: | 6.1 |
| State: | 6.5 |
| Here: | 3.3 |
| State: | 4.3 |

- Bedrooms in owner-occupied houses and condos in Grant, Michigan
- 0no bedroom
- 51 bedroom
- 372 bedrooms
- 1603 bedrooms
- 684 bedrooms
- 95+ bedrooms

- Bedrooms in renter-occupied apartments in Grant, Michigan
- 44no bedroom
- 471 bedroom
- 562 bedrooms
- 243 bedrooms
- 54 bedrooms
- 85+ bedrooms

- Cars and other vehicles available in Grant in owner-occupied houses/condos
- 10no vehicle
- 931 vehicle
- 1142 vehicles
- 383 vehicles
- 174 vehicles
- 75+ vehicles

- Cars and other vehicles available in Grant in renter-occupied apartments
- 48no vehicle
- 741 vehicle
- 462 vehicles
- 163 vehicles
- 04 vehicles
- 05+ vehicles

- Rooms in owner-occupied houses in Grant, Michigan
- 01 room
- 02 rooms
- 03 rooms
- 534 rooms
- 485 rooms
- 636 rooms
- 577 rooms
- 318 rooms
- 289+ rooms

- Rooms in renter-occupied apartments in Grant, Michigan
- 441 room
- 52 rooms
- 463 rooms
- 564 rooms
- 35 rooms
- 86 rooms
- 107 rooms
- 68 rooms
- 69+ rooms


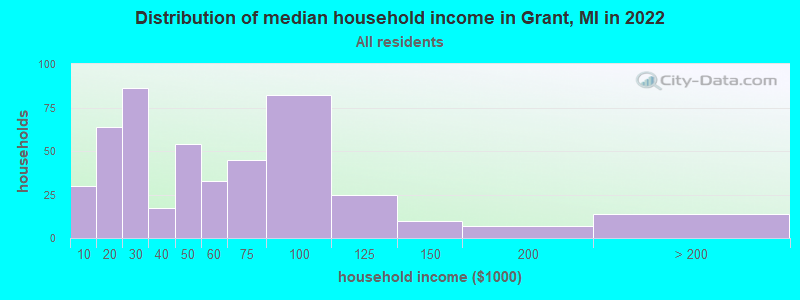
Grant, MI household income distribution

- 30Less than $10,000
- 64$10,000 to $19,999
- 86$20,000 to $29,999
- 17$30,000 to $39,999
- 54$40,000 to $49,999
- 33$50,000 to $59,999
- 45$60,000 to $74,999
- 82$75,000 to $99,999
- 25$100,000 to $124,999
- 10$125,000 to $149,999
- 7$150,000 to $199,999
- 14$200,000 or more
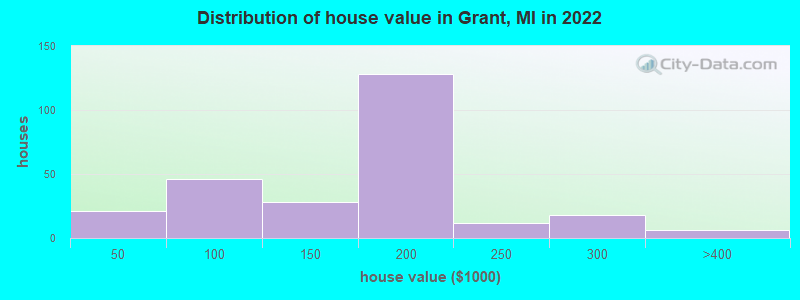
Home value of owner - occupied houses in 2022 in Grant, MI
-
- 2Less than $10,000
- 9$10,000 to $14,999
- 4$20,000 to $24,999
- 3$25,000 to $29,999
- 3$50,000 to $59,999
- 1$60,000 to $69,999
- 12$70,000 to $79,999
- 12$80,000 to $89,999
- 15$90,000 to $99,999
- 12$100,000 to $124,999
- 14$125,000 to $149,999
- 97$150,000 to $174,999
- 30$175,000 to $199,999
- 11$200,000 to $249,999
- 17$250,000 to $299,999
- 6$300,000 to $399,999
Rent paid by renters in 2022 in Grant, MI
-
- 22$200 to $249
- 18$300 to $349
- 1$350 to $399
- 8$400 to $449
- 8$500 to $549
- 1$550 to $599
- 2$600 to $649
- 2$650 to $699
- 15$700 to $749
- 6$750 to $799
- 13$800 to $899
- 15$900 to $999
- 21$1,000 to $1,249
- 7$3,500 or more
- 37No cash rent


Percentage of workers working in this county: 45.1%
Number of people working at home: 57 (12.5% of all workers)
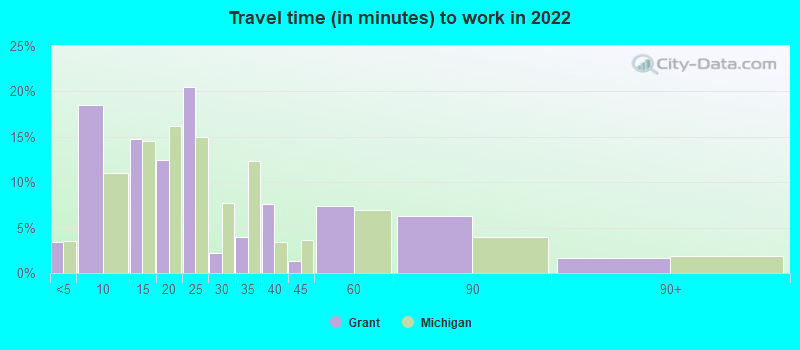
Travel time to work (commute)
- Less than 5 minutes: 28
- 5 to 9 minutes: 24
- 10 to 14 minutes: 34
- 15 to 19 minutes: 44
- 20 to 24 minutes: 70
- 25 to 29 minutes: 28
- 30 to 34 minutes: 13
- 35 to 39 minutes: 22
- 40 to 44 minutes: 8
- 45 to 59 minutes: 57
- 60 to 89 minutes: 43
- 90 or more minutes: 21
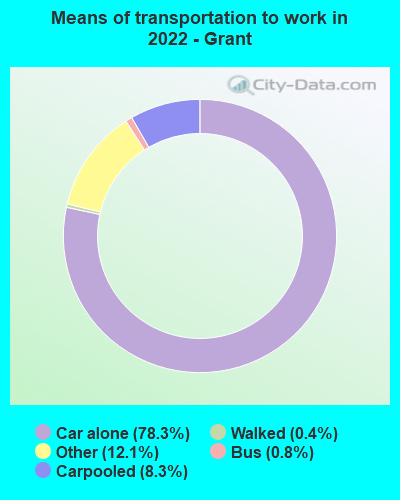
Means of transportation to work:
- Drove a car alone: 569 (71.1%)
- Carpooled: 61 (7.6%)
- Bus: 4 (0.5%)
- Taxi: 109 (13.6%)
- Walked: 2 (0.2%)
- Worked at home: 57 (7.1%)

- Unemployment by race in 2022
- Unemployment rate for White non-Hispanic residents
- 14.7%Males
- 2.3%Females
- Unemployment rate for two or more race residents
- 24.6%Males
- Unemployment rate for Hispanic or Latino residents
- 7.9%Males
- 23.0%Females

- Year of entry for the foreign-born population in Grant, Michigan
- 92010 or later
- 112000 to 2009
- 191990 to 1999
- 121980 to 1989
- 41970 to 1979
- 0Before 1970

First ancestries reported:
- German: 85 (18.9%)
- American: 36 (8.0%)
- English: 36 (8.0%)
- Irish: 29 (6.4%)
- Dutch: 18 (4.0%)
- Polish: 17 (3.8%)
- French: 15 (3.3%)
- Swedish: 5 (1.1%)
- Australian: 4 (0.9%)
- Scottish: 4 (0.9%)
- Danish: 2 (0.4%)
- Northern European: 1 (0.2%)
Most common places of birth for foreign-born residents (%):
| Grant: | 48.8% (20) |
| Michigan: | 10.9% (75,965) |
| Grant: | 26.8% (11) |
| Michigan: | 1.0% (7,097) |
| Grant: | 12.2% (5) |
| Michigan: | 0.5% (3,489) |
Place of birth for U.S.-born residents:
- This state: 1,162
- Other state: 132
- Northeast: 2
- Midwest: 60
- South: 46
- West: 22
89.9% of Grant residents lived in the same house 1 years ago.
Out of people who lived in different houses, 32.5% lived in this county.
Out of people who lived in different counties, 89.6% lived in Michigan.
| Grant: | 89.9% |
| State average: | 88.4% |
Education attainment for males 25 years and older:
- No schooling: 10
- Nursery to 4th grade: 4
- 5th and 6th grade: 8
- 7th and 8th grade: 1
- 9th grade: 2
- 10th grade: 0
- 11th grade: 9
- 12th grade, no diploma: 21
- High school graduate (or equivalency): 155
- Less than 1 year of college: 29
- Some college more than 1 year, no degree: 20
- Associate degree: 34
- Bachelor's degree: 27
- Master's degree: 2
- Professional school degree: 1
- Doctorate degree: 0

Education attainment for females 25 years and older:
- No schooling: 0
- Nursery to 4th grade: 0
- 5th and 6th grade: 0
- 7th and 8th grade: 4
- 9th grade: 0
- 10th grade: 12
- 11th grade: 22
- 12th grade, no diploma: 5
- High school graduate (or equivalency): 271
- Less than 1 year of college: 33
- Some college more than 1 year, no degree: 51
- Associate degree: 51
- Bachelor's degree: 33
- Master's degree: 11
- Professional school degree: 0
- Doctorate degree: 3


Housing units in structures:
- One, detached: 258
- One, attached: 21
- Two: 17
- 3 or 4: 25
- 5 to 9: 22
- 10 to 19: 24
- 20 to 49: 43
- 50 or more: 19
- Mobile homes: 58
Median worth of mobile homes: $189,361
House/condo owner moved in on average 8 years ago
Renter moved in on average 5 years ago

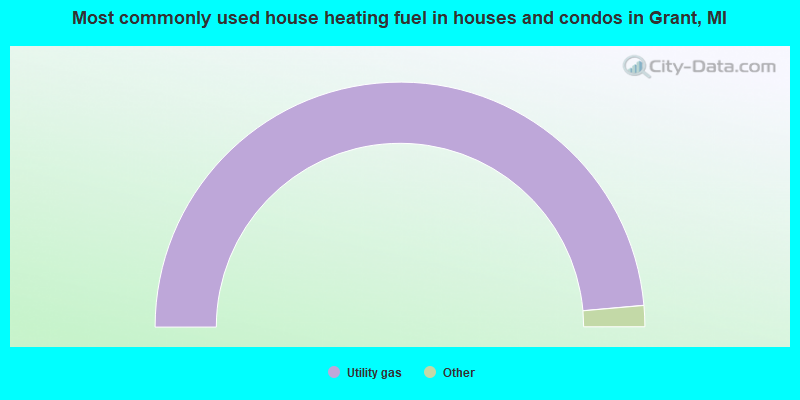
- 97.4%Utility gas
- 1.1%Wood
- 0.7%Bottled, tank, or LP gas
- 0.7%Electricity
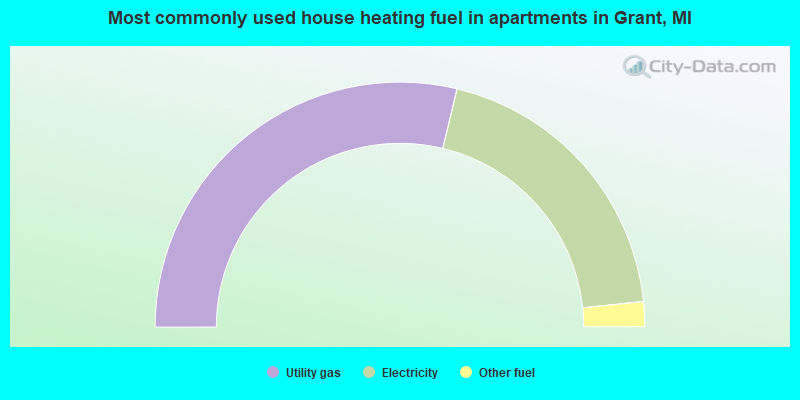
- 57.5%Utility gas
- 39.2%Electricity
- 3.3%Other fuel
Private vs. public school enrollment:
| Here: | 9.1% |
| Michigan: | 12.4% |
| Here: | 0.0% |
| Michigan: | 9.8% |
| Here: | 38.1% |
| Michigan: | 14.9% |


