Grant Park, IL (Illinois) Houses and Residents
| Grant Park: | $202,552 |
| Illinois: | $251,600 |
Mean price in 2022:
Detached houses: $214,153
Here: $214,153 State: $310,164 Townhouses or other attached units: $259,606
Here: $259,606 State: $286,230
Total population: 1,299 (Urban population: 0, Rural population: 1,381 (all nonfarm))
Houses: 498 (490 occupied: 357 owner occupied, 130 renter occupied)
| % of renters here: | 27% |
| State: | 33% |
Housing density: 805 houses/condos per square mile
Median price asked for vacant for-sale houses and condos in 2022 in this county: $115,283.
Median contract rent in 2022: $803 (lower quartile is $689, upper quartile is $1,188)
Median rent asked for vacant for-rent units in 2022: $742
Median gross rent in Grant Park, IL in 2022: $1,062
Housing units in Grant Park with a mortgage: 209 (20 second mortgage, 0 home equity loan, 13 both second mortgage and home equity loan)
Houses without a mortgage: 6
Median household income for houses/condos with a mortgage: $100,106
Median household income for apartments without a mortgage: $63,124
Median monthly housing costs: $1,144
Compare current foreclosures near Grant Park, IL:
| Photo | Address | Area | Beds / Baths | Price | Details |
|---|---|---|---|---|---|

|
#1
W Taylor St
Grant Park, IL 60940
|
- sq. feet
|
- baths - beds |
show details | |

|
#2
Richton Rd
Steger, IL 60475
|
1,400 sq. feet
|
1 baths 3 beds |
$209,900
|
show details |

|
#3
Hemlock St
Park Forest, IL 60466
|
1,000 sq. feet
|
1 baths 2 beds |
$85,000
|
show details |

|
#4
Peoria St
Steger, IL 60475
|
616 sq. feet
|
1 baths 2 beds |
$78,500
|
show details |

|
#5
Jordan Dr
Bourbonnais, IL 60914
|
936 sq. feet
|
1 baths 3 beds |
$187,000
|
show details |

|
#6
S Cleveland Ave
Bradley, IL 60915
|
1,200 sq. feet
|
1 baths 2 beds |
$103,900
|
show details |

|
#7
E 12000n Rd
Grant Park, IL 60940
|
- sq. feet
|
- baths - beds |
show details | |

|
#8
E 12000n Rd
Grant Park, IL 60940
|
- sq. feet
|
- baths - beds |
show details | |

|
#9
Greenwood Ct
Grant Park, IL 60940
|
- sq. feet
|
- baths - beds |
show details | |

|
#10
E 12000n Rd
Grant Park, IL 60940
|
- sq. feet
|
- baths - beds |
show details |
| Photo | Address | Area | Beds / Baths | Price | Details |
|---|---|---|---|---|---|

|
#11
Heather Rd E
Bourbonnais, IL 60914
|
- sq. feet
|
2 baths 3 beds |
$297,400
|
show details |

|
#12
Peoria St
Steger, IL 60475
|
1,518 sq. feet
|
2 baths 4 beds |
show details | |

|
#13
State St
Steger, IL 60475
|
1,868 sq. feet
|
3 baths 5 beds |
show details | |

|
#14
S 4th Ave
Kankakee, IL 60901
|
- sq. feet
|
1 baths 2 beds |
show details | |

|
#15
Somerset St
Crete, IL 60417
|
1,625 sq. feet
|
1 baths 3 beds |
show details | |

|
#16
Dewey Ave
Richton Park, IL 60471
|
2,421 sq. feet
|
2 baths 3 beds |
show details | |

|
#17
Mohawk St
Park Forest, IL 60466
|
949 sq. feet
|
1 baths 2 beds |
show details | |

|
#18
W 136th Pl
Cedar Lake, IN 46303
|
2,408 sq. feet
|
2 baths 4 beds |
show details | |

|
#19
S Douglas Ave
Bradley, IL 60915
|
852 sq. feet
|
1 baths 3 beds |
show details | |

|
#20
W Vanmeter St
Kankakee, IL 60901
|
1,771 sq. feet
|
2 baths 3 beds |
show details |
| Photo | Address | Area | Beds / Baths | Price | Details |
|---|---|---|---|---|---|

|
#21
Lincoln St
Crete, IL 60417
|
468 sq. feet
|
1 baths 1 beds |
show details | |

|
#22
W 139th Ct
Cedar Lake, IN 46303
|
1,800 sq. feet
|
2 baths 4 beds |
show details | |

|
#23
E Timberline Ct
Crete, IL 60417
|
3,702 sq. feet
|
3 baths 5 beds |
show details | |

|
#24
Mohawk St
Park Forest, IL 60466
|
1,141 sq. feet
|
1 baths 3 beds |
show details | |

|
#25
Michael Rd
Park Forest, IL 60466
|
1,200 sq. feet
|
1 baths 2 beds |
show details | |

|
#26
Gloucester Dr
Crete, IL 60417
|
4,397 sq. feet
|
4 baths 4 beds |
show details | |

|
#27
S Curtis Ave
Kankakee, IL 60901
|
1,210 sq. feet
|
2 baths 4 beds |
show details | |

|
#28
Orchard Ln
Beecher, IL 60401
|
1,600 sq. feet
|
2 baths 3 beds |
show details | |

|
#29
E Richton Rd
Crete, IL 60417
|
3,050 sq. feet
|
3 baths 4 beds |
show details | |

|
#30
W River St
Bourbonnais, IL 60914
|
2,136 sq. feet
|
2 baths 4 beds |
show details |
| Photo | Address | Area | Beds / Baths | Price | Details |
|---|---|---|---|---|---|

|
#31
S Small Ave
Kankakee, IL 60901
|
1,020 sq. feet
|
1 baths 2 beds |
show details | |

|
#32
S Ashland Ave
Crete, IL 60417
|
2,636 sq. feet
|
3 baths 3 beds |
show details | |

|
#33
N Liberty St
Lowell, IN 46356
|
2,548 sq. feet
|
1 baths 3 beds |
show details | |

|
#34
Southview Dr
Lowell, IN 46356
|
1,008 sq. feet
|
1 baths 3 beds |
show details | |

|
#35
Maple St
Lowell, IN 46356
|
1,504 sq. feet
|
1 baths 3 beds |
show details | |

|
#36
Meadow Ln
Lowell, IN 46356
|
1,056 sq. feet
|
1 baths 3 beds |
show details | |

|
#37
Seminole Dr
Lowell, IN 46356
|
1,508 sq. feet
|
2 baths 3 beds |
show details | |

|
#38
W Cardinal Ct
Monee, IL 60449
|
- sq. feet
|
3 baths 4 beds |
show details | |

|
#39
Burrwood Ct
Lowell, IN 46356
|
864 sq. feet
|
2 baths 4 beds |
show details | |

|
#40
Cardinal Ln
Lowell, IN 46356
|
1,120 sq. feet
|
1 baths 3 beds |
show details |
| Photo | Address | Area | Beds / Baths | Price | Details |
|---|---|---|---|---|---|

|
#41
Canary Ln
Lowell, IN 46356
|
1,232 sq. feet
|
1 baths 4 beds |
show details | |

|
#42
Elm St
Lowell, IN 46356
|
1,924 sq. feet
|
1 baths 3 beds |
show details | |

|
#43
Dakota Dr
Lowell, IN 46356
|
1,344 sq. feet
|
2 baths 3 beds |
show details | |

|
#44
Blackwood Dr
Lowell, IN 46356
|
1,968 sq. feet
|
1 baths 3 beds |
show details | |

|
#45
Sheffield Ave
Dyer, IN 46311
|
1,574 sq. feet
|
1 baths 3 beds |
show details | |

|
#46
Northcote Ave
Saint John, IN 46373
|
2,268 sq. feet
|
2 baths 3 beds |
show details | |

|
#47
Hoshaw St
Lowell, IN 46356
|
2,780 sq. feet
|
2 baths 3 beds |
show details | |

|
#48
Parkwood Dr
Lowell, IN 46356
|
2,392 sq. feet
|
1 baths 3 beds |
show details | |

|
#49
W 147th Ave
Cedar Lake, IN 46303
|
1,368 sq. feet
|
2 baths 3 beds |
show details | |

|
Check over 1 million property listings on Foreclosure.com!
|
browse all offers | |||


 | What is the best way to find a rental home? (3 replies) |
| Is Kankakee a bad area to live in? (66 replies) |
| What is great about the Chicago area? Positive Posters!!! (55 replies) |
| Hinsdale Vs. Glencoe (83 replies) |
| Work in Riverwoods and Naperville - Where to live? (11 replies) |
| Could use some help figuring out where to live (8 replies) |

Median year apartment built: 1967
Household type by relationship:
Households: 1,620- Male householders: 262 (53 living alone), Female householders: 220 (73 living alone)
289 spouses (289 opposite-sex spouses), 12 unmarried partners, (12 opposite-sex unmarried partners), 468 children (402 natural, 0 adopted, 65 stepchildren), 294 grandchildren, 0 brothers or sisters, 7 parents, 0 foster children, 6 other relatives, 47 non-relatives
- In group quarters: 10
Size of family households: 123 2-persons, 87 3-persons, 55 4-persons, 67 5-persons, 5 6-persons, 15 7-or-more-persons.
Size of nonfamily households: 126 1-person, 5 2-persons.
199 married couples with children.
85 single-parent households (13 men, 72 women).
96.8% of residents of Grant Park speak English at home.
1.3% of residents speak Spanish at home (63% speak English very well, 37% speak English well).
1.5% of residents speak other Indo-European language at home (73% speak English very well, 23% speak English well, 5% speak English not well).
Foreign born population: 11 (0.7%)
(90.9% of them are naturalized citizens)
| Here: | 6.8 |
| State: | 6.4 |
| Here: | 4.2 |
| State: | 4.1 |

- Bedrooms in owner-occupied houses and condos in Grant Park, Illinois
- 0no bedroom
- 21 bedroom
- 742 bedrooms
- 1843 bedrooms
- 844 bedrooms
- 145+ bedrooms

- Bedrooms in renter-occupied apartments in Grant Park, Illinois
- 28no bedroom
- 31 bedroom
- 692 bedrooms
- 313 bedrooms
- 04 bedrooms
- 05+ bedrooms

- Cars and other vehicles available in Grant Park in owner-occupied houses/condos
- 11no vehicle
- 941 vehicle
- 1092 vehicles
- 983 vehicles
- 424 vehicles
- 45+ vehicles
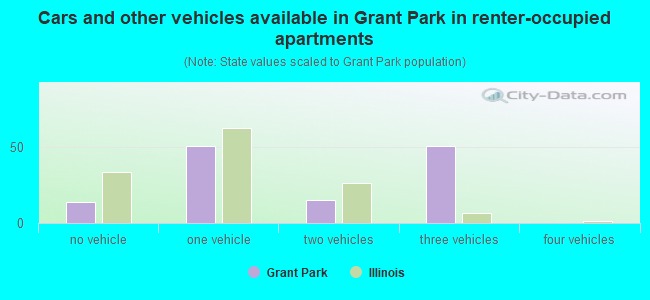
- Cars and other vehicles available in Grant Park in renter-occupied apartments
- 14no vehicle
- 511 vehicle
- 152 vehicles
- 513 vehicles
- 04 vehicles
- 05+ vehicles

- Rooms in owner-occupied houses in Grant Park, Illinois
- 01 room
- 02 rooms
- 03 rooms
- 284 rooms
- 635 rooms
- 896 rooms
- 707 rooms
- 448 rooms
- 649+ rooms

- Rooms in renter-occupied apartments in Grant Park, Illinois
- 01 room
- 02 rooms
- 343 rooms
- 414 rooms
- 325 rooms
- 156 rooms
- 07 rooms
- 98 rooms
- 09+ rooms


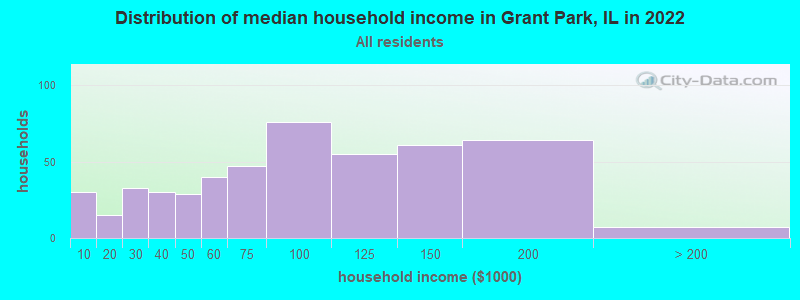
Grant Park, IL household income distribution

- 30Less than $10,000
- 15$10,000 to $19,999
- 33$20,000 to $29,999
- 30$30,000 to $39,999
- 29$40,000 to $49,999
- 40$50,000 to $59,999
- 47$60,000 to $74,999
- 76$75,000 to $99,999
- 55$100,000 to $124,999
- 61$125,000 to $149,999
- 64$150,000 to $199,999
- 7$200,000 or more
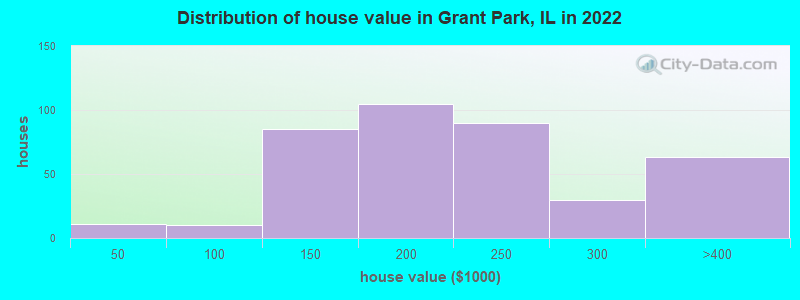
Home value of owner - occupied houses in 2022 in Grant Park, IL
-
- 1$15,000 to $19,999
- 9$20,000 to $24,999
- 4$50,000 to $59,999
- 2$70,000 to $79,999
- 2$90,000 to $99,999
- 36$100,000 to $124,999
- 48$125,000 to $149,999
- 67$150,000 to $174,999
- 37$175,000 to $199,999
- 89$200,000 to $249,999
- 30$250,000 to $299,999
- 61$300,000 to $399,999
- 0$400,000 to $499,999
Rent paid by renters in 2022 in Grant Park, IL
-
- 5$350 to $399
- 10$550 to $599
- 4$600 to $649
- 5$650 to $699
- 13$700 to $749
- 10$750 to $799
- 15$800 to $899
- 3$900 to $999
- 15$1,000 to $1,249
- 23$1,250 to $1,499


Percentage of workers working in this county: 64.9%
Number of people working at home: 46 (7.7% of all workers)
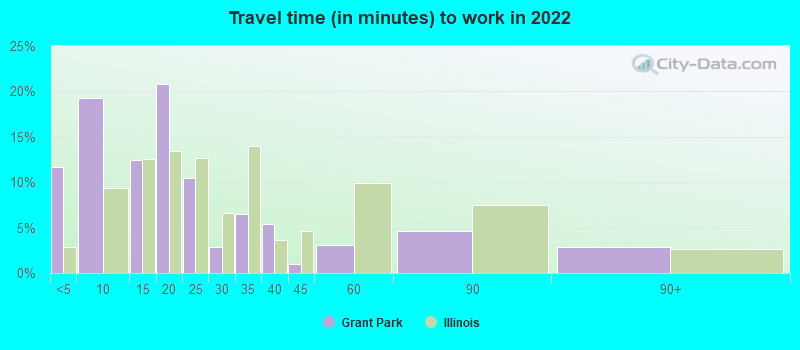
Travel time to work (commute)
- Less than 5 minutes: 29
- 5 to 9 minutes: 11
- 10 to 14 minutes: 38
- 15 to 19 minutes: 43
- 20 to 24 minutes: 51
- 25 to 29 minutes: 75
- 30 to 34 minutes: 181
- 35 to 39 minutes: 13
- 40 to 44 minutes: 2
- 45 to 59 minutes: 66
- 60 to 89 minutes: 35
- 90 or more minutes: 12
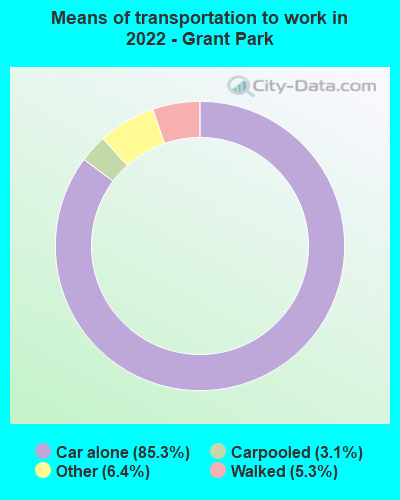
Means of transportation to work:
- Drove a car alone: 385 (78.6%)
- Carpooled: 9 (1.8%)
- Taxi: 27 (5.5%)
- Walked: 38 (7.8%)
- Worked at home: 46 (9.4%)

- Unemployment by race in 2022
- Unemployment rate for White non-Hispanic residents
- 9.6%Males
- 2.9%Females
- Unemployment rate for other race residents
- 53.9%Males
- Unemployment rate for two or more race residents
- 28.2%Males
- Unemployment rate for Hispanic or Latino residents
- 16.3%Males
- 14.0%Females
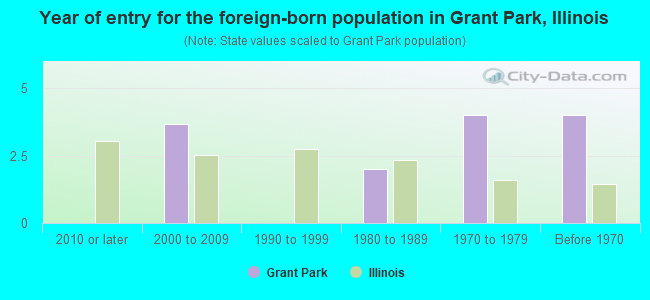
- Year of entry for the foreign-born population in Grant Park, Illinois
- 02010 or later
- 42000 to 2009
- 01990 to 1999
- 21980 to 1989
- 41970 to 1979
- 4Before 1970
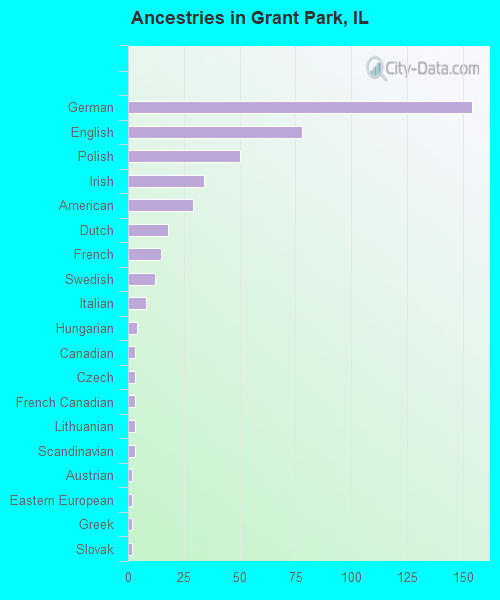
First ancestries reported:
- German: 154 (33.8%)
- English: 78 (17.1%)
- Polish: 50 (11.0%)
- Irish: 34 (7.5%)
- American: 29 (6.4%)
- Dutch: 18 (4.0%)
- French: 15 (3.3%)
- Swedish: 12 (2.6%)
- Italian: 8 (1.8%)
- Hungarian: 4 (0.9%)
- Canadian: 3 (0.7%)
- Czech: 3 (0.7%)
- French Canadian: 3 (0.7%)
- Lithuanian: 3 (0.7%)
- Scandinavian: 3 (0.7%)
- Austrian: 2 (0.4%)
- Eastern European: 2 (0.4%)
- Greek: 2 (0.4%)
- Slovak: 2 (0.4%)
Most common places of birth for foreign-born residents (%):
| Grant Park: | 61.5% (8) |
| Illinois: | 34.7% (626,958) |
| Grant Park: | 23.1% (3) |
| Illinois: | 6.9% (124,474) |
Place of birth for U.S.-born residents:
- This state: 1,426
- Other state: 195
- Northeast: 48
- Midwest: 81
- South: 21
- West: 33
94.7% of Grant Park residents lived in the same house 1 years ago.
Out of people who lived in different houses, 23.9% lived in this county.
Out of people who lived in different counties, 89.8% lived in Illinois.
| Grant Park: | 94.7% |
| State average: | 88.3% |
Education attainment for males 25 years and older:
- No schooling: 9
- Nursery to 4th grade: 0
- 5th and 6th grade: 0
- 7th and 8th grade: 7
- 9th grade: 8
- 10th grade: 17
- 11th grade: 0
- 12th grade, no diploma: 2
- High school graduate (or equivalency): 176
- Less than 1 year of college: 26
- Some college more than 1 year, no degree: 131
- Associate degree: 33
- Bachelor's degree: 49
- Master's degree: 7
- Professional school degree: 0
- Doctorate degree: 1

Education attainment for females 25 years and older:
- No schooling: 2
- Nursery to 4th grade: 0
- 5th and 6th grade: 6
- 7th and 8th grade: 2
- 9th grade: 0
- 10th grade: 0
- 11th grade: 0
- 12th grade, no diploma: 0
- High school graduate (or equivalency): 167
- Less than 1 year of college: 38
- Some college more than 1 year, no degree: 194
- Associate degree: 18
- Bachelor's degree: 22
- Master's degree: 27
- Professional school degree: 1
- Doctorate degree: 0


Housing units in structures:
- One, detached: 385
- One, attached: 54
- Two: 47
- 3 or 4: 11
House/condo owner moved in on average 21 years ago
Renter moved in on average 4 years ago

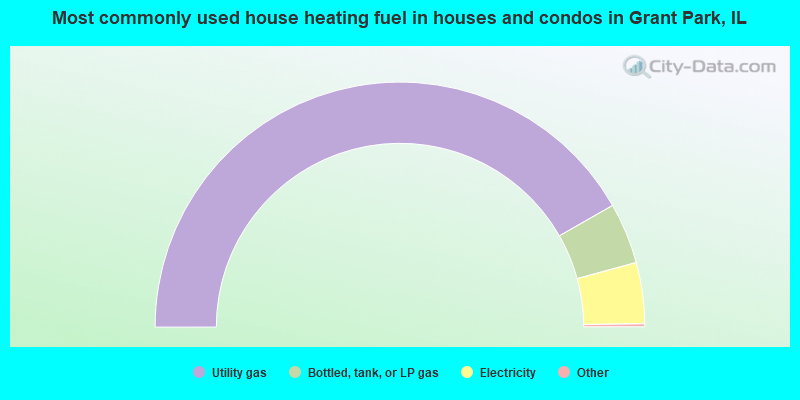
- 83.8%Utility gas
- 8.1%Bottled, tank, or LP gas
- 8.1%Electricity
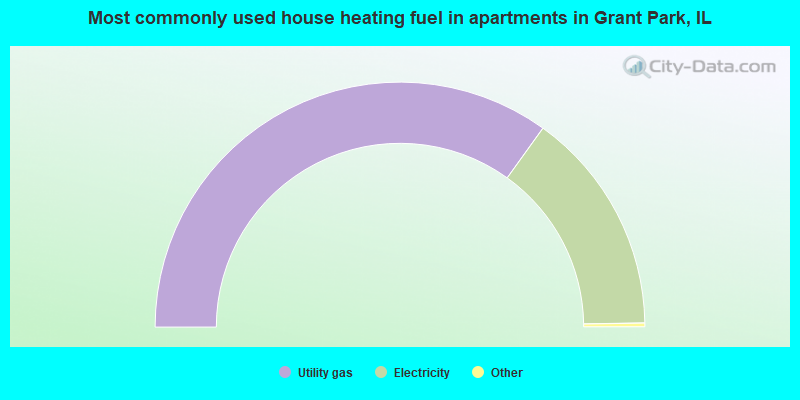
- 70.2%Utility gas
- 29.8%Electricity
Private vs. public school enrollment:
| Here: | 18.9% |
| Illinois: | 13.3% |
| Here: | 3.6% |
| Illinois: | 9.9% |
| Here: | 11.8% |
| Illinois: | 27.4% |


