Grantsville, MD (Maryland) Houses and Residents
| Grantsville: | $201,823 |
| Maryland: | $398,100 |
Mean price in 2022:
Detached houses: $194,500
Here: $194,500 State: $526,819 Townhouses or other attached units: $184,812
Here: $184,812 State: $328,305
Total population: 769 (Urban population: 0, Rural population: 630 (all nonfarm))
Houses: 454 (416 occupied: 163 owner occupied, 258 renter occupied)
| % of renters here: | 61% |
| State: | 32% |
Housing density: 643 houses/condos per square mile
Median price asked for vacant for-sale houses and condos in 2022 in this county: $266,949.
Median contract rent in 2022: $486 (lower quartile is $365, upper quartile is $554)
Median rent asked for vacant for-rent units in 2022: $1,452
Median gross rent in Grantsville, MD in 2022: $610
Housing units in Grantsville with a mortgage: 106 (28 second mortgage, 6 home equity loan, 22 both second mortgage and home equity loan)
Houses without a mortgage: 20
Median household income for houses/condos with a mortgage: $109,617
Median household income for apartments without a mortgage: $74,187
Median monthly housing costs: $650
Compare current foreclosures near Grantsville, MD:
| Photo | Address | Area | Beds / Baths | Price | Details |
|---|---|---|---|---|---|

|
#1
Windswept Ln
Grantsville, MD 21536
|
1,792 sq. feet
|
3 baths - beds |
show details | |

|
#2
Moonlight Dr
Grantsville, MD 21536
|
2,448 sq. feet
|
3 baths - beds |
show details | |

|
#3
Water Level Rd
Rockwood, PA 15557
|
1,949 sq. feet
|
1 baths 3 beds |
show details | |

|
#4
Sherman St
Rockwood, PA 15557
|
3,616 sq. feet
|
3 baths 4 beds |
show details | |

|
#5
Welsh St
Frostburg, MD 21532
|
1,663 sq. feet
|
2 baths 4 beds |
show details | |

|
#6
Large St
Meyersdale, PA 15552
|
1,056 sq. feet
|
1 baths 3 beds |
show details | |

|
#7
Dannys Ln
Fairhope, PA 15538
|
1,352 sq. feet
|
1 baths 3 beds |
show details | |

|
#8
Listonburg Rd
Confluence, PA 15424
|
1,556 sq. feet
|
1 baths 4 beds |
show details | |

|
#9
Shaw St
Frostburg, MD 21532
|
1,644 sq. feet
|
2 baths - beds |
show details | |

|
#10
Broadway St
Rockwood, PA 15557
|
1,496 sq. feet
|
1 baths 4 beds |
show details |
| Photo | Address | Area | Beds / Baths | Price | Details |
|---|---|---|---|---|---|

|
#11
Engles Mill Rd
Salisbury, PA 15558
|
3,568 sq. feet
|
2 baths 6 beds |
show details | |

|
#12
Federal St
Frostburg, MD 21532
|
1,056 sq. feet
|
1 baths - beds |
show details | |

|
#13
Mount Savage Rd NW
Mount Savage, MD 21545
|
1,924 sq. feet
|
1 baths - beds |
show details | |

|
#14
Watercliff St
Lonaconing, MD 21539
|
2,048 sq. feet
|
1 baths - beds |
show details | |

|
#15
Horse Rock Rd SW
Westernport, MD 21562
|
1,152 sq. feet
|
1 baths - beds |
show details | |

|
#16
New School Rd NW
Mount Savage, MD 21545
|
1,806 sq. feet
|
1 baths - beds |
show details | |

|
#17
Angel St SW
Frostburg, MD 21532
|
1,068 sq. feet
|
1 baths - beds |
show details | |

|
#18
Walnut St
Westernport, MD 21562
|
1,186 sq. feet
|
1 baths - beds |
show details | |

|
#19
Hoffman Hollow Rd SW
Frostburg, MD 21532
|
1,548 sq. feet
|
1 baths - beds |
show details | |

|
#20
Hummingbird Hl SW
Lonaconing, MD 21539
|
1,944 sq. feet
|
2 baths - beds |
show details |
| Photo | Address | Area | Beds / Baths | Price | Details |
|---|---|---|---|---|---|

|
#21
Maryland Ave
Westernport, MD 21562
|
1,708 sq. feet
|
1 baths - beds |
show details | |

|
#22
Porter Rd SW
Frostburg, MD 21532
|
1,664 sq. feet
|
3 baths - beds |
show details | |

|
#23
Warnick Rd SW
Frostburg, MD 21532
|
1,888 sq. feet
|
2 baths - beds |
show details | |

|
#24
Cemetery Rd
Frostburg, MD 21532
|
1,536 sq. feet
|
2 baths - beds |
show details | |

|
#25
Lower Sunnyside Rd NW
Mount Savage, MD 21545
|
702 sq. feet
|
1 baths - beds |
show details | |

|
#26
Blank Rd NW
Mount Savage, MD 21545
|
2,360 sq. feet
|
4 baths - beds |
show details | |

|
#27
W Florida Way
Lonaconing, MD 21539
|
1,664 sq. feet
|
1 baths - beds |
show details | |

|
#28
Washington St
Frostburg, MD 21532
|
1,218 sq. feet
|
2 baths - beds |
show details | |

|
#29
Ormand St
Frostburg, MD 21532
|
2,100 sq. feet
|
1 baths - beds |
show details | |

|
#30
National Pike
Frostburg, MD 21532
|
1,400 sq. feet
|
2 baths - beds |
show details |
| Photo | Address | Area | Beds / Baths | Price | Details |
|---|---|---|---|---|---|

|
#31
Avilton Lonaconing Rd
Lonaconing, MD 21539
|
1,407 sq. feet
|
1 baths - beds |
show details | |

|
#32
Collier Rd
Accident, MD 21520
|
1,080 sq. feet
|
1 baths - beds |
show details | |

|
#33
Carlos Rd SW
Frostburg, MD 21532
|
1,037 sq. feet
|
1 baths - beds |
show details | |

|
#34
S Water St
Frostburg, MD 21532
|
1,092 sq. feet
|
1 baths - beds |
show details | |

|
#35
W Main St
Frostburg, MD 21532
|
2,088 sq. feet
|
2 baths - beds |
show details | |

|
#36
Welsh Hill Rd
Frostburg, MD 21532
|
960 sq. feet
|
1 baths - beds |
show details | |

|
#37
E Main St
Frostburg, MD 21532
|
1,315 sq. feet
|
1 baths - beds |
show details | |

|
#38
Laurel Run Rd SW
Barton, MD 21521
|
1,424 sq. feet
|
1 baths - beds |
show details | |

|
#39
Detmold St
Lonaconing, MD 21539
|
2,689 sq. feet
|
2 baths - beds |
show details | |

|
#40
N Ridge Rd
Mc Henry, MD 21541
|
1,248 sq. feet
|
2 baths - beds |
show details |
| Photo | Address | Area | Beds / Baths | Price | Details |
|---|---|---|---|---|---|

|
#41
Braddock St Unit 802
Frostburg, MD 21532
|
- sq. feet
|
- baths - beds |
show details | |

|
#42
Old Beechwood Rd SW
Lonaconing, MD 21539
|
- sq. feet
|
- baths - beds |
show details | |

|
#43
Latrobe St
Barton, MD 21521
|
- sq. feet
|
- baths - beds |
show details | |

|
#44
E Main St Apt 2
Frostburg, MD 21532
|
- sq. feet
|
- baths - beds |
show details | |

|
#45
Rock Lodge Road
Accident, MD 21520
|
- sq. feet
|
- baths - beds |
show details | |

|
#46
Piney Run Rd
Frostburg, MD 21532
|
- sq. feet
|
- baths - beds |
show details | |

|
#47
Avilton Lonaconing Rd
Lonaconing, MD 21539
|
- sq. feet
|
- baths - beds |
show details | |

|
#48
Smith St
Salisbury, PA 15558
|
- sq. feet
|
- baths - beds |
show details | |

|
#49
Broken Hart Mine Rd
Frostburg, MD 21532
|
- sq. feet
|
- baths - beds |
show details | |

|
Check over 1 million property listings on Foreclosure.com!
|
browse all offers | |||

Latest news about housing in Grantsville, MD collected exclusively by city-data.com from local newspapers, TV, and radio stations


Median year apartment built: 1979
Household type by relationship:
Households: 956- Male householders: 173 (37 living alone), Female householders: 239 (163 living alone)
139 spouses (139 opposite-sex spouses), 51 unmarried partners, (51 opposite-sex unmarried partners), 219 children (209 natural, 10 adopted, 0 stepchildren), 3 grandchildren, 24 brothers or sisters, 0 parents, 0 foster children, 0 other relatives, 0 non-relatives
- In group quarters: 108
Size of family households: 85 2-persons, 25 3-persons, 67 4-persons, 30 5-persons.
Size of nonfamily households: 209 1-person, 6 2-persons.
110 married couples with children.
67 single-parent households (56 men, 11 women).
93.4% of residents of Grantsville speak English at home.
0.1% of residents speak Spanish at home (100% speak English well).
5.2% of residents speak other Indo-European language at home (100% speak English very well).
1.0% of residents speak Asian or Pacific Island language at home (100% speak English not well).
Foreign born population: 9 (0.9%)
(100.0% of them are naturalized citizens)
| Here: | 7.4 |
| State: | 7.3 |
| Here: | 3.9 |
| State: | 4.2 |

- Bedrooms in owner-occupied houses and condos in Grantsville, Maryland
- 0no bedroom
- 01 bedroom
- 62 bedrooms
- 843 bedrooms
- 704 bedrooms
- 45+ bedrooms

- Bedrooms in renter-occupied apartments in Grantsville, Maryland
- 4no bedroom
- 371 bedroom
- 1572 bedrooms
- 593 bedrooms
- 04 bedrooms
- 15+ bedrooms

- Cars and other vehicles available in Grantsville in owner-occupied houses/condos
- 0no vehicle
- 521 vehicle
- 562 vehicles
- 443 vehicles
- 114 vehicles
- 05+ vehicles

- Cars and other vehicles available in Grantsville in renter-occupied apartments
- 36no vehicle
- 1751 vehicle
- 462 vehicles
- 13 vehicles
- 04 vehicles
- 05+ vehicles

- Rooms in owner-occupied houses in Grantsville, Maryland
- 01 room
- 02 rooms
- 03 rooms
- 84 rooms
- 95 rooms
- 106 rooms
- 577 rooms
- 448 rooms
- 359+ rooms

- Rooms in renter-occupied apartments in Grantsville, Maryland
- 01 room
- 82 rooms
- 753 rooms
- 924 rooms
- 245 rooms
- 586 rooms
- 07 rooms
- 08 rooms
- 19+ rooms


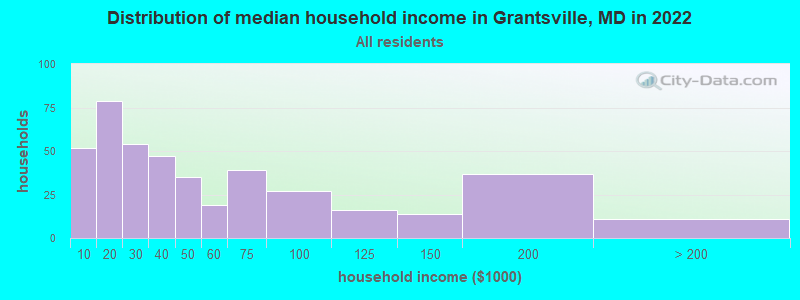
Grantsville, MD household income distribution

- 52Less than $10,000
- 79$10,000 to $19,999
- 54$20,000 to $29,999
- 47$30,000 to $39,999
- 35$40,000 to $49,999
- 19$50,000 to $59,999
- 39$60,000 to $74,999
- 27$75,000 to $99,999
- 16$100,000 to $124,999
- 14$125,000 to $149,999
- 37$150,000 to $199,999
- 11$200,000 or more
Home value of owner - occupied houses in 2022 in Grantsville, MD
-
- 3$70,000 to $79,999
- 0$80,000 to $89,999
- 0$90,000 to $99,999
- 22$100,000 to $124,999
- 6$125,000 to $149,999
- 13$150,000 to $174,999
- 32$175,000 to $199,999
- 18$200,000 to $249,999
- 15$250,000 to $299,999
- 25$300,000 to $399,999
- 5$400,000 to $499,999
Rent paid by renters in 2022 in Grantsville, MD
-
- 5Less than $100
- 4$100 to $149
- 36$150 to $199
- 4$200 to $249
- 1$250 to $299
- 2$300 to $349
- 7$350 to $399
- 1$400 to $449
- 49$450 to $499
- 65$500 to $549
- 15$550 to $599
- 16$600 to $649
- 1$650 to $699
- 13$700 to $749
- 7$750 to $799
- 10$900 to $999
- 1$3,000 to $3,499
- 3No cash rent


Percentage of workers working in this county: 74.2%
Number of people working at home: 9 (2.4% of all workers)
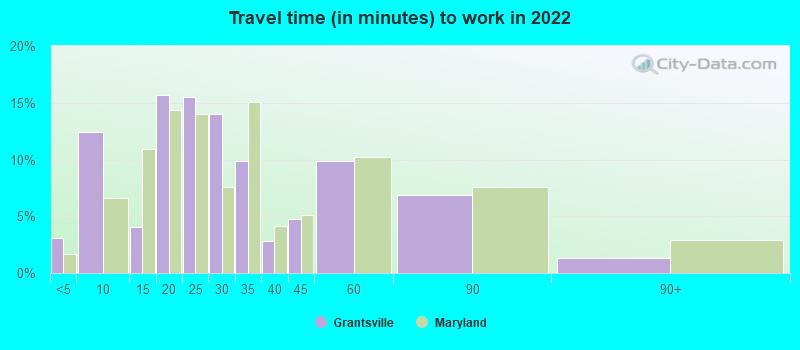
Travel time to work (commute)
- Less than 5 minutes: 9
- 5 to 9 minutes: 48
- 10 to 14 minutes: 32
- 15 to 19 minutes: 70
- 20 to 24 minutes: 43
- 25 to 29 minutes: 47
- 30 to 34 minutes: 42
- 35 to 39 minutes: 4
- 40 to 44 minutes: 22
- 45 to 59 minutes: 33
- 60 to 89 minutes: 3
- 90 or more minutes: 0
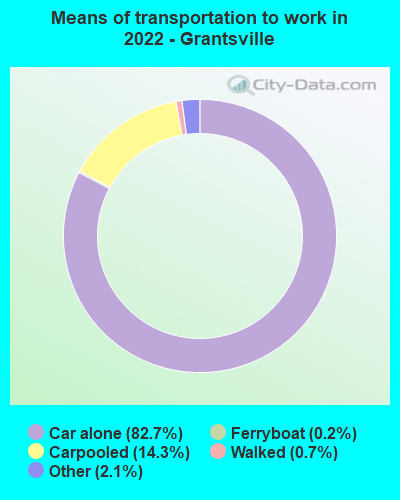
Means of transportation to work:
- Drove a car alone: 971 (77.7%)
- Carpooled: 179 (14.3%)
- Ferryboat: 2 (0.2%)
- Taxi: 27 (2.2%)
- Walked: 8 (0.6%)
- Worked at home: 9 (0.7%)

- Unemployment by race in 2022
- Unemployment rate for White non-Hispanic residents
- 2.9%Males

- Year of entry for the foreign-born population in Grantsville, Maryland
- 02010 or later
- 02000 to 2009
- 71990 to 1999
- 01980 to 1989
- 01970 to 1979
- 3Before 1970

First ancestries reported:
- German: 168 (38.8%)
- American: 106 (24.5%)
- Irish: 33 (7.6%)
- Scottish: 33 (7.6%)
- English: 32 (7.4%)
- Italian: 32 (7.4%)
- Danish: 9 (2.1%)
- Welsh: 4 (0.9%)
- Swiss: 3 (0.7%)
- European: 2 (0.5%)
- Iranian: 2 (0.5%)
- Polish: 2 (0.5%)
- British: 1 (0.2%)
Most common places of birth for foreign-born residents (%):
| Grantsville: | 66.7% (6) |
| Maryland: | 3.4% (32,635) |
| Grantsville: | 22.2% (2) |
| Maryland: | 1.3% (12,074) |
Place of birth for U.S.-born residents:
- This state: 525
- Other state: 409
- Northeast: 259
- Midwest: 47
- South: 91
- West: 9
89.7% of Grantsville residents lived in the same house 1 years ago.
Out of people who lived in different houses, 39.4% lived in this county.
Out of people who lived in different counties, 50.0% lived in Maryland.
| Grantsville: | 89.7% |
| State average: | 88.5% |
Education attainment for males 25 years and older:
- No schooling: 0
- Nursery to 4th grade: 0
- 5th and 6th grade: 0
- 7th and 8th grade: 20
- 9th grade: 0
- 10th grade: 11
- 11th grade: 1
- 12th grade, no diploma: 0
- High school graduate (or equivalency): 83
- Less than 1 year of college: 12
- Some college more than 1 year, no degree: 30
- Associate degree: 6
- Bachelor's degree: 37
- Master's degree: 19
- Professional school degree: 0
- Doctorate degree: 10

Education attainment for females 25 years and older:
- No schooling: 0
- Nursery to 4th grade: 0
- 5th and 6th grade: 28
- 7th and 8th grade: 7
- 9th grade: 9
- 10th grade: 6
- 11th grade: 4
- 12th grade, no diploma: 1
- High school graduate (or equivalency): 125
- Less than 1 year of college: 71
- Some college more than 1 year, no degree: 30
- Associate degree: 21
- Bachelor's degree: 62
- Master's degree: 43
- Professional school degree: 0
- Doctorate degree: 4


Housing units in structures:
- One, detached: 209
- One, attached: 52
- Two: 6
- 3 or 4: 60
- 5 to 9: 16
- 10 to 19: 100
- 20 to 49: 2
- 50 or more: 5
- Mobile homes: 3
House/condo owner moved in on average 16 years ago
Renter moved in on average 6 years ago

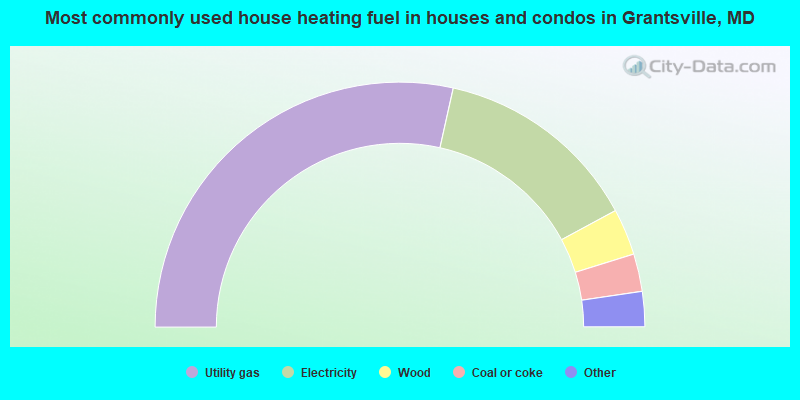
- 57.5%Utility gas
- 27.5%Electricity
- 6.2%Wood
- 5.0%Coal or coke
- 1.9%Bottled, tank, or LP gas
- 1.9%No fuel used
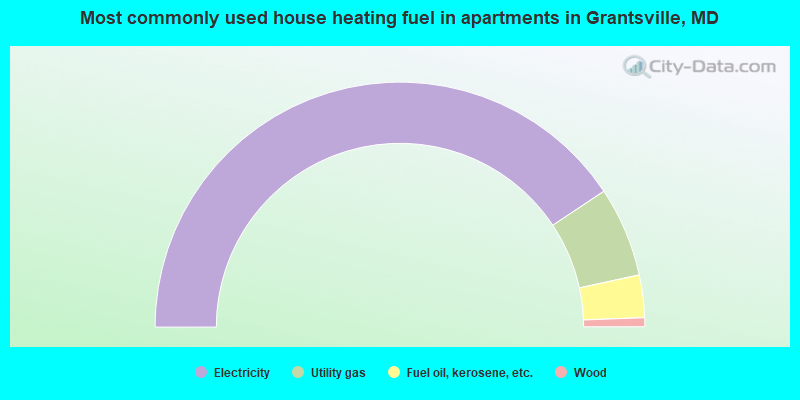
- 81.3%Electricity
- 11.9%Utility gas
- 5.6%Fuel oil, kerosene, etc.
- 1.2%Wood
Private vs. public school enrollment:
| Here: | 0.0% |
| Maryland: | 15.2% |
| Here: | 0.0% |
| Maryland: | 14.4% |
| Here: | 41.2% |
| Maryland: | 20.2% |


