Granville, IL (Illinois) Houses and Residents
| Granville: | $135,534 |
| Illinois: | $251,600 |
Mean price in 2022:
Detached houses: $147,267
Here: $147,267 State: $310,164
Total population: 1,363 (Urban population: 0, Rural population: 1,430 (1 farm, 1,429 nonfarm))
Houses: 690 (606 occupied: 476 owner occupied, 138 renter occupied)
| % of renters here: | 22% |
| State: | 33% |
Housing density: 721 houses/condos per square mile
Median price asked for vacant for-sale houses and condos in 2022 in this county: $264,214.
Median contract rent in 2022: $514 (lower quartile is $453, upper quartile is $639)
Median rent asked for vacant for-rent units in 2022: $532
Median gross rent in Granville, IL in 2022: $714
Housing units in Granville with a mortgage: 228 (19 second mortgage, 0 home equity loan, 13 both second mortgage and home equity loan)
Houses without a mortgage: 19
Median household income for houses/condos with a mortgage: $78,360
Median household income for apartments without a mortgage: $68,067
Median monthly housing costs: $744
Compare current foreclosures near Granville, IL:
| Photo | Address | Area | Beds / Baths | Price | Details |
|---|---|---|---|---|---|

|
#1
E Main St
Granville, IL 61326
|
2,691 sq. feet
|
3 baths 5 beds |
show details | |

|
#2
E 4th St
Spring Valley, IL 61362
|
- sq. feet
|
1 baths 3 beds |
show details | |

|
#3
E Marion St
Princeton, IL 61356
|
1,268 sq. feet
|
1 baths 2 beds |
show details | |

|
#4
Robert St
Henry, IL 61537
|
- sq. feet
|
- baths - beds |
$29,900
|
show details |

|
#5
2150 East St
Tiskilwa, IL 61368
|
1,630 sq. feet
|
2 baths 3 beds |
show details | |

|
#6
2nd St
La Salle, IL 61301
|
- sq. feet
|
2 baths 3 beds |
show details | |

|
#7
Lincoln St
Seatonville, IL 61359
|
2,308 sq. feet
|
3 baths 4 beds |
show details | |

|
#8
2400 North Ave # -
La Moille, IL 61330
|
1,700 sq. feet
|
1 baths 4 beds |
show details | |

|
#9
9th St
La Salle, IL 61301
|
2,771 sq. feet
|
- baths - beds |
show details | |

|
#10
Pike St
Peru, IL 61354
|
672 sq. feet
|
- baths - beds |
show details |
| Photo | Address | Area | Beds / Baths | Price | Details |
|---|---|---|---|---|---|

|
#11
Hidden Valley Dr
Varna, IL 61375
|
- sq. feet
|
- baths - beds |
show details | |

|
#12
Bryan St
Henry, IL 61537
|
1,155 sq. feet
|
- baths - beds |
show details | |

|
#13
Sunset Blvd
Oglesby, IL 61348
|
- sq. feet
|
- baths - beds |
show details | |

|
#14
E 450th Rd
Oglesby, IL 61348
|
- sq. feet
|
- baths - beds |
show details | |

|
#15
Cerulla Cir
Oglesby, IL 61348
|
- sq. feet
|
- baths - beds |
show details | |

|
#16
Western Rd
Henry, IL 61537
|
- sq. feet
|
- baths - beds |
show details | |

|
#17
Monroe St
Henry, IL 61537
|
886 sq. feet
|
- baths - beds |
show details | |

|
#18
2nd St
La Salle, IL 61301
|
- sq. feet
|
- baths - beds |
show details | |

|
#19
W 2nd St
Oglesby, IL 61348
|
- sq. feet
|
- baths - beds |
show details | |

|
#20
2nd St
Mark, IL 61340
|
- sq. feet
|
- baths - beds |
show details |
| Photo | Address | Area | Beds / Baths | Price | Details |
|---|---|---|---|---|---|

|
#21
Carroll St
Henry, IL 61537
|
- sq. feet
|
- baths - beds |
show details | |

|
#22
E 1st St
Spring Valley, IL 61362
|
- sq. feet
|
- baths - beds |
show details | |

|
#23
N 2199th Rd
Tonica, IL 61370
|
- sq. feet
|
- baths - beds |
show details | |

|
#24
Claire Ln
Utica, IL 61373
|
- sq. feet
|
- baths - beds |
show details | |

|
#25
E 6th St
Spring Valley, IL 61362
|
- sq. feet
|
- baths - beds |
show details | |

|
#26
Market St
Henry, IL 61537
|
1,065 sq. feet
|
- baths - beds |
show details | |

|
#27
Crosat St
La Salle, IL 61301
|
- sq. feet
|
- baths - beds |
show details | |

|
#28
School St
Henry, IL 61537
|
1,540 sq. feet
|
- baths - beds |
show details | |

|
#29
E 1st St
Oglesby, IL 61348
|
- sq. feet
|
- baths - beds |
show details | |

|
#30
N Main St
Lostant, IL 61334
|
- sq. feet
|
- baths - beds |
show details |
| Photo | Address | Area | Beds / Baths | Price | Details |
|---|---|---|---|---|---|

|
#31
Pontiac St
Tonica, IL 61370
|
- sq. feet
|
- baths - beds |
show details | |

|
#32
3rd St Apt 4
La Salle, IL 61301
|
- sq. feet
|
- baths - beds |
show details | |

|
#33
Field Ave
Oglesby, IL 61348
|
- sq. feet
|
- baths - beds |
show details | |

|
#34
Oak Ridge Dr
La Salle, IL 61301
|
- sq. feet
|
- baths - beds |
show details | |

|
#35
Grant Ave Apt 114
La Salle, IL 61301
|
- sq. feet
|
- baths - beds |
show details | |

|
#36
Roberts Rd
Magnolia, IL 61336
|
- sq. feet
|
- baths - beds |
show details | |

|
#37
11th St
Peru, IL 61354
|
- sq. feet
|
- baths - beds |
show details | |

|
#38
Gary St
Leonore, IL 61332
|
- sq. feet
|
- baths - beds |
show details | |

|
#39
Calhoun St
Peru, IL 61354
|
- sq. feet
|
- baths - beds |
show details | |

|
#40
Cedar St
Cedar Point, IL 61316
|
- sq. feet
|
- baths - beds |
show details |
| Photo | Address | Area | Beds / Baths | Price | Details |
|---|---|---|---|---|---|

|
#41
E 4th St
Depue, IL 61322
|
- sq. feet
|
- baths - beds |
show details | |

|
#42
W Clark St
Princeton, IL 61356
|
- sq. feet
|
- baths - beds |
show details | |

|
#43
E 4th St
Depue, IL 61322
|
- sq. feet
|
- baths - beds |
show details | |

|
#44
1/2 W Marquette St
Princeton, IL 61356
|
- sq. feet
|
- baths - beds |
show details | |

|
#45
N Mercer St
Princeton, IL 61356
|
- sq. feet
|
- baths - beds |
show details | |

|
#46
E High St
Hennepin, IL 61327
|
- sq. feet
|
- baths - beds |
show details | |

|
#47
2nd St Apt 10
Peru, IL 61354
|
- sq. feet
|
- baths - beds |
show details | |

|
#48
N Park Ave
Dover, IL 61323
|
- sq. feet
|
- baths - beds |
show details | |

|
#49
4th St
Peru, IL 61354
|
- sq. feet
|
- baths - beds |
show details | |

|
Check over 1 million property listings on Foreclosure.com!
|
browse all offers | |||

Latest news about housing in Granville, IL collected exclusively by city-data.com from local newspapers, TV, and radio stations

 | I need help finding cheap apartments for a grad student attending DePaul (11 replies) |
| David Earl Williams III: Lori Lightfoot, #Nocopacademy, Rent Control & More (3 replies) |
| Decent neighborhood for apartment rental? (16 replies) |
| Moving to Chicago. Opinions on Edgewater? (17 replies) |
| Uptown/Edgewater area vs. Avondale/Irving Park area? (12 replies) |
| Edgewater(Chicago) (3 replies) |

Median year apartment built: 1965
Household type by relationship:
Households: 1,453- Male householders: 245 (101 living alone), Female householders: 350 (86 living alone)
288 spouses (288 opposite-sex spouses), 36 unmarried partners, (36 opposite-sex unmarried partners), 429 children (402 natural, 12 adopted, 13 stepchildren), 31 grandchildren, 8 brothers or sisters, 5 parents, 0 foster children, 19 other relatives, 37 non-relatives
Size of family households: 190 2-persons, 98 3-persons, 59 4-persons, 29 5-persons, 4 6-persons, 3 7-or-more-persons.
Size of nonfamily households: 198 1-person, 30 2-persons.
213 married couples with children.
55 single-parent households (16 men, 39 women).
92.4% of residents of Granville speak English at home.
7.4% of residents speak Spanish at home (75% speak English very well, 25% speak English well).
0.3% of residents speak other Indo-European language at home (100% speak English very well).
Foreign born population: 30 (2.1%)
(90.0% of them are naturalized citizens)
| Here: | 6.2 |
| State: | 6.4 |
| Here: | 3.9 |
| State: | 4.1 |

- Bedrooms in owner-occupied houses and condos in Granville, Illinois
- 0no bedroom
- 181 bedroom
- 982 bedrooms
- 2753 bedrooms
- 834 bedrooms
- 25+ bedrooms

- Bedrooms in renter-occupied apartments in Granville, Illinois
- 0no bedroom
- 301 bedroom
- 962 bedrooms
- 113 bedrooms
- 24 bedrooms
- 05+ bedrooms

- Cars and other vehicles available in Granville in owner-occupied houses/condos
- 7no vehicle
- 1471 vehicle
- 2342 vehicles
- 523 vehicles
- 314 vehicles
- 65+ vehicles

- Cars and other vehicles available in Granville in renter-occupied apartments
- 9no vehicle
- 951 vehicle
- 322 vehicles
- 33 vehicles
- 04 vehicles
- 05+ vehicles

- Rooms in owner-occupied houses in Granville, Illinois
- 01 room
- 02 rooms
- 33 rooms
- 234 rooms
- 1015 rooms
- 1676 rooms
- 777 rooms
- 378 rooms
- 689+ rooms

- Rooms in renter-occupied apartments in Granville, Illinois
- 01 room
- 02 rooms
- 323 rooms
- 694 rooms
- 285 rooms
- 76 rooms
- 07 rooms
- 08 rooms
- 29+ rooms


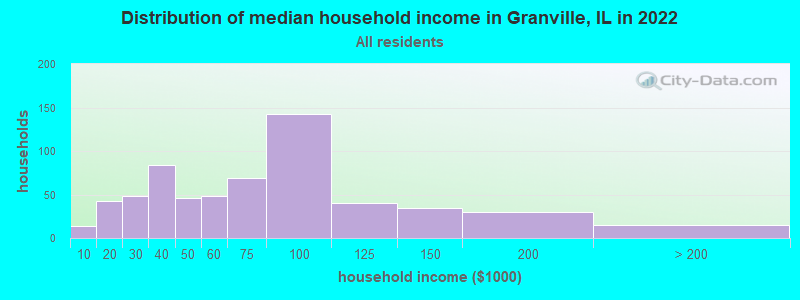
Granville, IL household income distribution

- 14Less than $10,000
- 43$10,000 to $19,999
- 48$20,000 to $29,999
- 84$30,000 to $39,999
- 46$40,000 to $49,999
- 48$50,000 to $59,999
- 69$60,000 to $74,999
- 143$75,000 to $99,999
- 40$100,000 to $124,999
- 35$125,000 to $149,999
- 30$150,000 to $199,999
- 15$200,000 or more
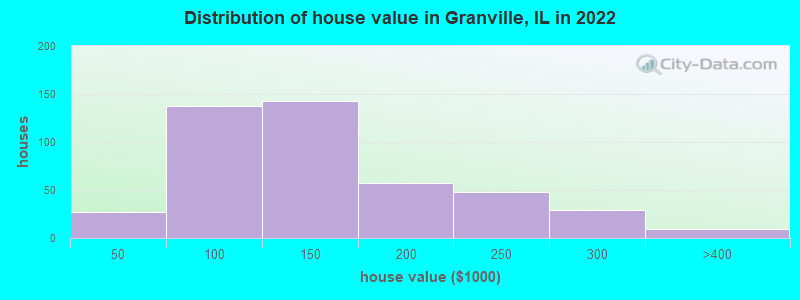
Home value of owner - occupied houses in 2022 in Granville, IL
-
- 3Less than $10,000
- 6$15,000 to $19,999
- 11$20,000 to $24,999
- 3$25,000 to $29,999
- 1$40,000 to $49,999
- 18$50,000 to $59,999
- 14$60,000 to $69,999
- 47$70,000 to $79,999
- 28$80,000 to $89,999
- 27$90,000 to $99,999
- 48$100,000 to $124,999
- 94$125,000 to $149,999
- 31$150,000 to $174,999
- 25$175,000 to $199,999
- 48$200,000 to $249,999
- 28$250,000 to $299,999
- 9$300,000 to $399,999
Rent paid by renters in 2022 in Granville, IL
-
- 4$100 to $149
- 3$150 to $199
- 4$200 to $249
- 8$350 to $399
- 11$400 to $449
- 23$450 to $499
- 27$500 to $549
- 5$550 to $599
- 17$600 to $649
- 5$650 to $699
- 7$750 to $799
- 17$800 to $899
- 1$900 to $999
- 4No cash rent


Percentage of workers working in this county: 39.8%
Number of people working at home: 9 (1.3% of all workers)
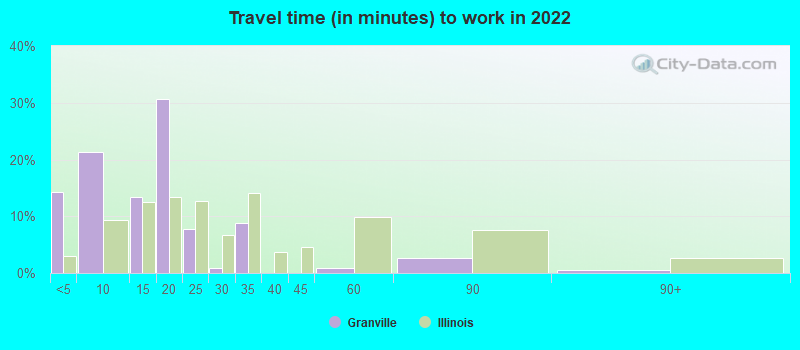
Travel time to work (commute)
- Less than 5 minutes: 54
- 5 to 9 minutes: 57
- 10 to 14 minutes: 68
- 15 to 19 minutes: 154
- 20 to 24 minutes: 99
- 25 to 29 minutes: 29
- 30 to 34 minutes: 61
- 35 to 39 minutes: 23
- 40 to 44 minutes: 11
- 45 to 59 minutes: 34
- 60 to 89 minutes: 26
- 90 or more minutes: 15
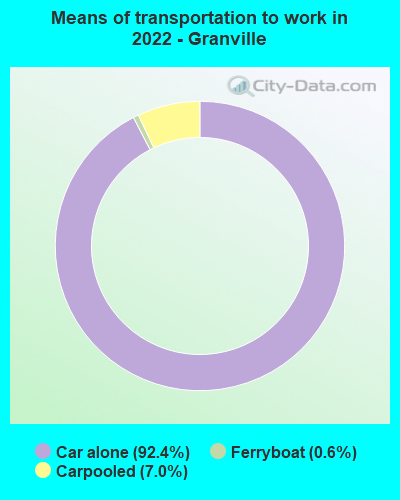
Means of transportation to work:
- Drove a car alone: 293 (87.2%)
- Carpooled: 23 (6.8%)
- Ferryboat: 1 (0.3%)
- Worked at home: 9 (2.7%)

- Unemployment by race in 2022
- Unemployment rate for White non-Hispanic residents
- 4.3%Females
- Unemployment rate for other race residents
- 100.0%Females
- Unemployment rate for Hispanic or Latino residents
- 1.5%Females

- Year of entry for the foreign-born population in Granville, Illinois
- 112010 or later
- 02000 to 2009
- 01990 to 1999
- 71980 to 1989
- 181970 to 1979
- 19Before 1970

First ancestries reported:
- German: 160 (25.7%)
- American: 75 (12.0%)
- Italian: 75 (12.0%)
- Irish: 38 (6.1%)
- English: 36 (5.8%)
- Polish: 22 (3.5%)
- Swedish: 17 (2.7%)
- Lithuanian: 9 (1.4%)
- Ethiopian: 9 (1.4%)
- Norwegian: 4 (0.6%)
- Scotch-Irish: 4 (0.6%)
- Slovene: 4 (0.6%)
- French: 2 (0.3%)
- Hungarian: 1 (0.2%)
Most common places of birth for foreign-born residents (%):
| Granville: | 43.3% (13) |
| Illinois: | 1.1% (19,306) |
| Granville: | 30.0% (9) |
| Illinois: | 0.3% (4,775) |
| Granville: | 10.0% (3) |
| Illinois: | 0.5% (8,551) |
| Granville: | 6.7% (2) |
| Illinois: | 34.7% (626,958) |
Place of birth for U.S.-born residents:
- This state: 1,228
- Other state: 189
- Northeast: 0
- Midwest: 91
- South: 64
- West: 32
91.3% of Granville residents lived in the same house 1 years ago.
Out of people who lived in different houses, 35.8% lived in this county.
Out of people who lived in different counties, 88.2% lived in Illinois.
| Granville: | 91.3% |
| State average: | 88.3% |
Education attainment for males 25 years and older:
- No schooling: 0
- Nursery to 4th grade: 1
- 5th and 6th grade: 0
- 7th and 8th grade: 3
- 9th grade: 0
- 10th grade: 1
- 11th grade: 6
- 12th grade, no diploma: 36
- High school graduate (or equivalency): 193
- Less than 1 year of college: 38
- Some college more than 1 year, no degree: 71
- Associate degree: 27
- Bachelor's degree: 48
- Master's degree: 13
- Professional school degree: 6
- Doctorate degree: 0

Education attainment for females 25 years and older:
- No schooling: 1
- Nursery to 4th grade: 0
- 5th and 6th grade: 0
- 7th and 8th grade: 0
- 9th grade: 0
- 10th grade: 5
- 11th grade: 8
- 12th grade, no diploma: 3
- High school graduate (or equivalency): 194
- Less than 1 year of college: 46
- Some college more than 1 year, no degree: 79
- Associate degree: 70
- Bachelor's degree: 111
- Master's degree: 38
- Professional school degree: 6
- Doctorate degree: 0


Housing units in structures:
- One, detached: 589
- One, attached: 7
- Two: 41
- 3 or 4: 33
- 50 or more: 8
- Mobile homes: 7
- Boats, RVs, vans, etc.: 4
Housing units lacking complete kitchen facilities in 2022: 1.0%
House/condo owner moved in on average 20 years ago
Renter moved in on average 3 years ago

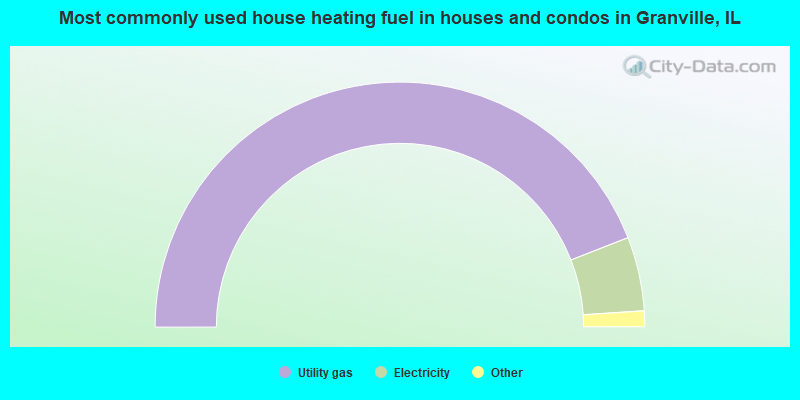
- 88.2%Utility gas
- 9.8%Electricity
- 1.5%Wood
- 0.4%Bottled, tank, or LP gas
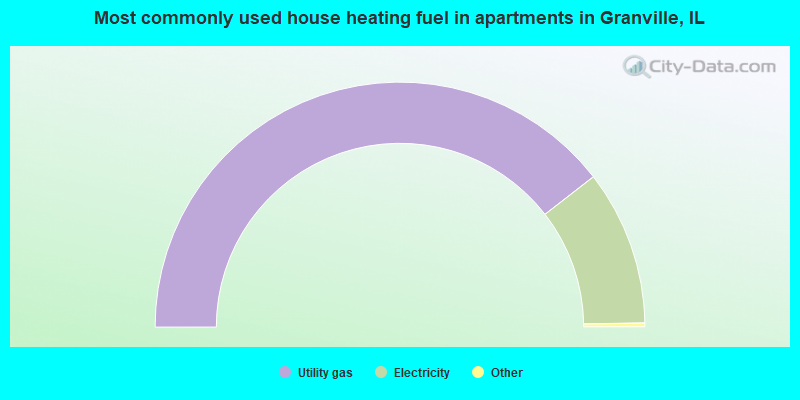
- 79.4%Utility gas
- 20.6%Electricity
Private vs. public school enrollment:
| Here: | 1.2% |
| Illinois: | 13.3% |
| Here: | 37.5% |
| Illinois: | 9.9% |
| Here: | 0.0% |
| Illinois: | 27.4% |


