Granville, OH (Ohio) Houses and Residents
| Granville: | $508,783 |
| Ohio: | $204,100 |
Mean price in 2022:
Detached houses: $548,506
Here: $548,506 State: $254,366 Townhouses or other attached units: $309,448
Here: $309,448 State: $225,733 In 3-to-4-unit structures: $345,127
Here: $345,127 State: $203,002
Total population: 5,723 (Urban population: 2,287, Rural population: 630 (all nonfarm))
Houses: 1,823 (1,729 occupied: 1,359 owner occupied, 428 renter occupied)
| % of renters here: | 24% |
| State: | 33% |
Housing density: 455 houses/condos per square mile
Median price asked for vacant for-sale houses and condos in 2022: $572,408.
Median contract rent in 2022: $851 (lower quartile is $793, upper quartile is $1,392)
Median gross rent in Granville, OH in 2022: $1,045
Housing units in Granville with a mortgage: 751 (123 second mortgage, 0 home equity loan, 105 both second mortgage and home equity loan)
Houses without a mortgage: 13
Median household income for houses/condos with a mortgage: $144,002
Median household income for apartments without a mortgage: $193,162
Median monthly housing costs: $1,468
Compare current foreclosures near Granville, OH:
| Photo | Address | Area | Beds / Baths | Price | Details |
|---|---|---|---|---|---|

|
#1
Mannaseh Dr E
Granville, OH 43023
|
2,850 sq. feet
|
3 baths 4 beds |
show details | |

|
#2
Raccoon Valley Rd
Granville, OH 43023
|
3,292 sq. feet
|
3 baths 4 beds |
show details | |

|
#3
Outville Rd
Granville, OH 43023
|
2,094 sq. feet
|
2 baths 3 beds |
show details | |

|
#4
Columbus Rd
Granville, OH 43023
|
1,482 sq. feet
|
1 baths 2 beds |
show details | |

|
#5
Ellington Blvd
Granville, OH 43023
|
- sq. feet
|
- baths - beds |
show details | |

|
#6
Burg St
Granville, OH 43023
|
- sq. feet
|
- baths - beds |
show details | |

|
#7
W Broadway
Granville, OH 43023
|
- sq. feet
|
- baths - beds |
show details | |

|
#8
Mannaseh Dr E
Granville, OH 43023
|
- sq. feet
|
- baths - beds |
show details | |

|
#9
Hickman Rd NE
Newark, OH 43055
|
1,674 sq. feet
|
2 baths 3 beds |
$159,900
|
show details |

|
#10
Ridge Rd
Thornville, OH 43076
|
946 sq. feet
|
1 baths 2 beds |
$54,900
|
show details |
| Photo | Address | Area | Beds / Baths | Price | Details |
|---|---|---|---|---|---|

|
#11
Flint Ridge Rd SE
Heath, OH 43056
|
1,520 sq. feet
|
1 baths 2 beds |
$225,000
|
show details |

|
#12
Priestley Dr
Reynoldsburg, OH 43068
|
1,956 sq. feet
|
3 baths 3 beds |
show details | |

|
#13
Johnstown Rd
Centerburg, OH 43011
|
1,500 sq. feet
|
2 baths 3 beds |
show details | |

|
#14
Long Hollow Dr
Pataskala, OH 43062
|
2,468 sq. feet
|
4 baths 4 beds |
show details | |

|
#15
Blacklick Ridge Blvd
Blacklick, OH 43004
|
1,816 sq. feet
|
3 baths 4 beds |
show details | |

|
#16
S Main St
Johnstown, OH 43031
|
1,622 sq. feet
|
2 baths 3 beds |
show details | |

|
#17
Ravines Edge Ct
Pataskala, OH 43062
|
4,096 sq. feet
|
6 baths 5 beds |
show details | |

|
#18
S Main St
Baltimore, OH 43105
|
1,464 sq. feet
|
1 baths 4 beds |
show details | |

|
#19
N Liberty St
Baltimore, OH 43105
|
2,923 sq. feet
|
1 baths 3 beds |
show details | |

|
#20
Grassy Knoll Way
Johnstown, OH 43031
|
1,624 sq. feet
|
3 baths 4 beds |
show details |
| Photo | Address | Area | Beds / Baths | Price | Details |
|---|---|---|---|---|---|

|
#21
N Main St
Johnstown, OH 43031
|
1,864 sq. feet
|
2 baths 3 beds |
show details | |

|
#22
Westview Dr
Johnstown, OH 43031
|
1,225 sq. feet
|
1 baths 3 beds |
show details | |

|
#23
Kyber Run Cir
Johnstown, OH 43031
|
1,666 sq. feet
|
3 baths 3 beds |
show details | |

|
#24
Stemen Rd
Pickerington, OH 43147
|
1,334 sq. feet
|
2 baths 3 beds |
show details | |

|
#25
Montgomery Rd NE
Newark, OH 43055
|
2,592 sq. feet
|
2 baths 3 beds |
show details | |

|
#26
Braeburn Ct
Blacklick, OH 43004
|
2,122 sq. feet
|
3 baths 4 beds |
show details | |

|
#27
New Albany Condit Rd
Westerville, OH 43081
|
4,376 sq. feet
|
4 baths 4 beds |
show details | |

|
#28
Canal Dr
Millersport, OH 43046
|
1,920 sq. feet
|
2 baths 2 beds |
show details | |

|
#29
Autumn Trce
Pataskala, OH 43062
|
1,548 sq. feet
|
3 baths 2 beds |
show details | |

|
#30
Harrison Pond Dr
New Albany, OH 43054
|
3,167 sq. feet
|
2 baths 5 beds |
show details |
| Photo | Address | Area | Beds / Baths | Price | Details |
|---|---|---|---|---|---|

|
#31
Hawkins Ln
Blacklick, OH 43004
|
896 sq. feet
|
1 baths 2 beds |
show details | |

|
#32
Pinecrest Dr
Blacklick, OH 43004
|
3,627 sq. feet
|
4 baths 4 beds |
show details | |

|
#33
Fallsburg Rd NE
Newark, OH 43055
|
1,283 sq. feet
|
1 baths 3 beds |
show details | |

|
#34
S 2nd St
Newark, OH 43055
|
1,064 sq. feet
|
1 baths 2 beds |
show details | |

|
#35
Beacon Rd
Newark, OH 43055
|
1,367 sq. feet
|
2 baths 3 beds |
show details | |

|
#36
Ridgely Tract Rd
Heath, OH 43056
|
1,218 sq. feet
|
2 baths 3 beds |
show details | |

|
#37
Spring St
Newark, OH 43055
|
1,435 sq. feet
|
1 baths 3 beds |
show details | |

|
#38
Cypress Dr
Newark, OH 43055
|
1,680 sq. feet
|
2 baths 4 beds |
show details | |

|
#39
Blue Jay Rd
Heath, OH 43056
|
2,621 sq. feet
|
3 baths 3 beds |
show details | |

|
#40
Russell Ave
Newark, OH 43055
|
1,148 sq. feet
|
1 baths 3 beds |
show details |
| Photo | Address | Area | Beds / Baths | Price | Details |
|---|---|---|---|---|---|

|
#41
Watkins Rd SW
Pataskala, OH 43062
|
1,827 sq. feet
|
2 baths 3 beds |
show details | |

|
#42
Marilyn Ct
Heath, OH 43056
|
912 sq. feet
|
1 baths 2 beds |
show details | |

|
#43
Clayburn Dr
Pataskala, OH 43062
|
1,907 sq. feet
|
3 baths 4 beds |
show details | |

|
#44
Chowning Rd
Thornville, OH 43076
|
1,056 sq. feet
|
1 baths 3 beds |
show details | |

|
#45
Mary Lou Dr
Pataskala, OH 43062
|
3,220 sq. feet
|
3 baths 4 beds |
show details | |

|
#46
Kirkdale Dr
Blacklick, OH 43004
|
1,088 sq. feet
|
2 baths 3 beds |
show details | |

|
#47
Legacy Ln SW
Pataskala, OH 43062
|
2,308 sq. feet
|
3 baths 4 beds |
show details | |

|
#48
Burtwood Dr
Pataskala, OH 43062
|
3,143 sq. feet
|
3 baths 4 beds |
show details | |

|
#49
6th Ave
Buckeye Lake, OH 43008
|
1,032 sq. feet
|
1 baths 2 beds |
show details | |

|
Check over 1 million property listings on Foreclosure.com!
|
browse all offers | |||

Latest news about housing in Granville, OH collected exclusively by city-data.com from local newspapers, TV, and radio stations

 | Houses for rent in or near Granville, OHIO? (0 replies) |
| Blendon Woods condos (2 replies) |
| houses for rent in Granville? (8 replies) |
| Blendon Woods/Gahanna/Blacklick area condos? (2 replies) |
| houses for rent in Granville? (3 replies) |
| Farm house (3 replies) |

Median year apartment built: 1997
Household type by relationship:
Households: 5,859- Male householders: 844 (222 living alone), Female householders: 895 (287 living alone)
980 spouses (980 opposite-sex spouses), 27 unmarried partners, (27 opposite-sex unmarried partners), 998 children (970 natural, 26 adopted, 2 stepchildren), 30 grandchildren, 9 brothers or sisters, 18 parents, 0 foster children, 19 other relatives, 20 non-relatives
- In group quarters: 2,014
Size of family households: 634 2-persons, 368 3-persons, 134 4-persons, 58 5-persons, 8 7-or-more-persons.
Size of nonfamily households: 502 1-person, 76 2-persons.
720 married couples with children.
104 single-parent households (100 men, 4 women).
91.2% of residents of Granville speak English at home.
1.5% of residents speak Spanish at home (29% speak English very well, 16% speak English well, 55% speak English not well).
1.9% of residents speak other Indo-European language at home (66% speak English very well, 34% speak English well).
4.3% of residents speak Asian or Pacific Island language at home (54% speak English very well, 36% speak English well, 10% speak English not well).
0.7% of residents speak other language at home (58% speak English very well, 24% speak English well, 18% speak English not well).
Foreign born population: 464 (7.9%)
(21.8% of them are naturalized citizens)
| Here: | 8.3 |
| State: | 6.7 |
| Here: | 4.2 |
| State: | 4.4 |

- Bedrooms in owner-occupied houses and condos in Granville, Ohio
- 0no bedroom
- 01 bedroom
- 1602 bedrooms
- 5013 bedrooms
- 5474 bedrooms
- 1515+ bedrooms

- Bedrooms in renter-occupied apartments in Granville, Ohio
- 51no bedroom
- 651 bedroom
- 2022 bedrooms
- 693 bedrooms
- 424 bedrooms
- 05+ bedrooms

- Cars and other vehicles available in Granville in owner-occupied houses/condos
- 5no vehicle
- 2801 vehicle
- 7162 vehicles
- 2443 vehicles
- 784 vehicles
- 365+ vehicles

- Cars and other vehicles available in Granville in renter-occupied apartments
- 116no vehicle
- 1881 vehicle
- 1252 vehicles
- 03 vehicles
- 04 vehicles
- 05+ vehicles

- Rooms in owner-occupied houses in Granville, Ohio
- 01 room
- 02 rooms
- 753 rooms
- 464 rooms
- 205 rooms
- 446 rooms
- 3127 rooms
- 2138 rooms
- 6519+ rooms

- Rooms in renter-occupied apartments in Granville, Ohio
- 511 room
- 182 rooms
- 1073 rooms
- 844 rooms
- 295 rooms
- 716 rooms
- 77 rooms
- 88 rooms
- 529+ rooms


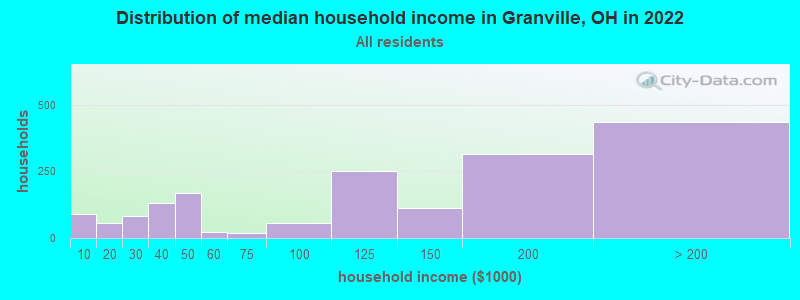
Granville, OH household income distribution

- 91Less than $10,000
- 58$10,000 to $19,999
- 83$20,000 to $29,999
- 130$30,000 to $39,999
- 171$40,000 to $49,999
- 23$50,000 to $59,999
- 20$60,000 to $74,999
- 58$75,000 to $99,999
- 250$100,000 to $124,999
- 114$125,000 to $149,999
- 316$150,000 to $199,999
- 436$200,000 or more
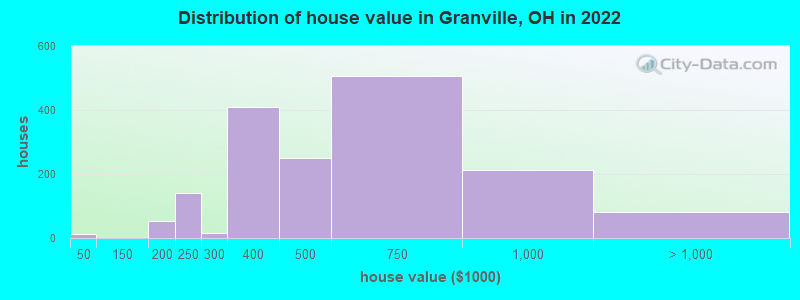
Home value of owner - occupied houses in 2022 in Granville, OH
-
- 5Less than $10,000
- 7$10,000 to $14,999
- 48$150,000 to $174,999
- 3$175,000 to $199,999
- 140$200,000 to $249,999
- 15$250,000 to $299,999
- 408$300,000 to $399,999
- 250$400,000 to $499,999
- 504$500,000 to $749,999
- 212$750,000 to $999,999
- 80$1,000,000 to $1,499,999
Rent paid by renters in 2022 in Granville, OH
-
- 8$400 to $449
- 93$450 to $499
- 64$800 to $899
- 37$900 to $999
- 29$1,000 to $1,249
- 48$1,250 to $1,499
- 25$1,500 to $1,999
- 29$2,500 to $2,999
- 47$3,500 or more
- 20No cash rent

Percentage of workers working in this county: 81.6%
Number of people working at home: 660 (26.0% of all workers)
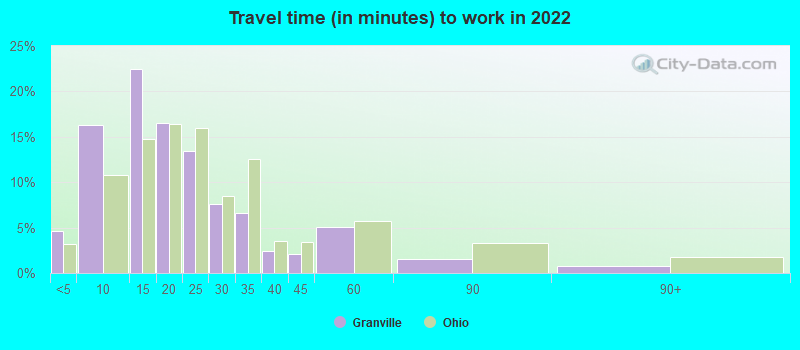
Travel time to work (commute)
- Less than 5 minutes: 144
- 5 to 9 minutes: 457
- 10 to 14 minutes: 451
- 15 to 19 minutes: 196
- 20 to 24 minutes: 85
- 25 to 29 minutes: 67
- 30 to 34 minutes: 159
- 35 to 39 minutes: 86
- 40 to 44 minutes: 36
- 45 to 59 minutes: 174
- 60 to 89 minutes: 77
- 90 or more minutes: 38
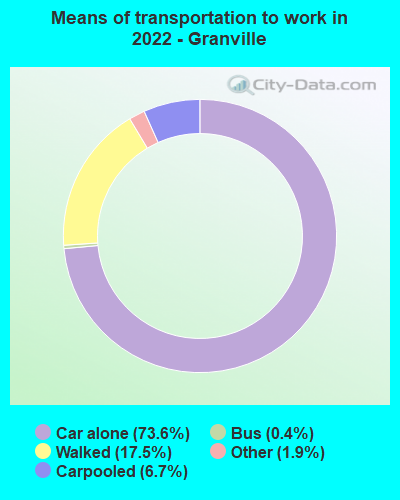
Means of transportation to work:
- Drove a car alone: 2,621 (62.5%)
- Carpooled: 254 (6.1%)
- Bus: 12 (0.3%)
- Taxi: 79 (1.9%)
- Walked: 625 (14.9%)
- Worked at home: 627 (15.0%)
- Unemployment by race in 2022
- Unemployment rate for White non-Hispanic residents
- 1.1%Males
- 2.5%Females
- Unemployment rate for Black residents
- 30.3%Females
- Unemployment rate for two or more race residents
- 14.2%Males
- Unemployment rate for Hispanic or Latino residents
- 8.7%Females

- Year of entry for the foreign-born population in Granville, Ohio
- 3582010 or later
- 442000 to 2009
- 91990 to 1999
- 01980 to 1989
- 301970 to 1979
- 51Before 1970

First ancestries reported:
- German: 386 (17.5%)
- Irish: 175 (7.9%)
- English: 174 (7.9%)
- European: 162 (7.4%)
- Italian: 141 (6.4%)
- American: 130 (5.9%)
- British: 48 (2.2%)
- Scottish: 34 (1.5%)
- Polish: 28 (1.3%)
- French Canadian: 24 (1.1%)
- Romanian: 20 (0.9%)
- Scandinavian: 20 (0.9%)
- Scotch-Irish: 19 (0.9%)
- Arab: 17 (0.8%)
- Russian: 16 (0.7%)
- Ukrainian: 16 (0.7%)
- Canadian: 15 (0.7%)
- Lebanese: 14 (0.6%)
- Swedish: 14 (0.6%)
- Czech: 10 (0.5%)
- Norwegian: 10 (0.5%)
- Ethiopian: 10 (0.5%)
- Ghanaian: 8 (0.4%)
- Welsh: 6 (0.3%)
- Greek: 5 (0.2%)
- Hungarian: 4 (0.2%)
- Northern European: 4 (0.2%)
Most common places of birth for foreign-born residents (%):
| Granville: | 29.0% (115) |
| Ohio: | 6.2% (35,703) |
| Granville: | 25.2% (100) |
| Ohio: | 1.9% (10,960) |
| Granville: | 9.8% (39) |
| Ohio: | 2.6% (14,988) |
| Granville: | 5.3% (21) |
| Ohio: | 1.0% (5,444) |
| Granville: | 3.5% (14) |
| Ohio: | 2.2% (12,846) |
| Granville: | 3.5% (14) |
| Ohio: | 1.4% (8,101) |
| Granville: | 3.0% (12) |
| Ohio: | 1.0% (5,979) |
| Granville: | 2.8% (11) |
| Ohio: | 0.6% (3,223) |
| Granville: | 2.8% (11) |
| Ohio: | 2.0% (11,398) |
| Granville: | 2.5% (10) |
| Ohio: | 1.5% (8,380) |
| Granville: | 2.5% (10) |
| Ohio: | 0.8% (4,549) |
| Granville: | 1.8% (7) |
| Ohio: | 1.8% (10,561) |
Place of birth for U.S.-born residents:
- This state: 2,777
- Other state: 2,542
- Northeast: 789
- Midwest: 933
- South: 535
- West: 287
84.5% of Granville residents lived in the same house 1 years ago.
Out of people who lived in different houses, 28.1% lived in this county.
Out of people who lived in different counties, 40.3% lived in Ohio.
| Granville: | 84.5% |
| State average: | 87.8% |
Education attainment for males 25 years and older:
- No schooling: 0
- Nursery to 4th grade: 0
- 5th and 6th grade: 0
- 7th and 8th grade: 0
- 9th grade: 0
- 10th grade: 0
- 11th grade: 0
- 12th grade, no diploma: 0
- High school graduate (or equivalency): 144
- Less than 1 year of college: 85
- Some college more than 1 year, no degree: 139
- Associate degree: 88
- Bachelor's degree: 624
- Master's degree: 184
- Professional school degree: 135
- Doctorate degree: 56

Education attainment for females 25 years and older:
- No schooling: 0
- Nursery to 4th grade: 0
- 5th and 6th grade: 0
- 7th and 8th grade: 0
- 9th grade: 0
- 10th grade: 0
- 11th grade: 0
- 12th grade, no diploma: 0
- High school graduate (or equivalency): 203
- Less than 1 year of college: 17
- Some college more than 1 year, no degree: 85
- Associate degree: 91
- Bachelor's degree: 529
- Master's degree: 455
- Professional school degree: 60
- Doctorate degree: 22


Housing units in structures:
- One, detached: 1,280
- One, attached: 140
- 3 or 4: 207
- 5 to 9: 16
- 10 to 19: 55
- 20 to 49: 37
- 50 or more: 86
Housing units lacking complete kitchen facilities in 2022: 6.5%
House/condo owner moved in on average 8 years ago
Renter moved in on average 5 years ago

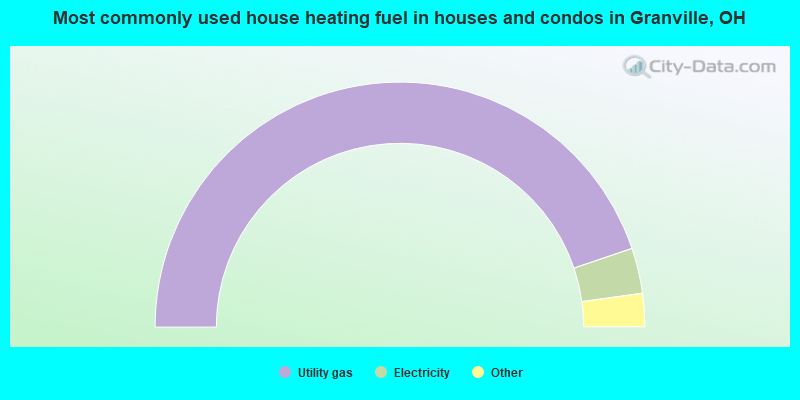
- 89.7%Utility gas
- 6.0%Electricity
- 2.5%Other fuel
- 1.8%Solar energy
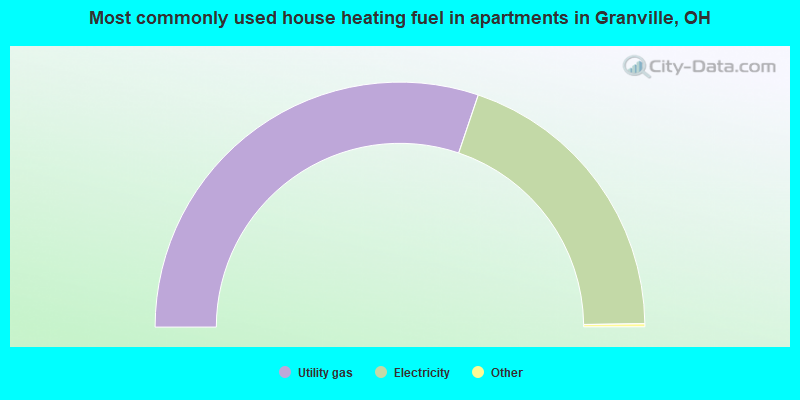
- 60.6%Utility gas
- 39.4%Electricity
Private vs. public school enrollment:
| Here: | 7.4% |
| Ohio: | 16.0% |
| Here: | 0.0% |
| Ohio: | 13.1% |
| Here: | 87.2% |
| Ohio: | 22.3% |


