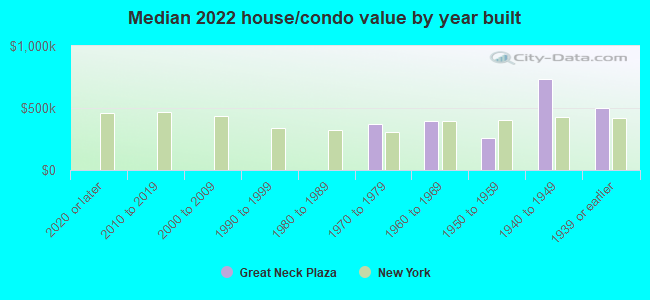
Great Neck Plaza, NY (New York) Houses and Residents
| Great Neck Plaza: | $404,245 |
| New York: | $400,400 |
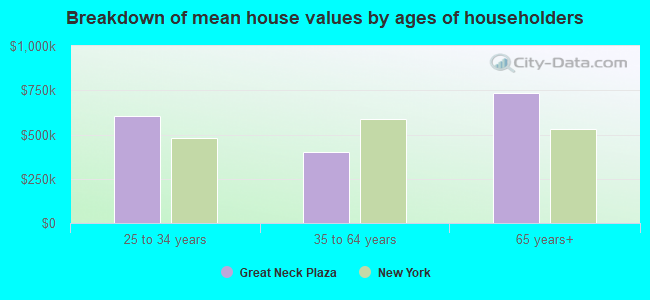
Mean price in 2022:
Detached houses: $1,178,810
Here: $1,178,810 State: $476,719 Townhouses or other attached units: $895,692
Here: $895,692 State: $699,270 In 5-or-more-unit structures: $492,247
Here: $492,247 State: $912,009
Total population: 6,918 (Urban population: 6,340, Rural population: 0)
Houses: 4,213 (3,896 occupied: 2,279 owner occupied, 1,609 renter occupied)
| % of renters here: | 41% |
| State: | 46% |
Housing density: 13,657 houses/condos per square mile
Median price asked for vacant for-sale houses and condos in 2022: $33,545.
Median contract rent in 2022: over $2,000 (lower quartile is $1,420, upper quartile is over $2,000)
Median rent asked for vacant for-rent units in 2022: $11,037
Median gross rent in Great Neck Plaza, NY in 2022: over $2,000
Housing units in Great Neck Plaza with a mortgage: 1,031 (26 second mortgage, 8 home equity loan, 17 both second mortgage and home equity loan)
Houses without a mortgage: 0
Median household income for houses/condos with a mortgage: $154,546
Median household income for apartments without a mortgage: $104,707
Median monthly housing costs: $1,674
Compare current foreclosures near Great Neck Plaza, NY:
| Photo | Address | Area | Beds / Baths | Price | Details |
|---|---|---|---|---|---|

|
#1
Francis Lewis Blvd
Queens Village, NY 11429
|
844 sq. feet
|
1 baths 2 beds |
$589,900
|
show details |

|
#2
N Broadway Apt A6
Yonkers, NY 10701
|
950 sq. feet
|
2 baths 2 beds |
$219,900
|
show details |

|
#3
96th St
Ozone Park, NY 11417
|
1,520 sq. feet
|
2 baths 3 beds |
$709,900
|
show details |

|
#4
Franklin St
Elmont, NY 11003
|
1,116 sq. feet
|
2 baths 2 beds |
$679,900
|
show details |

|
#5
6th Ave Apt A
Huntington Station, NY 11746
|
3,300 sq. feet
|
4 baths 7 beds |
$999,900
|
show details |

|
#6
Davenport Ave Apt 1b
New Rochelle, NY 10805
|
750 sq. feet
|
1 baths 1 beds |
$159,900
|
show details |

|
#7
2nd Ave # 5c
New York, NY 10029
|
550 sq. feet
|
1 baths 1 beds |
$429,900
|
show details |

|
#8
E 81st St Apt 4c
New York, NY 10028
|
696 sq. feet
|
1 baths 1 beds |
$745,000
|
show details |

|
#9
E 52nd St Apt 4f
New York, NY 10022
|
700 sq. feet
|
1 baths 1 beds |
$689,900
|
show details |

|
#10
Evans Ave
Elmont, NY 11003
|
1,352 sq. feet
|
2 baths 3 beds |
$719,900
|
show details |
| Photo | Address | Area | Beds / Baths | Price | Details |
|---|---|---|---|---|---|

|
#11
90th St Apt 5d
Jackson Heights, NY 11372
|
1,000 sq. feet
|
1 baths 2 beds |
$269,900
|
show details |

|
#12
E 221st St
Bronx, NY 10467
|
1,890 sq. feet
|
2 baths 3 beds |
$554,900
|
show details |

|
#13
E Marshall St
Hempstead, NY 11550
|
1,210 sq. feet
|
2 baths 4 beds |
$479,900
|
show details |

|
#14
Olinville Ave Apt 11c
Bronx, NY 10467
|
1,000 sq. feet
|
2 baths 3 beds |
$385,000
|
show details |

|
#15
72nd Avenue
Bellerose, NY 11426
|
850 sq. feet
|
1 baths 1 beds |
$269,900
|
show details |

|
#16
Ford Dr N
Massapequa, NY 11758
|
2,000 sq. feet
|
2 baths 5 beds |
$799,900
|
show details |

|
#17
A Somers St
Brooklyn, NY 11233
|
1,830 sq. feet
|
2 baths 4 beds |
$749,900
|
show details |

|
#18
Jersey Ave
Fairview, NJ 07022
|
1,073 sq. feet
|
1 baths 3 beds |
$414,900
|
show details |

|
#19
123rd Ave
Jamaica, NY 11434
|
1,042 sq. feet
|
1 baths 3 beds |
$460,000
|
show details |

|
#20
Horizon Rd Apt 803
Fort Lee, NJ 07024
|
843 sq. feet
|
1 baths 1 beds |
$178,900
|
show details |
| Photo | Address | Area | Beds / Baths | Price | Details |
|---|---|---|---|---|---|

|
#21
Riverdale Ave
Port Chester, NY 10573
|
1,616 sq. feet
|
1 baths 3 beds |
$645,000
|
show details |

|
#22
Fordham Hill Oval
Bronx, NY 10468
|
700 sq. feet
|
1 baths 1 beds |
$154,900
|
show details |

|
#23
Midland Ave Apt 4h
Bronxville, NY 10708
|
900 sq. feet
|
1 baths 1 beds |
$184,000
|
show details |

|
#24
Cedar Rd
Inwood, NY 11096
|
- sq. feet
|
2 baths 4 beds |
$699,000
|
show details |

|
#25
Edcris Ln
Huntington, NY 11743
|
1,450 sq. feet
|
2 baths 3 beds |
$550,000
|
show details |

|
#26
Dartmouth St
Westbury, NY 11590
|
1,772 sq. feet
|
1 baths 4 beds |
$499,200
|
show details |

|
#27
Fordham Hill Oval Apt 12d
Bronx, NY 10468
|
850 sq. feet
|
1 baths 1 beds |
$179,900
|
show details |

|
#28
Belmont Pkwy
Hempstead, NY 11550
|
1,348 sq. feet
|
1 baths 3 beds |
$659,900
|
show details |

|
#29
Bellport Ave
Wantagh, NY 11793
|
1,785 sq. feet
|
3 baths 5 beds |
$700,000
|
show details |

|
#30
Highland Ave
Cliffside Park, NJ 07010
|
2,451 sq. feet
|
3 baths 3 beds |
$832,000
|
show details |
| Photo | Address | Area | Beds / Baths | Price | Details |
|---|---|---|---|---|---|

|
#31
Tulip Ave # Gl2
Floral Park, NY 11001
|
1,200 sq. feet
|
1 baths 2 beds |
$409,900
|
show details |

|
#32
Harbor Rd
Hewlett, NY 11557
|
4,549 sq. feet
|
4 baths 5 beds |
$1,155,000
|
show details |

|
#33
Swinton Ave
Bronx, NY 10465
|
1,938 sq. feet
|
2 baths 3 beds |
$789,900
|
show details |

|
#34
Merle Ave
Oceanside, NY 11572
|
885 sq. feet
|
1 baths 2 beds |
$450,000
|
show details |

|
#35
Central Park Ave Apt 9m
Yonkers, NY 10710
|
1,300 sq. feet
|
2 baths 3 beds |
$319,900
|
show details |

|
#36
W Sidney Ave
Mount Vernon, NY 10550
|
2,800 sq. feet
|
3 baths 8 beds |
$454,900
|
show details |

|
#37
Grand Concourse Apt 3c
Bronx, NY 10452
|
700 sq. feet
|
1 baths 1 beds |
$184,500
|
show details |

|
#38
Oceanside Pkwy
Oceanside, NY 11572
|
1,650 sq. feet
|
2 baths 2 beds |
$545,000
|
show details |

|
#39
Fox Island Rd
Port Chester, NY 10573
|
- sq. feet
|
6 baths 6 beds |
$910,000
|
show details |

|
#40
Park Ave Apt 12
North Bergen, NJ 07047
|
835 sq. feet
|
1 baths 2 beds |
$379,900
|
show details |
| Photo | Address | Area | Beds / Baths | Price | Details |
|---|---|---|---|---|---|

|
#41
Ruxton St
Uniondale, NY 11553
|
1,176 sq. feet
|
1 baths 3 beds |
$450,000
|
show details |

|
#42
E 73rd St
New York, NY 10021
|
1,253 sq. feet
|
2 baths 2 beds |
$699,900
|
show details |

|
#43
E 32nd St Apt C7
Brooklyn, NY 11210
|
670 sq. feet
|
1 baths 1 beds |
$299,900
|
show details |

|
#44
177th St
Jamaica, NY 11433
|
1,156 sq. feet
|
1 baths 3 beds |
$450,000
|
show details |

|
#45
7th St
Ridgefield Park, NJ 07660
|
1,382 sq. feet
|
1 baths 3 beds |
$539,900
|
show details |

|
#46
17th Ave 1st Floor
Whitestone, NY 11357
|
610 sq. feet
|
1 baths 1 beds |
$229,900
|
show details |

|
#47
E 36th St Apt 9f
New York, NY 10016
|
700 sq. feet
|
1 baths 1 beds |
$499,900
|
show details |

|
#48
11th Ave
Huntington Station, NY 11746
|
- sq. feet
|
2 baths 4 beds |
$399,000
|
show details |

|
#49
153rd St
Jamaica, NY 11433
|
- sq. feet
|
2 baths 3 beds |
$348,000
|
show details |

|
Check over 1 million property listings on Foreclosure.com!
|
browse all offers | |||


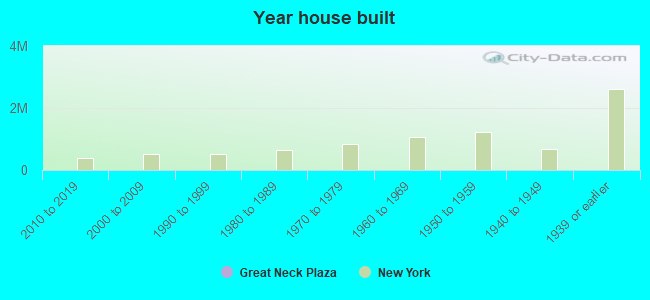
Median year apartment built: 1965
Household type by relationship:
Households: 7,413- Male householders: 1,718 (790 living alone), Female householders: 2,144 (1,044 living alone)
1,274 spouses (1,274 opposite-sex spouses), 199 unmarried partners, (177 opposite-sex unmarried partners), 1,241 children (1,241 natural, 0 adopted, 0 stepchildren), 146 grandchildren, 59 brothers or sisters, 117 parents, 0 foster children, 184 other relatives, 158 non-relatives
- In group quarters: 169
Size of family households: 1,005 2-persons, 444 3-persons, 289 4-persons, 36 5-persons, 23 6-persons.
Size of nonfamily households: 1,914 1-person, 245 2-persons.
747 married couples with children.
208 single-parent households (0 men, 208 women).
56.9% of residents of Great Neck Plaza speak English at home.
9.0% of residents speak Spanish at home (54% speak English very well, 41% speak English well, 5% speak English not well).
14.0% of residents speak other Indo-European language at home (72% speak English very well, 18% speak English well, 8% speak English not well, 1% don't speak English at all).
15.2% of residents speak Asian or Pacific Island language at home (63% speak English very well, 26% speak English well, 8% speak English not well, 3% don't speak English at all).
5.9% of residents speak other language at home (76% speak English very well, 24% speak English well).
Foreign born population: 2,788 (37.6%)
(63.1% of them are naturalized citizens)
| Here: | 3.7 |
| State: | 6.3 |
| Here: | 3.4 |
| State: | 3.8 |
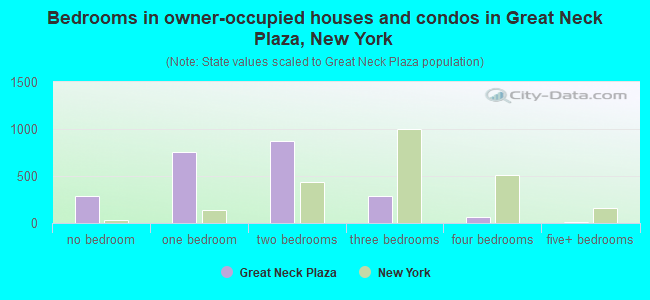
- Bedrooms in owner-occupied houses and condos in Great Neck Plaza, New York
- 289no bedroom
- 7581 bedroom
- 8722 bedrooms
- 2833 bedrooms
- 694 bedrooms
- 95+ bedrooms
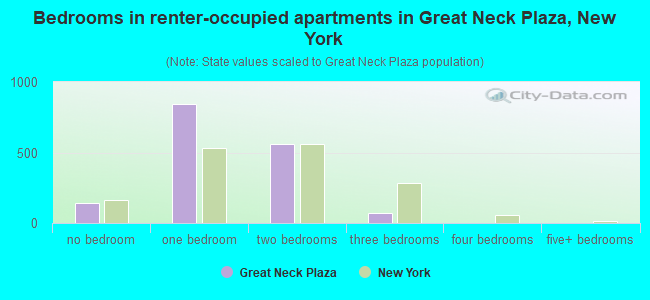
- Bedrooms in renter-occupied apartments in Great Neck Plaza, New York
- 141no bedroom
- 8421 bedroom
- 5582 bedrooms
- 693 bedrooms
- 04 bedrooms
- 05+ bedrooms
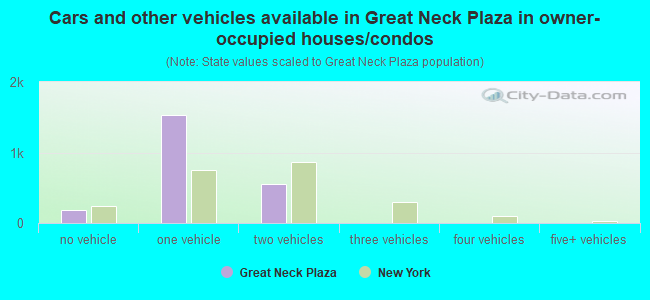
- Cars and other vehicles available in Great Neck Plaza in owner-occupied houses/condos
- 185no vehicle
- 1,5391 vehicle
- 5572 vehicles
- 03 vehicles
- 04 vehicles
- 05+ vehicles
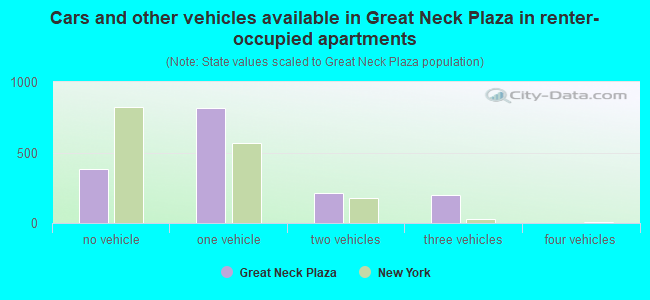
- Cars and other vehicles available in Great Neck Plaza in renter-occupied apartments
- 384no vehicle
- 8141 vehicle
- 2162 vehicles
- 1963 vehicles
- 04 vehicles
- 05+ vehicles
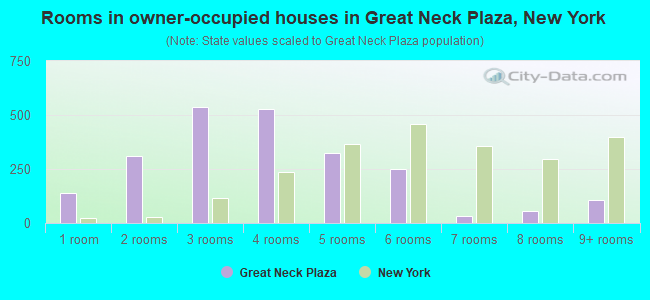
- Rooms in owner-occupied houses in Great Neck Plaza, New York
- 1381 room
- 3082 rooms
- 5373 rooms
- 5284 rooms
- 3235 rooms
- 2516 rooms
- 347 rooms
- 548 rooms
- 1079+ rooms
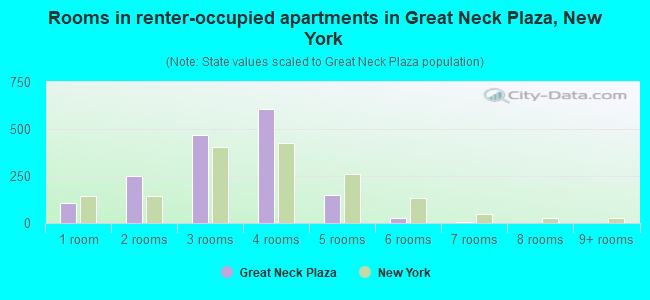
- Rooms in renter-occupied apartments in Great Neck Plaza, New York
- 1051 room
- 2492 rooms
- 4693 rooms
- 6054 rooms
- 1495 rooms
- 256 rooms
- 77 rooms
- 08 rooms
- 09+ rooms
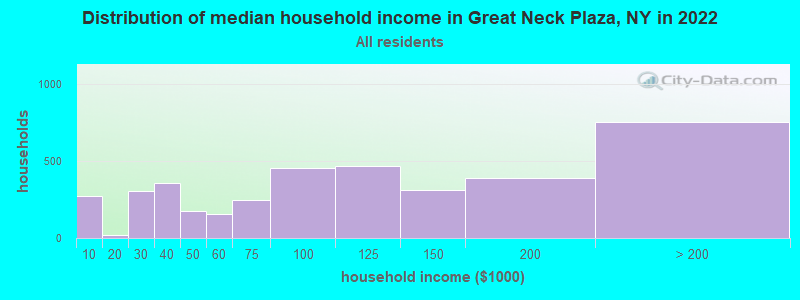
Great Neck Plaza, NY household income distribution

- 273Less than $10,000
- 17$10,000 to $19,999
- 306$20,000 to $29,999
- 356$30,000 to $39,999
- 175$40,000 to $49,999
- 158$50,000 to $59,999
- 245$60,000 to $74,999
- 458$75,000 to $99,999
- 466$100,000 to $124,999
- 310$125,000 to $149,999
- 388$150,000 to $199,999
- 754$200,000 or more
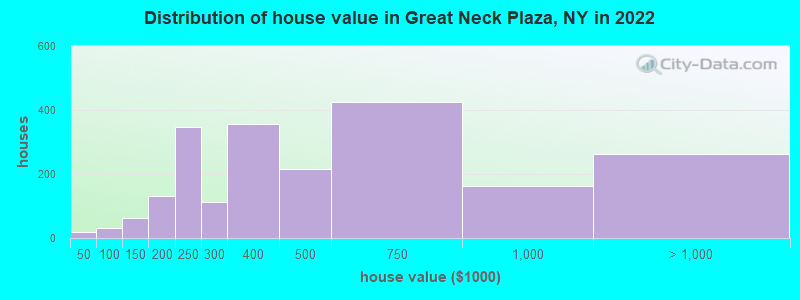
Home value of owner - occupied houses in 2022 in Great Neck Plaza, NY
-
- 17$30,000 to $34,999
- 32$50,000 to $59,999
- 64$125,000 to $149,999
- 85$150,000 to $174,999
- 46$175,000 to $199,999
- 345$200,000 to $249,999
- 111$250,000 to $299,999
- 356$300,000 to $399,999
- 216$400,000 to $499,999
- 425$500,000 to $749,999
- 160$750,000 to $999,999
- 181$1,000,000 to $1,499,999
- 61$1,500,000 to $1,999,999
- 21$2,000,000 or more
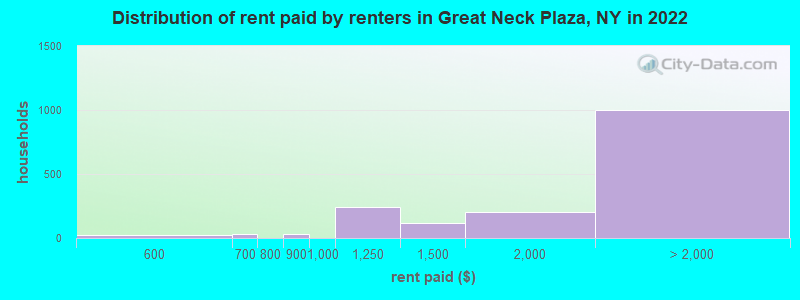
Rent paid by renters in 2022 in Great Neck Plaza, NY
-
- 22$500 to $549
- 33$650 to $699
- 30$800 to $899
- 238$1,000 to $1,249
- 120$1,250 to $1,499
- 201$1,500 to $1,999
- 316$2,000 to $2,499
- 311$2,500 to $2,999
- 122$3,000 to $3,499
- 107$3,500 or more
- 144No cash rent
Percentage of workers working in this county: 54.3%
Number of people working at home: 1,009 (28.6% of all workers)
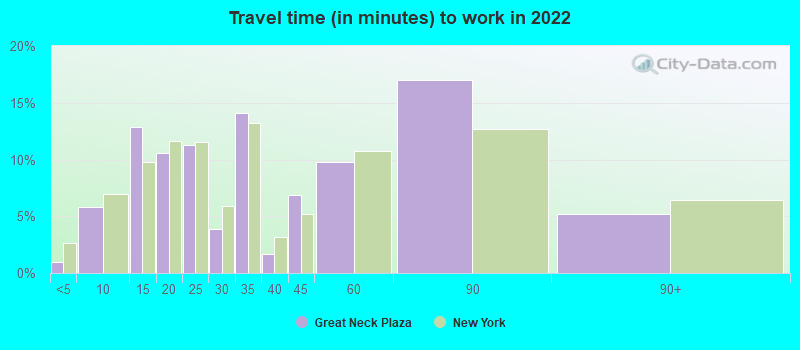
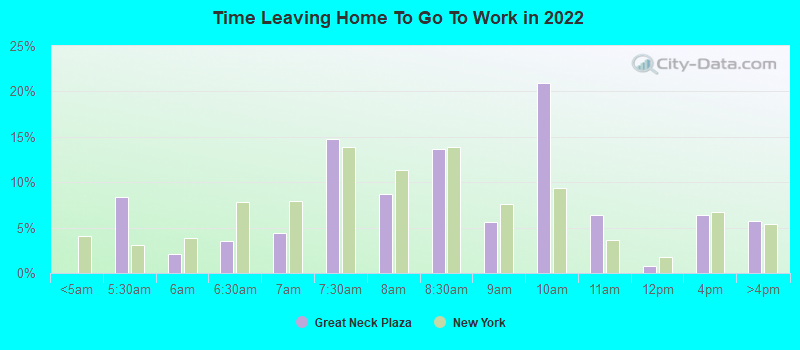
Travel time to work (commute)
- Less than 5 minutes: 97
- 5 to 9 minutes: 133
- 10 to 14 minutes: 255
- 15 to 19 minutes: 263
- 20 to 24 minutes: 56
- 25 to 29 minutes: 60
- 30 to 34 minutes: 114
- 35 to 39 minutes: 121
- 40 to 44 minutes: 204
- 45 to 59 minutes: 620
- 60 to 89 minutes: 608
- 90 or more minutes: 95
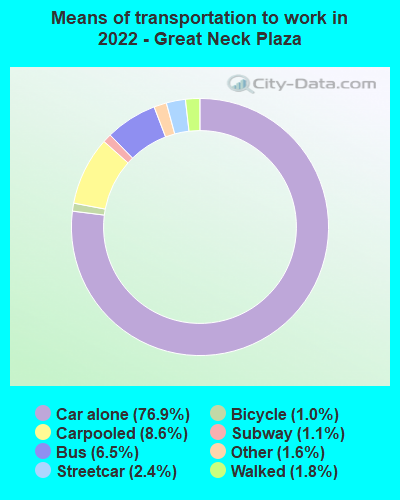
Means of transportation to work:
- Drove a car alone: 3,333 (62.4%)
- Carpooled: 362 (6.8%)
- Bus: 271 (5.1%)
- Subway or elevated rail: 93 (1.7%)
- Long-distance train or commuter rail: 42 (0.8%)
- Taxi: 102 (1.9%)
- Bicycle: 67 (1.3%)
- Walked: 84 (1.6%)
- Worked at home: 1,009 (18.9%)
- Unemployment by race in 2022
- Unemployment rate for White non-Hispanic residents
- 11.7%Males
- Unemployment rate for Asian residents
- 3.3%Males
- 9.6%Females
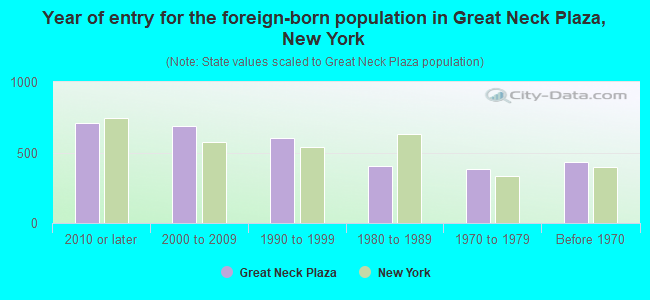
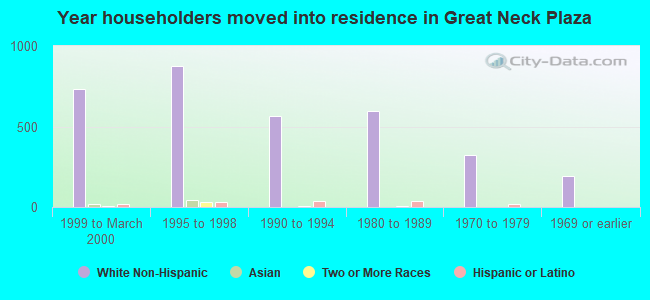
- Year of entry for the foreign-born population in Great Neck Plaza, New York
- 7062010 or later
- 6852000 to 2009
- 6051990 to 1999
- 4061980 to 1989
- 3831970 to 1979
- 432Before 1970
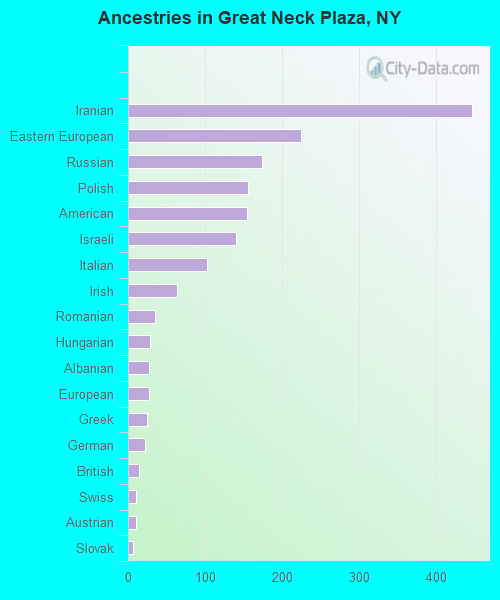
First ancestries reported:
- Iranian: 446 (11.1%)
- Eastern European: 224 (5.6%)
- Russian: 174 (4.3%)
- Polish: 156 (3.9%)
- American: 154 (3.8%)
- Israeli: 140 (3.5%)
- Italian: 103 (2.6%)
- Irish: 63 (1.6%)
- Romanian: 35 (0.9%)
- Hungarian: 29 (0.7%)
- Albanian: 27 (0.7%)
- European: 27 (0.7%)
- Greek: 24 (0.6%)
- German: 22 (0.5%)
- British: 14 (0.3%)
- Swiss: 11 (0.3%)
- Austrian: 10 (0.2%)
- Slovak: 6 (0.1%)
Most common places of birth for foreign-born residents (%):
| Great Neck Plaza: | 16.4% (443) |
| New York: | 0.4% (18,283) |
| Great Neck Plaza: | 12.1% (325) |
| New York: | 9.1% (410,910) |
| Great Neck Plaza: | 7.2% (195) |
| New York: | 2.4% (108,067) |
| Great Neck Plaza: | 6.9% (187) |
| New York: | 1.8% (82,786) |
| Great Neck Plaza: | 6.1% (165) |
| New York: | 0.7% (29,743) |
| Great Neck Plaza: | 6.1% (164) |
| New York: | 1.2% (54,759) |
| Great Neck Plaza: | 3.9% (105) |
| New York: | 0.6% (28,472) |
| Great Neck Plaza: | 3.8% (103) |
| New York: | 0.2% (8,745) |
| Great Neck Plaza: | 3.3% (88) |
| New York: | 1.4% (65,102) |
| Great Neck Plaza: | 3.0% (81) |
| New York: | 2.0% (91,070) |
| Great Neck Plaza: | 2.9% (78) |
| New York: | 1.8% (81,374) |
| Great Neck Plaza: | 2.7% (74) |
| New York: | 0.9% (42,220) |
| Great Neck Plaza: | 2.7% (73) |
| New York: | 2.5% (111,920) |
| Great Neck Plaza: | 2.6% (71) |
| New York: | 1.4% (61,245) |
| Great Neck Plaza: | 2.0% (55) |
| New York: | 1.7% (78,421) |
| Great Neck Plaza: | 2.0% (53) |
| New York: | 0.6% (28,604) |
| Great Neck Plaza: | 1.9% (50) |
| New York: | 2.6% (117,288) |
| Great Neck Plaza: | 1.6% (43) |
| New York: | 0.3% (12,762) |
| Great Neck Plaza: | 1.6% (42) |
| New York: | 0.9% (38,713) |
Place of birth for U.S.-born residents:
- This state: 3,997
- Other state: 563
- Northeast: 235
- Midwest: 54
- South: 117
- West: 156
88.6% of Great Neck Plaza residents lived in the same house 1 years ago.
Out of people who lived in different houses, 33.9% lived in this county.
Out of people who lived in different counties, 100.0% lived in New York.
| Great Neck Plaza: | 88.6% |
| State average: | 89.6% |
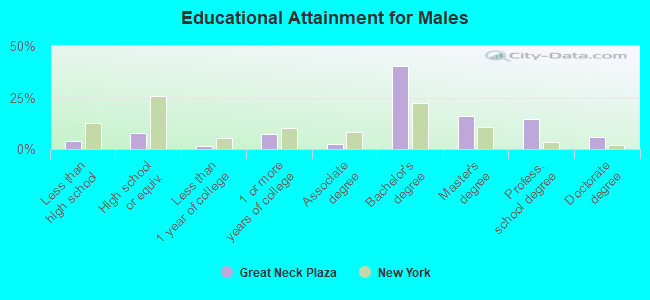
Education attainment for males 25 years and older:
- No schooling: 24
- Nursery to 4th grade: 0
- 5th and 6th grade: 9
- 7th and 8th grade: 0
- 9th grade: 0
- 10th grade: 29
- 11th grade: 15
- 12th grade, no diploma: 27
- High school graduate (or equivalency): 202
- Less than 1 year of college: 42
- Some college more than 1 year, no degree: 193
- Associate degree: 66
- Bachelor's degree: 1,042
- Master's degree: 413
- Professional school degree: 378
- Doctorate degree: 154
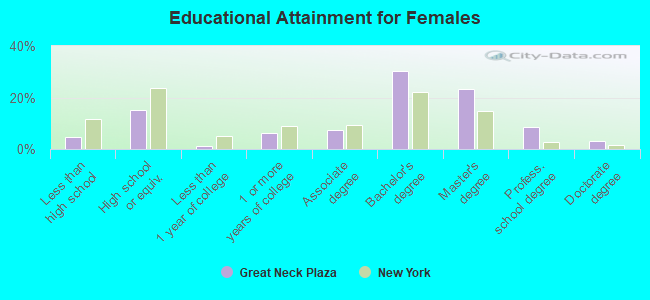
Education attainment for females 25 years and older:
- No schooling: 56
- Nursery to 4th grade: 9
- 5th and 6th grade: 0
- 7th and 8th grade: 8
- 9th grade: 0
- 10th grade: 10
- 11th grade: 47
- 12th grade, no diploma: 27
- High school graduate (or equivalency): 513
- Less than 1 year of college: 39
- Some college more than 1 year, no degree: 216
- Associate degree: 254
- Bachelor's degree: 1,025
- Master's degree: 785
- Professional school degree: 289
- Doctorate degree: 99
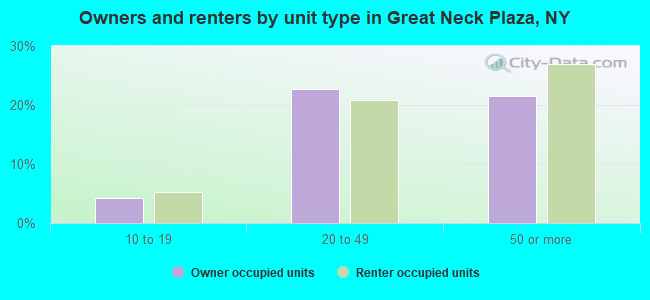
Housing units in structures:
- One, detached: 119
- One, attached: 72
- Two: 27
- 3 or 4: 40
- 5 to 9: 80
- 10 to 19: 282
- 20 to 49: 1,955
- 50 or more: 1,636
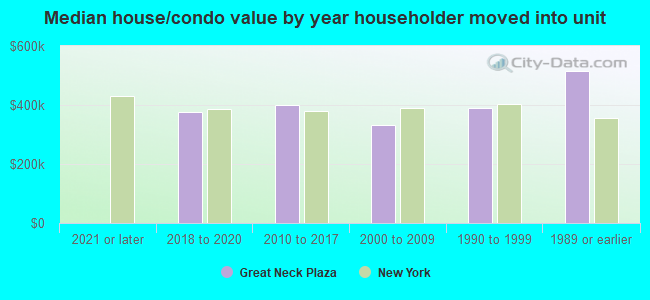
House/condo owner moved in on average 7 years ago
Renter moved in on average 2 years ago
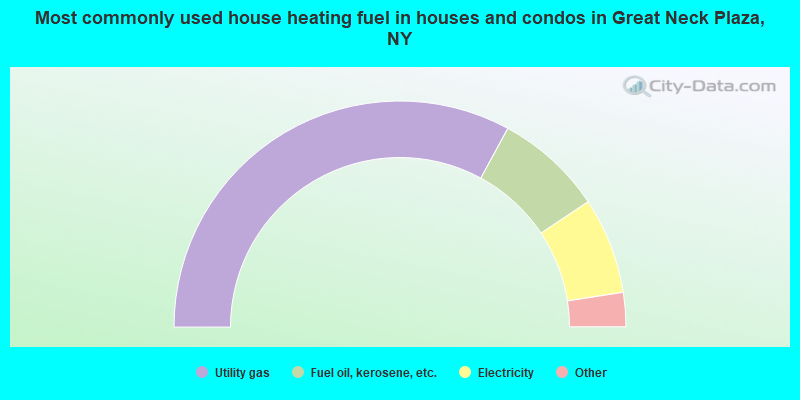
- 65.9%Utility gas
- 15.5%Fuel oil, kerosene, etc.
- 13.8%Electricity
- 2.3%Bottled, tank, or LP gas
- 2.2%Other fuel
- 0.4%No fuel used
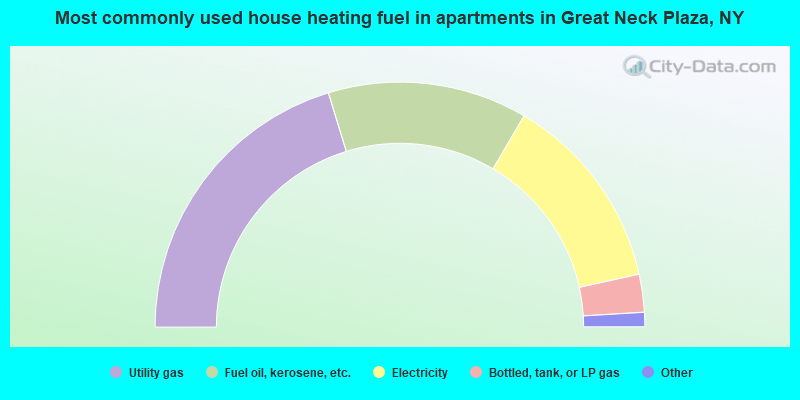
- 40.6%Utility gas
- 26.4%Fuel oil, kerosene, etc.
- 26.2%Electricity
- 5.0%Bottled, tank, or LP gas
- 1.1%Solar energy
- 0.7%No fuel used
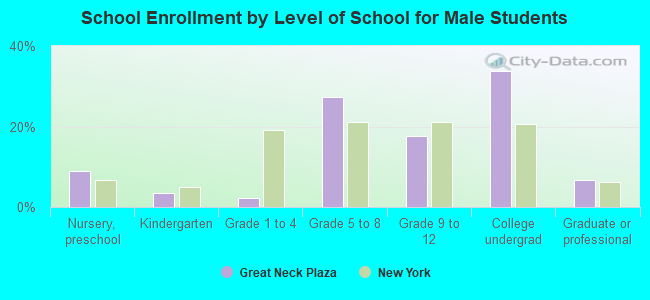
Private vs. public school enrollment:
| Here: | 26.0% |
| New York: | 15.6% |
| Here: | 20.5% |
| New York: | 15.0% |
| Here: | 24.7% |
| New York: | 39.2% |