Green Cove Springs, FL (Florida) Houses and Residents
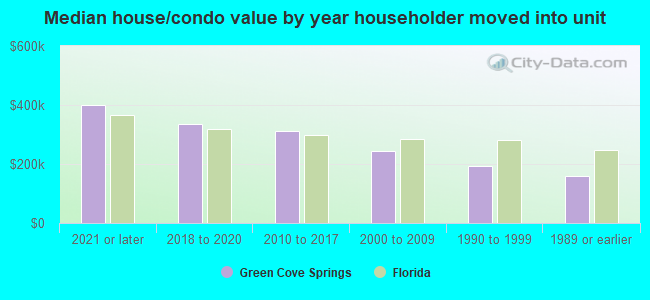
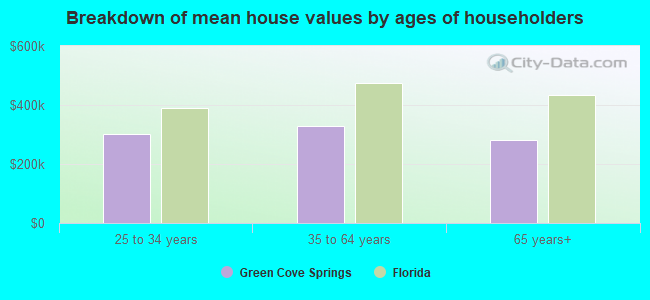
| Green Cove Springs: | $277,261 |
| Florida: | $354,100 |
Total population: 7,109 (Urban population: 4,696, Rural population: 838 (all nonfarm))
Houses: 3,990 (3,627 occupied: 2,861 owner occupied, 870 renter occupied)
| % of renters here: | 23% |
| State: | 33% |
Housing density: 585 houses/condos per square mile
Median price asked for vacant for-sale houses and condos in 2022: $1,087,021.
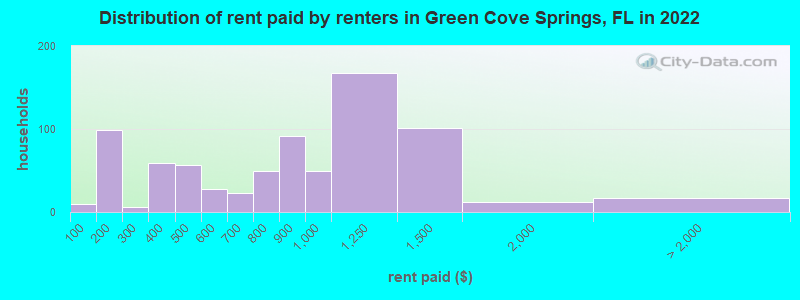
Median contract rent in 2022: $1,000 (lower quartile is $477, upper quartile is $1,335)
Median rent asked for vacant for-rent units in 2022: $2,497
Median gross rent in Green Cove Springs, FL in 2022: $1,061
Housing units in Green Cove Springs with a mortgage: 1,901 (119 second mortgage, 9 home equity loan, 85 both second mortgage and home equity loan)
Houses without a mortgage: 0
Median household income for houses/condos with a mortgage: $85,520
Median household income for apartments without a mortgage: $42,937
Median monthly housing costs: $1,071
Compare current foreclosures in Green Cove Springs, FL:
| Photo | Address | Area | Beds / Baths | Price | Details |
|---|---|---|---|---|---|

|
#1
Sweat Rd
Green Cove Springs, FL 32043
|
1,356 sq. feet
|
2 baths 4 beds |
show details | |

|
#2
Sandhill Rd
Green Cove Springs, FL 32043
|
1,344 sq. feet
|
2 baths 3 beds |
show details | |

|
#3
Eds Ct
Green Cove Springs, FL 32043
|
1,896 sq. feet
|
2 baths 4 beds |
show details | |

|
#4
Hands Dr
Green Cove Springs, FL 32043
|
1,358 sq. feet
|
2 baths 2 beds |
show details | |

|
#5
Southbank Cir
Green Cove Springs, FL 32043
|
2,598 sq. feet
|
2 baths 4 beds |
show details | |

|
#6
County Road 315
Green Cove Springs, FL 32043
|
720 sq. feet
|
1 baths 2 beds |
show details | |

|
#7
Bonaventure Ave
Green Cove Springs, FL 32043
|
1,483 sq. feet
|
2 baths 4 beds |
show details | |

|
#8
Maryland Ave
Green Cove Springs, FL 32043
|
2,220 sq. feet
|
3 baths 3 beds |
show details | |

|
#9
Eaton Rd
Green Cove Springs, FL 32043
|
1,344 sq. feet
|
2 baths 3 beds |
show details | |

|
#10
Ryans Ct
Green Cove Springs, FL 32043
|
1,412 sq. feet
|
2 baths 3 beds |
show details |
| Photo | Address | Area | Beds / Baths | Price | Details |
|---|---|---|---|---|---|

|
#11
Silverado Cir
Green Cove Springs, FL 32043
|
3,051 sq. feet
|
4 baths 4 beds |
show details | |

|
#12
Creekview Dr
Green Cove Springs, FL 32043
|
1,910 sq. feet
|
2 baths 4 beds |
show details | |

|
#13
Glen Oaks Dr
Green Cove Springs, FL 32043
|
2,292 sq. feet
|
3 baths 5 beds |
show details | |

|
#14
Center St
Green Cove Springs, FL 32043
|
1,416 sq. feet
|
2 baths 3 beds |
show details | |

|
#15
Six Pond Trl
Green Cove Springs, FL 32043
|
864 sq. feet
|
1 baths 3 beds |
show details | |

|
#16
Mangrove Ln
Green Cove Springs, FL 32043
|
1,152 sq. feet
|
2 baths 3 beds |
show details | |

|
#17
Friendship Ct
Green Cove Springs, FL 32043
|
2,326 sq. feet
|
3 baths 4 beds |
show details | |

|
#18
Anne Bonney Dr
Green Cove Springs, FL 32043
|
1,102 sq. feet
|
2 baths 3 beds |
show details | |

|
#19
Thunder Rd
Green Cove Springs, FL 32043
|
1,344 sq. feet
|
2 baths 3 beds |
show details | |

|
#20
Canyon Falls Dr
Green Cove Springs, FL 32043
|
1,682 sq. feet
|
2 baths 3 beds |
show details |
| Photo | Address | Area | Beds / Baths | Price | Details |
|---|---|---|---|---|---|

|
#21
Russell Rd
Green Cove Springs, FL 32043
|
1,431 sq. feet
|
2 baths 3 beds |
show details | |

|
#22
Havengate Dr
Green Cove Springs, FL 32043
|
1,909 sq. feet
|
3 baths 4 beds |
show details | |

|
#23
Ridgeview Dr
Green Cove Springs, FL 32043
|
- sq. feet
|
- baths - beds |
show details | |

|
#24
Turkey Creek Dr
Green Cove Springs, FL 32043
|
- sq. feet
|
- baths - beds |
show details | |

|
#25
Julia St
Green Cove Springs, FL 32043
|
- sq. feet
|
- baths - beds |
show details | |

|
#26
Walnut St # 6978
Green Cove Springs, FL 32043
|
2,208 sq. feet
|
- baths - beds |
show details | |

|
#27
Grand Victoria Ct
Green Cove Springs, FL 32043
|
- sq. feet
|
- baths - beds |
show details | |

|
#28
Eagle Bluff Way
Green Cove Springs, FL 32043
|
- sq. feet
|
- baths - beds |
show details | |

|
#29
N Cypress Ave
Green Cove Springs, FL 32043
|
- sq. feet
|
- baths - beds |
show details | |

|
#30
Windsor Lakes Way
Green Cove Springs, FL 32043
|
- sq. feet
|
- baths - beds |
show details |
| Photo | Address | Area | Beds / Baths | Price | Details |
|---|---|---|---|---|---|

|
#31
Silverado Cir
Green Cove Springs, FL 32043
|
- sq. feet
|
- baths - beds |
show details | |

|
#32
Creekview Dr
Green Cove Springs, FL 32043
|
- sq. feet
|
- baths - beds |
show details | |

|
#33
Little Creek Ct
Green Cove Springs, FL 32043
|
- sq. feet
|
- baths - beds |
show details | |

|
#34
Creekview Dr
Green Cove Springs, FL 32043
|
- sq. feet
|
- baths - beds |
show details | |

|
#35
Walnut St # 19304
Green Cove Springs, FL 32043
|
2,208 sq. feet
|
- baths - beds |
show details | |

|
#36
White Cedar Ln
Green Cove Springs, FL 32043
|
- sq. feet
|
- baths - beds |
show details | |

|
#37
Joey Dr Apt 1504
Green Cove Springs, FL 32043
|
- sq. feet
|
- baths - beds |
show details | |

|
#38
White Cedar Ln
Green Cove Springs, FL 32043
|
- sq. feet
|
- baths - beds |
show details | |

|
#39
Cooks Ln
Green Cove Springs, FL 32043
|
- sq. feet
|
- baths - beds |
show details | |

|
Check over 1 million property listings on Foreclosure.com!
|
browse all offers | |||


Median year apartment built: 1992
Household type by relationship:
Households: 10,066- Male householders: 1,803 (318 living alone), Female householders: 1,796 (393 living alone)
1,710 spouses (1,688 opposite-sex spouses), 360 unmarried partners, (360 opposite-sex unmarried partners), 2,822 children (2,701 natural, 35 adopted, 85 stepchildren), 142 grandchildren, 180 brothers or sisters, 189 parents, 0 foster children, 68 other relatives, 502 non-relatives
- In group quarters: 491
Size of family households: 1,250 2-persons, 695 3-persons, 415 4-persons, 128 5-persons, 20 6-persons, 124 7-or-more-persons.
Size of nonfamily households: 798 1-person, 225 2-persons, 34 3-persons, 110 4-persons.
1,027 married couples with children.
839 single-parent households (196 men, 643 women).
92.3% of residents of Green Cove Springs speak English at home.
5.0% of residents speak Spanish at home (78% speak English very well, 13% speak English well, 9% speak English not well).
1.9% of residents speak other Indo-European language at home (51% speak English very well, 40% speak English well, 9% speak English not well).
0.1% of residents speak Asian or Pacific Island language at home (100% speak English well).
0.3% of residents speak other language at home (27% speak English very well, 73% speak English not well).
Foreign born population: 421 (4.2%)
(94.5% of them are naturalized citizens)
| Here: | 6.4 |
| State: | 5.9 |
| Here: | 4.2 |
| State: | 4.2 |
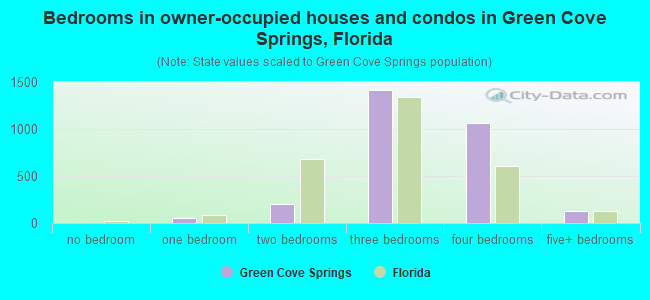
- Bedrooms in owner-occupied houses and condos in Green Cove Springs, Florida
- 0no bedroom
- 521 bedroom
- 2062 bedrooms
- 1,4163 bedrooms
- 1,0634 bedrooms
- 1235+ bedrooms
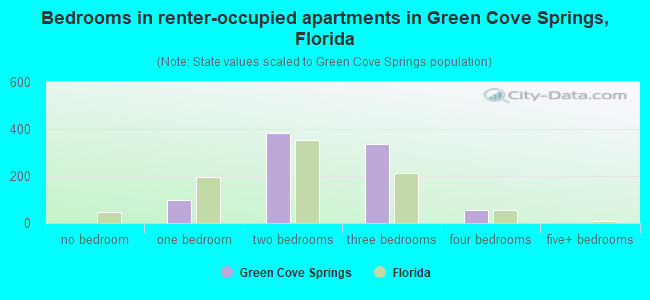
- Bedrooms in renter-occupied apartments in Green Cove Springs, Florida
- 0no bedroom
- 961 bedroom
- 3822 bedrooms
- 3373 bedrooms
- 564 bedrooms
- 05+ bedrooms
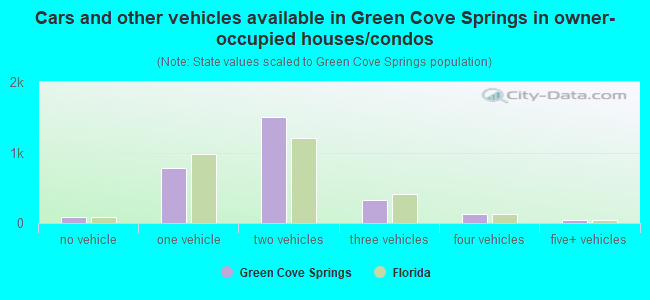
- Cars and other vehicles available in Green Cove Springs in owner-occupied houses/condos
- 83no vehicle
- 7801 vehicle
- 1,4972 vehicles
- 3233 vehicles
- 1304 vehicles
- 475+ vehicles
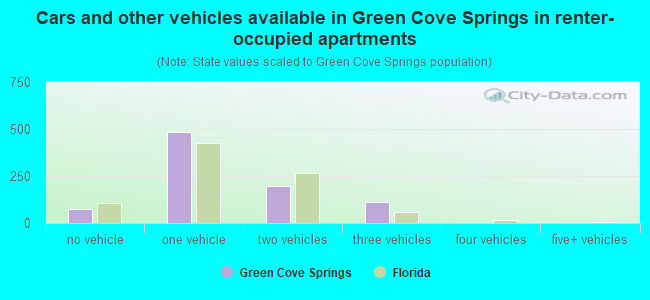
- Cars and other vehicles available in Green Cove Springs in renter-occupied apartments
- 75no vehicle
- 4831 vehicle
- 1992 vehicles
- 1133 vehicles
- 04 vehicles
- 05+ vehicles
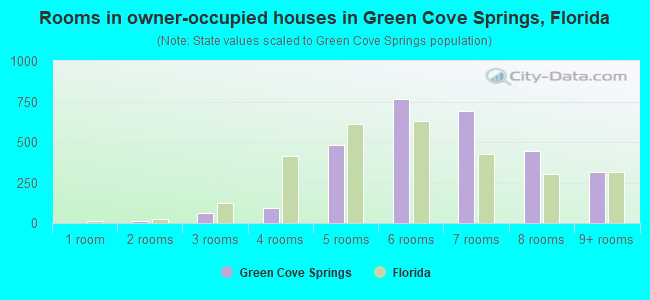
- Rooms in owner-occupied houses in Green Cove Springs, Florida
- 01 room
- 152 rooms
- 623 rooms
- 904 rooms
- 4815 rooms
- 7656 rooms
- 6927 rooms
- 4448 rooms
- 3129+ rooms
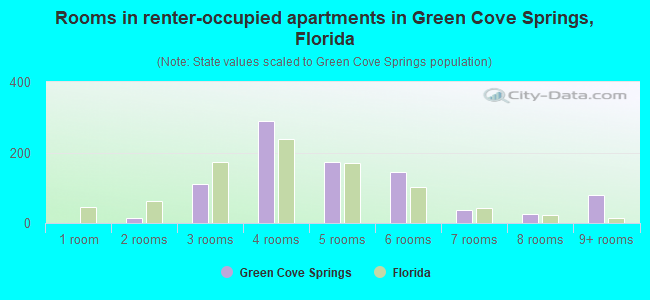
- Rooms in renter-occupied apartments in Green Cove Springs, Florida
- 01 room
- 152 rooms
- 1103 rooms
- 2884 rooms
- 1725 rooms
- 1446 rooms
- 367 rooms
- 268 rooms
- 799+ rooms
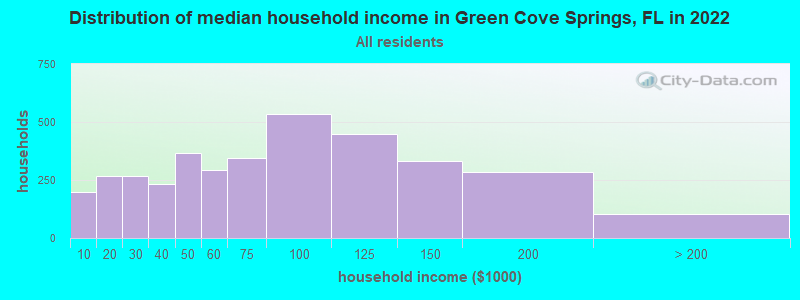
Green Cove Springs, FL household income distribution

- 200Less than $10,000
- 268$10,000 to $19,999
- 268$20,000 to $29,999
- 232$30,000 to $39,999
- 366$40,000 to $49,999
- 295$50,000 to $59,999
- 345$60,000 to $74,999
- 533$75,000 to $99,999
- 448$100,000 to $124,999
- 330$125,000 to $149,999
- 283$150,000 to $199,999
- 104$200,000 or more
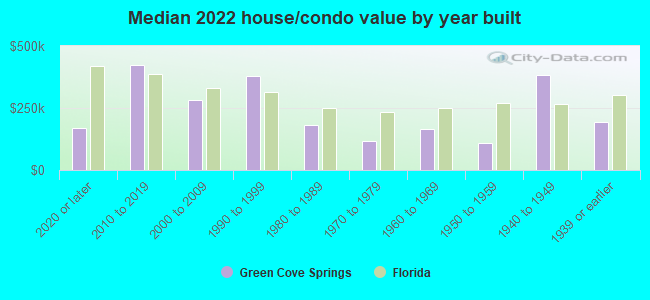
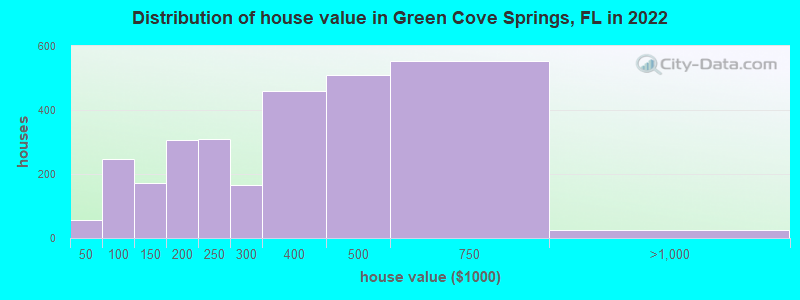
Home value of owner - occupied houses in 2022 in Green Cove Springs, FL
-
- 17$10,000 to $14,999
- 17$25,000 to $29,999
- 21$30,000 to $34,999
- 6$50,000 to $59,999
- 105$60,000 to $69,999
- 62$70,000 to $79,999
- 73$90,000 to $99,999
- 123$100,000 to $124,999
- 47$125,000 to $149,999
- 145$150,000 to $174,999
- 160$175,000 to $199,999
- 310$200,000 to $249,999
- 165$250,000 to $299,999
- 457$300,000 to $399,999
- 509$400,000 to $499,999
- 553$500,000 to $749,999
- 23$750,000 to $999,999
Rent paid by renters in 2022 in Green Cove Springs, FL
-
- 10Less than $100
- 99$100 to $149
- 5$250 to $299
- 59$300 to $349
- 49$400 to $449
- 7$450 to $499
- 28$550 to $599
- 23$600 to $649
- 12$700 to $749
- 38$750 to $799
- 91$800 to $899
- 50$900 to $999
- 166$1,000 to $1,249
- 101$1,250 to $1,499
- 11$1,500 to $1,999
- 16No cash rent
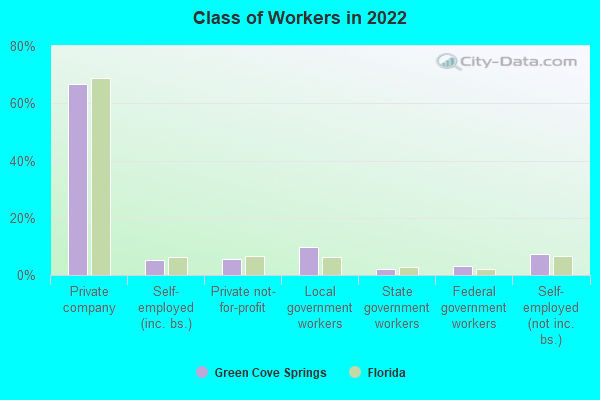
Percentage of workers working in this county: 70.6%
Number of people working at home: 649 (15.9% of all workers)
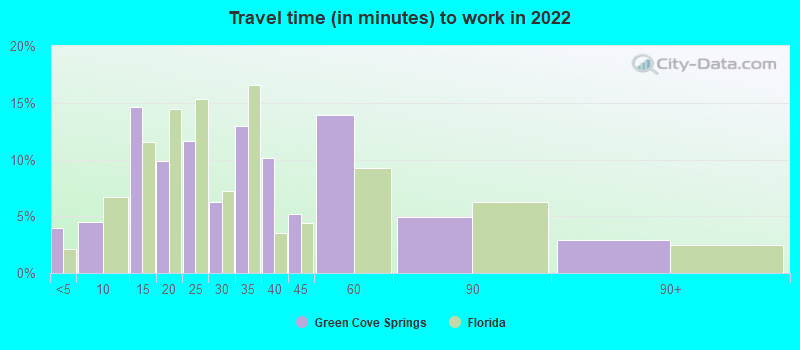
Travel time to work (commute)
- Less than 5 minutes: 324
- 5 to 9 minutes: 327
- 10 to 14 minutes: 681
- 15 to 19 minutes: 433
- 20 to 24 minutes: 277
- 25 to 29 minutes: 92
- 30 to 34 minutes: 337
- 35 to 39 minutes: 50
- 40 to 44 minutes: 143
- 45 to 59 minutes: 416
- 60 to 89 minutes: 363
- 90 or more minutes: 82
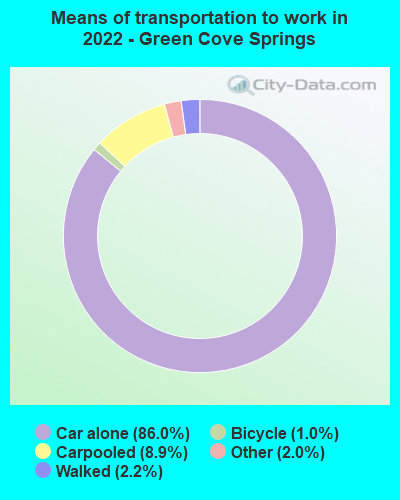
Means of transportation to work:
- Drove a car alone: 4,316 (74.2%)
- Carpooled: 472 (8.1%)
- Taxi: 111 (1.9%)
- Bicycle: 51 (0.9%)
- Walked: 117 (2.0%)
- Worked at home: 649 (11.2%)
- Unemployment by race in 2022
- Unemployment rate for White non-Hispanic residents
- 2.2%Males
- 7.8%Females
- Unemployment rate for Black residents
- 4.0%Males
- Unemployment rate for two or more race residents
- 14.8%Females
- Unemployment rate for Hispanic or Latino residents
- 0.9%Males
- 5.0%Females
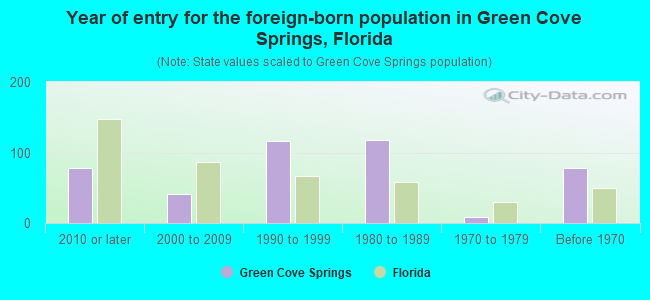
- Year of entry for the foreign-born population in Green Cove Springs, Florida
- 782010 or later
- 412000 to 2009
- 1161990 to 1999
- 1181980 to 1989
- 81970 to 1979
- 78Before 1970
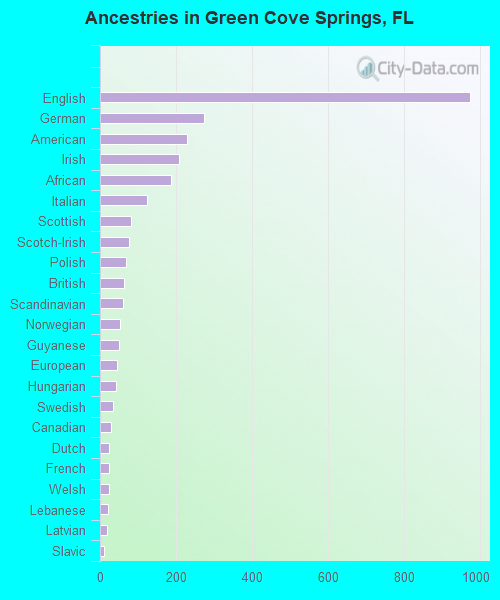
First ancestries reported:
- English: 975 (22.9%)
- German: 275 (6.5%)
- American: 230 (5.4%)
- Irish: 207 (4.9%)
- African: 188 (4.4%)
- Italian: 124 (2.9%)
- Scottish: 82 (1.9%)
- Scotch-Irish: 77 (1.8%)
- Polish: 68 (1.6%)
- British: 64 (1.5%)
- Scandinavian: 61 (1.4%)
- Norwegian: 53 (1.2%)
- Guyanese: 49 (1.2%)
- European: 46 (1.1%)
- Hungarian: 41 (1.0%)
- Swedish: 35 (0.8%)
- Canadian: 30 (0.7%)
- Dutch: 25 (0.6%)
- French: 25 (0.6%)
- Welsh: 25 (0.6%)
- Lebanese: 20 (0.5%)
- Latvian: 18 (0.4%)
- Slavic: 10 (0.2%)
- Armenian: 8 (0.2%)
- Nigerian: 7 (0.2%)
- Haitian: 4 (0.09%)
Most common places of birth for foreign-born residents (%):
| Green Cove Springs: | 24.9% (107) |
| Florida: | 1.1% (49,838) |
| Green Cove Springs: | 17.2% (74) |
| Florida: | 0.1% (3,802) |
| Green Cove Springs: | 13.7% (59) |
| Florida: | 0.7% (33,556) |
| Green Cove Springs: | 10.0% (43) |
| Florida: | 5.6% (257,152) |
| Green Cove Springs: | 7.7% (33) |
| Florida: | 1.2% (54,272) |
| Green Cove Springs: | 5.1% (22) |
| Florida: | 2.1% (96,693) |
| Green Cove Springs: | 4.4% (19) |
| Florida: | 2.1% (94,349) |
| Green Cove Springs: | 3.0% (13) |
| Florida: | 0.0% (1,517) |
| Green Cove Springs: | 3.0% (13) |
| Florida: | 0.1% (5,245) |
| Green Cove Springs: | 2.8% (12) |
| Florida: | 0.6% (25,219) |
| Green Cove Springs: | 2.8% (12) |
| Florida: | 1.0% (43,642) |
| Green Cove Springs: | 2.6% (11) |
| Florida: | 1.8% (84,403) |
| Green Cove Springs: | 2.3% (10) |
| Florida: | 22.0% (1,006,576) |
| Green Cove Springs: | 1.9% (8) |
| Florida: | 0.4% (19,445) |
| Green Cove Springs: | 1.6% (7) |
| Florida: | 1.3% (60,604) |
Place of birth for U.S.-born residents:
- This state: 4,447
- Other state: 4,844
- Northeast: 1,673
- Midwest: 920
- South: 1,800
- West: 459
89.1% of Green Cove Springs residents lived in the same house 1 years ago.
Out of people who lived in different houses, 39.6% lived in this county.
Out of people who lived in different counties, 71.6% lived in Florida.
| Green Cove Springs: | 89.1% |
| State average: | 86.3% |
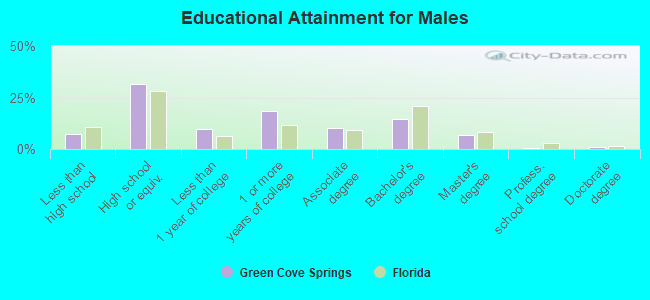
Education attainment for males 25 years and older:
- No schooling: 48
- Nursery to 4th grade: 9
- 5th and 6th grade: 0
- 7th and 8th grade: 23
- 9th grade: 13
- 10th grade: 15
- 11th grade: 16
- 12th grade, no diploma: 122
- High school graduate (or equivalency): 1,090
- Less than 1 year of college: 345
- Some college more than 1 year, no degree: 641
- Associate degree: 356
- Bachelor's degree: 499
- Master's degree: 232
- Professional school degree: 24
- Doctorate degree: 36
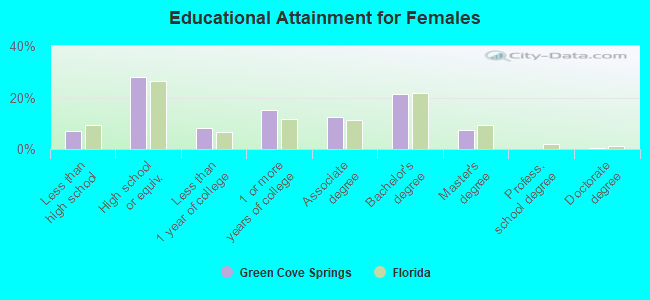
Education attainment for females 25 years and older:
- No schooling: 24
- Nursery to 4th grade: 2
- 5th and 6th grade: 0
- 7th and 8th grade: 29
- 9th grade: 7
- 10th grade: 15
- 11th grade: 131
- 12th grade, no diploma: 45
- High school graduate (or equivalency): 1,012
- Less than 1 year of college: 296
- Some college more than 1 year, no degree: 542
- Associate degree: 448
- Bachelor's degree: 762
- Master's degree: 267
- Professional school degree: 0
- Doctorate degree: 19
Housing units in structures:
- One, detached: 3,502
- One, attached: 51
- 3 or 4: 151
- 5 to 9: 133
- 10 to 19: 31
- 20 to 49: 10
- 50 or more: 21
- Mobile homes: 55
- Boats, RVs, vans, etc.: 32
Housing units lacking complete kitchen facilities in 2022: 3.7%
House/condo owner moved in on average 8 years ago
Renter moved in on average 4 years ago
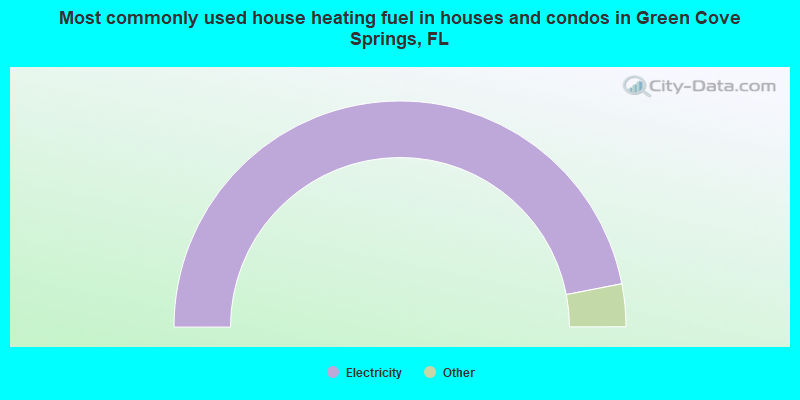
- 93.9%Electricity
- 3.2%Bottled, tank, or LP gas
- 1.3%Utility gas
- 0.9%No fuel used
- 0.6%Fuel oil, kerosene, etc.
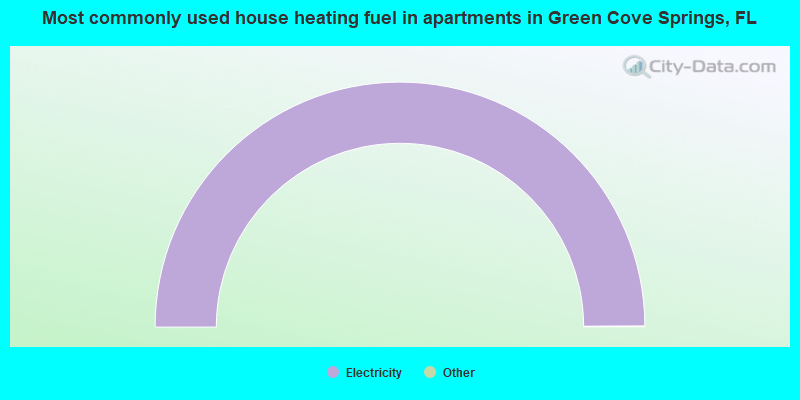
- 100.0%Electricity
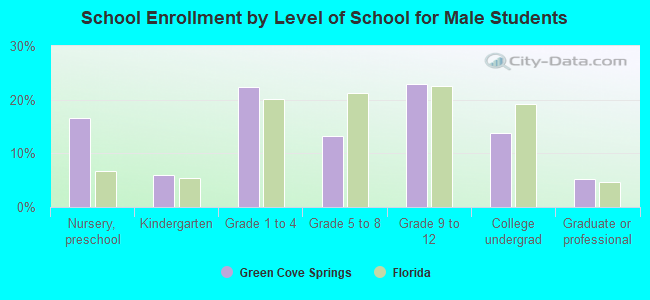
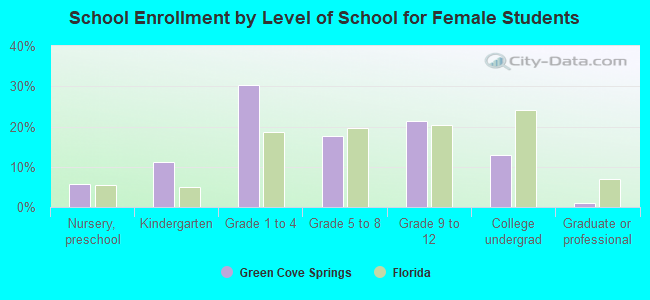
Private vs. public school enrollment:
| Here: | 11.1% |
| Florida: | 15.8% |
| Here: | 30.0% |
| Florida: | 12.9% |
| Here: | 33.6% |
| Florida: | 23.6% |