Housing density: 640 houses/condos per square mile
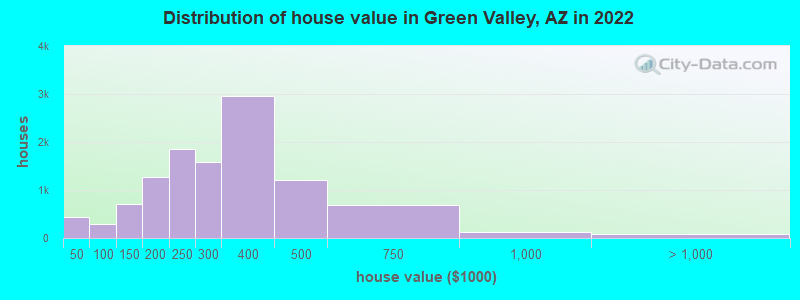
Median price asked for vacant for-sale houses and condos in 2022: $163,195.
Median contract rent in 2022: $1,067 (lower quartile is $781, upper quartile is $1,562)
Median rent asked for vacant for-rent units in 2022: $1,414
Median gross rent in Green Valley, AZ in 2022: $1,198
Housing units in Green Valley with a mortgage: 4,790 (234 second mortgage, 0 home equity loan, 188 both second mortgage and home equity loan) Houses without a mortgage: 125
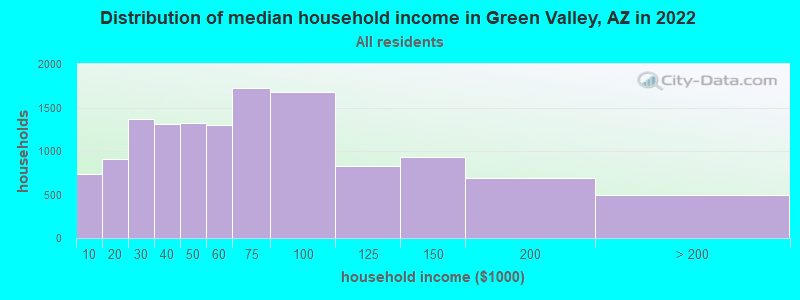
Median household income for houses/condos with a mortgage: $59,922
Median household income for apartments without a mortgage: $61,655
Median monthly housing costs: $632
Compare current foreclosures near Green Valley, AZ:
Size of family households: 6,751 2-persons, 264 3-persons, 41 4-persons, 23 5-persons.
Size of nonfamily households: 5,914 1-person, 608 2-persons, 12 3-persons.
9 married couples with children.
48 single-parent households (0 men, 48 women).
97.2% of residents of Green Valley speak English at home.
3.8% of residents speak Spanish at home (61% speak English very well, 22% speak English well, 11% speak English not well, 6% don't speak English at all).
1.9% of residents speak other Indo-European language at home (60% speak English very well, 38% speak English well, 1% speak English not well).
0.9% of residents speak Asian or Pacific Island language at home (18% speak English very well, 19% speak English well, 63% speak English not well).
0.4% of residents speak other language at home (100% speak English very well).
Foreign born population: 1,714 (8.1%)
(73.0% of them are naturalized citizens)
Percentage of workers working in this county: 93.7% Number of people working at home: 728 (24.6% of all workers)
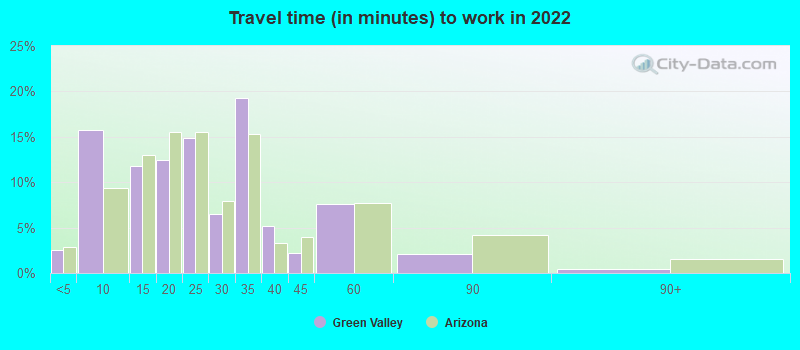
Travel time to work (commute)
Less than 5 minutes: 139
5 to 9 minutes: 389
10 to 14 minutes: 382
15 to 19 minutes: 327
20 to 24 minutes: 232
25 to 29 minutes: 73
30 to 34 minutes: 307
35 to 39 minutes: 86
40 to 44 minutes: 44
45 to 59 minutes: 211
60 to 89 minutes: 79
90 or more minutes: 15
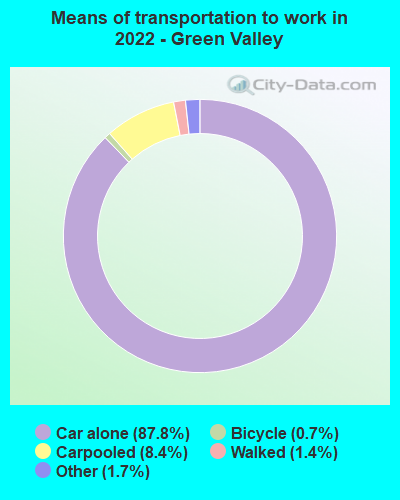
Means of transportation to work:
Drove a car alone: 4,507 (76.5%)
Carpooled: 445 (7.6%)
Taxi: 72 (1.2%)
Bicycle: 31 (0.5%)
Walked: 91 (1.5%)
Worked at home: 728 (12.4%)
Unemployment by race in 2022
Unemployment rate for White non-Hispanic residents
6.4%Males
4.8%Females
Unemployment rate for Black residents
60.4%Females
Unemployment rate for other race residents
24.5%Females
Unemployment rate for two or more race residents
9.8%Females
Unemployment rate for Hispanic or Latino residents
8.7%Females
Year of entry for the foreign-born population in Green Valley, Arizona
3742010 or later
1232000 to 2009
681990 to 1999
361980 to 1989
631970 to 1979
756Before 1970
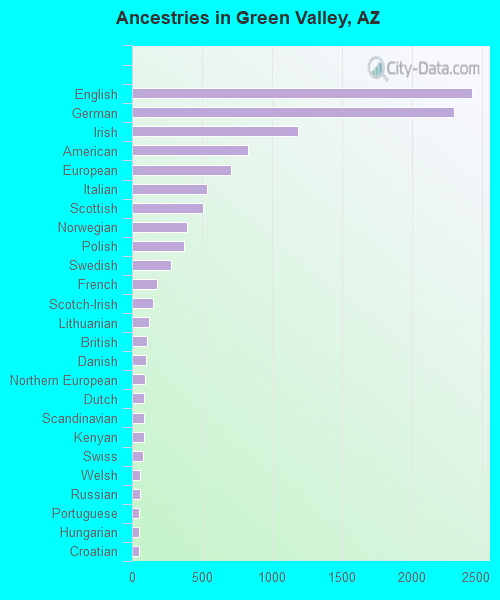
First ancestries reported:
English: 2,432 (19.7%)
German: 2,305 (18.6%)
Irish: 1,189 (9.6%)
American: 827 (6.7%)
European: 709 (5.7%)
Italian: 534 (4.3%)
Scottish: 509 (4.1%)
Norwegian: 394 (3.2%)
Polish: 372 (3.0%)
Swedish: 276 (2.2%)
French: 177 (1.4%)
Scotch-Irish: 153 (1.2%)
Lithuanian: 123 (1.0%)
British: 107 (0.9%)
Danish: 101 (0.8%)
Northern European: 90 (0.7%)
Dutch: 89 (0.7%)
Scandinavian: 87 (0.7%)
Kenyan: 86 (0.7%)
Swiss: 80 (0.6%)
Welsh: 56 (0.5%)
Russian: 54 (0.4%)
Portuguese: 53 (0.4%)
Hungarian: 49 (0.4%)
Croatian: 47 (0.4%)
Czech: 46 (0.4%)
Finnish: 46 (0.4%)
Ukrainian: 46 (0.4%)
Austrian: 41 (0.3%)
French Canadian: 37 (0.3%)
Slavic: 35 (0.3%)
Canadian: 28 (0.2%)
Greek: 25 (0.2%)
Eastern European: 23 (0.2%)
Slovak: 22 (0.2%)
Maltese: 20 (0.2%)
Armenian: 19 (0.2%)
Belgian: 18 (0.1%)
Romanian: 15 (0.1%)
Nigerian: 11 (0.09%)
Iranian: 8 (0.06%)
Pennsylvania German: 8 (0.06%)
Afghan: 7 (0.06%)
Slovene: 5 (0.04%)
Czechoslovakian: 4 (0.03%)
Most common places of birth for foreign-born residents (%):
Mexico
Green Valley:
24.7% (444)
Arizona:
53.4% (500,086)
Canada
Green Valley:
13.0% (233)
Arizona:
4.3% (40,102)
Germany
Green Valley:
7.0% (125)
Arizona:
1.5% (14,058)
Philippines
Green Valley:
5.7% (102)
Arizona:
3.2% (30,378)
United Kingdom, excluding England and Scotland
Green Valley:
5.7% (102)
Arizona:
0.7% (6,565)
England
Green Valley:
5.5% (98)
Arizona:
1.1% (9,889)
Kenya
Green Valley:
2.4% (43)
Arizona:
0.4% (3,500)
Poland
Green Valley:
2.2% (40)
Arizona:
0.5% (5,025)
Czechoslovakia (includes Czech Republic and Slovakia)
Green Valley:
2.1% (37)
Arizona:
0.2% (1,678)
France
Green Valley:
2.1% (37)
Arizona:
0.4% (3,628)
Ireland
Green Valley:
1.9% (34)
Arizona:
0.1% (1,308)
Italy
Green Valley:
1.7% (30)
Arizona:
0.4% (4,190)
Other Eastern Europe
Green Valley:
1.6% (29)
Arizona:
0.3% (2,524)
Iran
Green Valley:
1.6% (29)
Arizona:
0.6% (5,893)
Switzerland
Green Valley:
1.5% (27)
Arizona:
0.1% (993)
Place of birth for U.S.-born residents:
This state: 595
Other state: 18,535
Northeast: 2,901
Midwest: 8,637
South: 2,020
West: 4,823
86.3% of Green Valley residents lived in the same house 1 years ago. Out of people who lived in different houses, 22.9% lived in this county. Out of people who lived in different counties, 6.5% lived in Arizona.
Green Valley:
86.3%
State average:
86.0%
Education attainment for males 25 years and older:
No schooling: 49
Nursery to 4th grade: 0
5th and 6th grade: 15
7th and 8th grade: 45
9th grade: 21
10th grade: 43
11th grade: 30
12th grade, no diploma: 131
High school graduate (or equivalency): 1,697
Less than 1 year of college: 851
Some college more than 1 year, no degree: 1,383
Associate degree: 707
Bachelor's degree: 2,672
Master's degree: 1,335
Professional school degree: 519
Doctorate degree: 312
Education attainment for females 25 years and older:
No schooling: 122
Nursery to 4th grade: 19
5th and 6th grade: 33
7th and 8th grade: 36
9th grade: 6
10th grade: 36
11th grade: 132
12th grade, no diploma: 109
High school graduate (or equivalency): 2,654
Less than 1 year of college: 1,077
Some college more than 1 year, no degree: 1,571
Associate degree: 938
Bachelor's degree: 2,687
Master's degree: 1,794
Professional school degree: 247
Doctorate degree: 142
Housing units in structures:
One, detached: 8,903
One, attached: 5,456
Two: 86
3 or 4: 1,242
5 to 9: 142
10 to 19: 175
20 to 49: 143
50 or more: 220
Mobile homes: 428
Median worth of mobile homes: $152,043
Housing units lacking complete plumbing facilities in 2022: 0.3%
Housing units lacking complete kitchen facilities in 2022: 1.3%