Greenland, NH (New Hampshire) Houses and Residents
| Greenland: | $642,285 |
| New Hampshire: | $384,700 |
Total population: 3,549 (Urban population: 2,114 (1,565 inside urbanized areas, 549 inside urban clusters), Rural population: 1,091 (all nonfarm))
Houses: 1,245 (1,204 occupied: 978 owner occupied, 226 renter occupied)
| % of renters here: | 19% |
| State: | 28% |
Housing density: 119 houses/condos per square mile
Median price asked for vacant for-sale houses and condos in 2022 in this county: $227,726.
Median contract rent in 2022: $1,631 (lower quartile is $1,327, upper quartile is over $2,000)
Median rent asked for vacant for-rent units in 2022: $2,298
Median gross rent in Greenland, NH in 2022: $1,939
Housing units in Greenland with a mortgage: 509 (0 second mortgage, 130 home equity loan, 0 both second mortgage and home equity loan)
Houses without a mortgage: 280
Compare current foreclosures near Greenland, NH:
| Photo | Address | Area | Beds / Baths | Price | Details |
|---|---|---|---|---|---|

|
#1
Brentwood Rd
Exeter, NH 03833
|
2,756 sq. feet
|
2 baths 3 beds |
$419,900
|
show details |

|
#2
Main St
Fremont, NH 03044
|
1,470 sq. feet
|
2 baths 4 beds |
$306,800
|
show details |

|
#3
Old Turnpike Rd
Nottingham, NH 03290
|
4,738 sq. feet
|
3 baths 3 beds |
show details | |

|
#4
Jonathan Ave
Rochester, NH 03839
|
1,130 sq. feet
|
1 baths 2 beds |
show details | |

|
#5
W Whitehall Rd
Amesbury, MA 01913
|
1,593 sq. feet
|
1 baths 3 beds |
show details | |

|
#6
Middle Rd
Dover, NH 03820
|
1,120 sq. feet
|
1 baths 3 beds |
show details | |

|
#7
Frost Hill Rd, C O Gregory Jackman
Eliot, ME 03903
|
3,472 sq. feet
|
3 baths 4 beds |
show details | |

|
#8
Kimball Rd
Amesbury, MA 01913
|
1,792 sq. feet
|
1 baths 3 beds |
show details | |

|
#9
Louise Ln
Fremont, NH 03044
|
1,960 sq. feet
|
2 baths 3 beds |
show details | |

|
#10
Merrill Ave
Amesbury, MA 01913
|
1,467 sq. feet
|
1 baths 3 beds |
show details |
| Photo | Address | Area | Beds / Baths | Price | Details |
|---|---|---|---|---|---|

|
#11
Dock Ln
Salisbury, MA 01952
|
1,667 sq. feet
|
2 baths 3 beds |
show details | |

|
#12
Blake Rd
Epping, NH 03042
|
3,113 sq. feet
|
2 baths 2 beds |
show details | |

|
#13
Chapel St
Dover, NH 03820
|
1,872 sq. feet
|
2 baths 4 beds |
show details | |

|
#14
Dowaliby Ct
Dover, NH 03820
|
1,273 sq. feet
|
1 baths 3 beds |
show details | |

|
#15
Maple St
Amesbury, MA 01913
|
2,186 sq. feet
|
2 baths 4 beds |
show details | |

|
#16
Elm St
Salisbury, MA 01952
|
1,800 sq. feet
|
2 baths 4 beds |
show details | |

|
#17
Northam Dr
Dover, NH 03820
|
1,999 sq. feet
|
2 baths 3 beds |
show details | |

|
#18
Del Logan Dr
Salisbury, MA 01952
|
1,986 sq. feet
|
1 baths 3 beds |
show details | |

|
#19
Brown Ave # 52
Amesbury, MA 01913
|
741 sq. feet
|
1 baths 2 beds |
show details | |

|
#20
Aubin St # 1
Amesbury, MA 01913
|
1,230 sq. feet
|
2 baths 4 beds |
show details |
| Photo | Address | Area | Beds / Baths | Price | Details |
|---|---|---|---|---|---|

|
#21
Whittier Meadows Dr
Amesbury, MA 01913
|
1,344 sq. feet
|
2 baths 2 beds |
show details | |

|
#22
Old Post Rd
York, ME 03909
|
864 sq. feet
|
1 baths 2 beds |
show details | |

|
#23
Smoke St
Nottingham, NH 03290
|
4,452 sq. feet
|
2 baths 3 beds |
show details | |

|
#24
Dearborn Rd
Epping, NH 03042
|
1,768 sq. feet
|
2 baths 3 beds |
show details | |

|
#25
Back River Rd
Dover, NH 03820
|
1,193 sq. feet
|
1 baths 3 beds |
show details | |

|
#26
Lake St
Amesbury, MA 01913
|
2,650 sq. feet
|
2 baths 4 beds |
show details | |

|
#27
Alder St
Exeter, NH 03833
|
952 sq. feet
|
2 baths 2 beds |
show details | |

|
#28
Cedar Point Rd
Durham, NH 03824
|
4,052 sq. feet
|
3 baths 3 beds |
show details | |

|
#29
Adams Park
Rye, NH 03870
|
1,008 sq. feet
|
2 baths 3 beds |
show details | |

|
#30
Mildred Ave
Raymond, NH 03077
|
756 sq. feet
|
2 baths 2 beds |
show details |
| Photo | Address | Area | Beds / Baths | Price | Details |
|---|---|---|---|---|---|

|
#31
Mechanic St Apt 1
Merrimac, MA 01860
|
1,452 sq. feet
|
1 baths 2 beds |
show details | |

|
#32
Market St
Newburyport, MA 01950
|
1,732 sq. feet
|
2 baths 3 beds |
show details | |

|
#33
64th St
Newburyport, MA 01950
|
1,517 sq. feet
|
2 baths 2 beds |
show details | |

|
#34
Munroe St
Newburyport, MA 01950
|
1,815 sq. feet
|
2 baths 3 beds |
show details | |

|
#35
Plum St
Exeter, NH 03833
|
924 sq. feet
|
1 baths 3 beds |
show details | |

|
#36
Wentworth Ter
Dover, NH 03820
|
2,404 sq. feet
|
3 baths 6 beds |
show details | |

|
#37
Piscassic St
Newmarket, NH 03857
|
1,608 sq. feet
|
2 baths 4 beds |
show details | |

|
#38
Ernest Ave Apt 4
Exeter, NH 03833
|
555 sq. feet
|
1 baths 1 beds |
show details | |

|
#39
Storey Ave Apt 2
Newburyport, MA 01950
|
708 sq. feet
|
1 baths 2 beds |
show details | |

|
#40
Harvard St
Exeter, NH 03833
|
1,509 sq. feet
|
1 baths 3 beds |
show details |
| Photo | Address | Area | Beds / Baths | Price | Details |
|---|---|---|---|---|---|

|
#41
Brentwood Rd
Exeter, NH 03833
|
3,683 sq. feet
|
3 baths 4 beds |
show details | |

|
#42
Pond St
Newton, NH 03858
|
- sq. feet
|
2 baths 3 beds |
show details | |

|
#43
Old Merrill St
Amesbury, MA 01913
|
- sq. feet
|
- baths - beds |
show details | |

|
#44
Mccrillis Rd
Nottingham, NH 03290
|
- sq. feet
|
- baths - beds |
show details | |

|
#45
Tall Pines Way
York, ME 03909
|
- sq. feet
|
- baths - beds |
show details | |

|
#46
W Main St Apt 214
Merrimac, MA 01860
|
- sq. feet
|
- baths - beds |
show details | |

|
#47
Millyard Un 14-204
Amesbury, MA 01913
|
- sq. feet
|
- baths - beds |
show details | |

|
#48
State St Apt 8
Newburyport, MA 01950
|
- sq. feet
|
- baths - beds |
show details | |

|
#49
Bass Ln
Kingston, NH 03848
|
- sq. feet
|
- baths - beds |
show details | |

|
Check over 1 million property listings on Foreclosure.com!
|
browse all offers | |||
Latest news about housing in Greenland, NH collected exclusively by city-data.com from local newspapers, TV, and radio stations

 | Where to find period, old homes for sale? (20 replies) |
| Around 95 up to Portsmouth - Looking to buy a house in good school district 475k (11 replies) |
| NH Sale & Income tax offset with property taxes? (150 replies) |
| Which is better for retirees - ME or NH? (8 replies) |
| Best safe towns for commute to Portsmouth NH (34 replies) |
| Moving to southeast NH, looking for suggestions (22 replies) |

Household type by relationship:
Households: 292,725- In family households: 247,693 (57,848 male householders, 21,984 female householders)
64,858 spouses, 85,601 children (80,134 natural, 2,077 adopted, 3,390 stepchildren), 3,954 grandchildren, 1,562 brothers or sisters, 2,352 parents, foster children, 1,664 other relatives, 5,842 non-relatives
- In nonfamily households: 45,032 (17,024 male householders (12,402 living alone)), 18,177 female householders (14,574 living alone)), 9,831 nonrelatives
- In group quarters: 2,498 (1,438 institutionalized population)
57,723 married couples with children.
11,266 single-parent households (3,032 men, 8,234 women).
95.5% of residents of Greenland speak English at home.
1.6% of residents speak Spanish at home (70% speak English very well, 30% speak English not well).
1.6% of residents speak other Indo-European language at home (100% speak English very well).
1.4% of residents speak Asian or Pacific Island language at home (56% speak English very well, 17% speak English well, 27% speak English not well).
Foreign born population: 198 (5.4%)
(51.5% of them are naturalized citizens)
| Here: | 6.5 |
| State: | 6.4 |
| Here: | 3.8 |
| State: | 4.0 |

- Bedrooms in owner-occupied houses and condos in Greenland, New Hampshire
- 0no bedroom
- 191 bedroom
- 1612 bedrooms
- 4743 bedrooms
- 2594 bedrooms
- 655+ bedrooms

- Bedrooms in renter-occupied apartments in Greenland, New Hampshire
- 0no bedroom
- 391 bedroom
- 1392 bedrooms
- 433 bedrooms
- 54 bedrooms
- 05+ bedrooms

- Cars and other vehicles available in Greenland in owner-occupied houses/condos
- 37no vehicle
- 1561 vehicle
- 5042 vehicles
- 2213 vehicles
- 424 vehicles
- 185+ vehicles

- Cars and other vehicles available in Greenland in renter-occupied apartments
- 33no vehicle
- 561 vehicle
- 982 vehicles
- 393 vehicles
- 04 vehicles
- 05+ vehicles

- Rooms in owner-occupied houses in Greenland, New Hampshire
- 01 room
- 02 rooms
- 03 rooms
- 684 rooms
- 1675 rooms
- 1806 rooms
- 1767 rooms
- 1698 rooms
- 2189+ rooms

- Rooms in renter-occupied apartments in Greenland, New Hampshire
- 01 room
- 122 rooms
- 273 rooms
- 794 rooms
- 755 rooms
- 176 rooms
- 117 rooms
- 08 rooms
- 59+ rooms


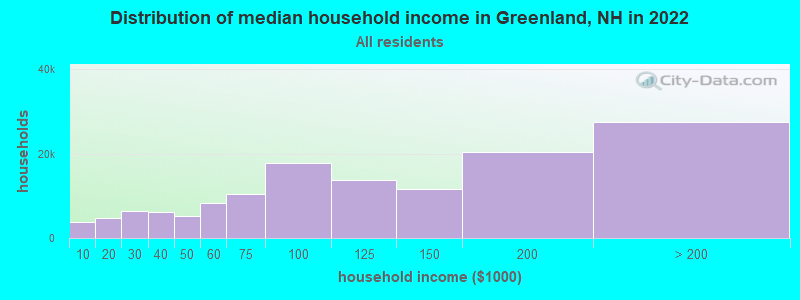
Greenland, NH household income distribution

- 3,793Less than $10,000
- 4,666$10,000 to $19,999
- 6,506$20,000 to $29,999
- 6,120$30,000 to $39,999
- 5,210$40,000 to $49,999
- 8,377$50,000 to $59,999
- 10,497$60,000 to $74,999
- 17,685$75,000 to $99,999
- 13,658$100,000 to $124,999
- 11,610$125,000 to $149,999
- 20,440$150,000 to $199,999
- 27,532$200,000 or more
Percentage of workers working in this county: 94.1%
Number of people working at home: 409 (20.6% of all workers)
Travel time to work (commute)
- Less than 5 minutes: 60
- 5 to 9 minutes: 175
- 10 to 14 minutes: 334
- 15 to 19 minutes: 431
- 20 to 24 minutes: 216
- 25 to 29 minutes: 49
- 30 to 34 minutes: 124
- 35 to 39 minutes: 12
- 40 to 44 minutes: 15
- 45 to 59 minutes: 48
- 60 to 89 minutes: 82
- 90 or more minutes: 46
Means of transportation to work:
- Drove a car alone: 1,501 (88.4%)
- Carpooled: 59 (3.5%)
- Bus or trolley bus: 25 (1.5%)
- Other means: 7 (0.4%)
- Worked at home: 106 (6.2%)


- Year of entry for the foreign-born population in Greenland, New Hampshire
- 171995 to March 2000
- 111990 to 1994
- 241985 to 1989
- 01980 to 1984
- 101975 to 1979
- 71970 to 1974
- 01965 to 1969
- 52Before 1965

First ancestries reported:
- English: 673 (17.7%)
- Irish: 663 (17.4%)
- German: 444 (11.6%)
- Italian: 383 (10.0%)
- Other: 355 (9.3%)
- French: 267 (7.0%)
- French Canadian: 197 (5.2%)
- Scottish: 167 (4.4%)
- United States: 144 (3.8%)
- Polish: 81 (2.1%)
- Norwegian: 57 (1.5%)
- Swedish: 55 (1.4%)
- Dutch: 54 (1.4%)
- Scotch-Irish: 53 (1.4%)
- Greek: 51 (1.3%)
- Hungarian: 44 (1.2%)
- Portuguese: 40 (1.0%)
- Lithuanian: 38 (1.0%)
- Welsh: 20 (0.5%)
- Russian: 8 (0.2%)
- West Indian: 8 (0.2%)
- Danish: 6 (0.2%)
- Czech: 5 (0.1%)
Most common places of birth for foreign-born residents (%):
| Greenland: | 22.3% (27) |
| New Hampshire: | 22.9% (12,397) |
| Greenland: | 10.7% (13) |
| New Hampshire: | 2.9% (1,582) |
| Greenland: | 9.9% (12) |
| New Hampshire: | 0.6% (314) |
| Greenland: | 8.3% (10) |
| New Hampshire: | 0.5% (252) |
| Greenland: | 6.6% (8) |
| New Hampshire: | 0.3% (171) |
| Greenland: | 6.6% (8) |
| New Hampshire: | 0.3% (158) |
| Greenland: | 5.8% (7) |
| New Hampshire: | 1.3% (706) |
| Greenland: | 5.0% (6) |
| New Hampshire: | 4.9% (2,670) |
| Greenland: | 5.0% (6) |
| New Hampshire: | 1.9% (1,031) |
| Greenland: | 4.1% (5) |
| New Hampshire: | 8.1% (4,396) |
| Greenland: | 4.1% (5) |
| New Hampshire: | 1.5% (837) |
| Greenland: | 4.1% (5) |
| New Hampshire: | 1.7% (931) |
| Greenland: | 4.1% (5) |
| New Hampshire: | 3.4% (1,828) |
| Greenland: | 3.3% (4) |
| New Hampshire: | 0.2% (83) |
Place of birth for U.S.-born residents:
- This state: 1,429
- Other state: 1,617
- Northeast: 1,143
- Midwest: 198
- South: 171
- West: 105
58% of Greenland residents lived in the same house 5 years ago.
Out of people who lived in different houses, 60% lived in this county.
Out of people who lived in different counties, 21% lived in New Hampshire.
Education attainment for males 25 years and older:
- No schooling: 0
- Nursery to 4th grade: 0
- 5th and 6th grade: 0
- 7th and 8th grade: 20
- 9th grade: 11
- 10th grade: 29
- 11th grade: 0
- 12th grade, no diploma: 19
- High school graduate (or equivalency): 264
- Less than 1 year of college: 94
- Some college more than 1 year, no degree: 134
- Associate degree: 116
- Bachelor's degree: 242
- Master's degree: 73
- Professional school degree: 63
- Doctorate degree: 6

Education attainment for females 25 years and older:
- No schooling: 0
- Nursery to 4th grade: 0
- 5th and 6th grade: 0
- 7th and 8th grade: 16
- 9th grade: 18
- 10th grade: 11
- 11th grade: 4
- 12th grade, no diploma: 26
- High school graduate (or equivalency): 335
- Less than 1 year of college: 41
- Some college more than 1 year, no degree: 144
- Associate degree: 122
- Bachelor's degree: 314
- Master's degree: 106
- Professional school degree: 12
- Doctorate degree: 0


Housing units in structures:
- One, detached: 964
- One, attached: 77
- Two: 153
- 3 or 4: 17
- 5 to 9: 21
- 10 to 19: 7
- Mobile homes: 6
Median worth of mobile homes: $92,935

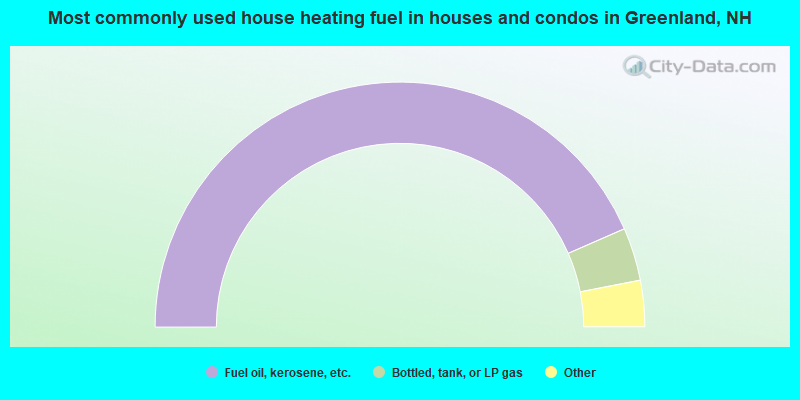
- 86.9%Fuel oil, kerosene, etc.
- 7.0%Bottled, tank, or LP gas
- 3.1%Electricity
- 1.8%Wood
- 1.2%Utility gas
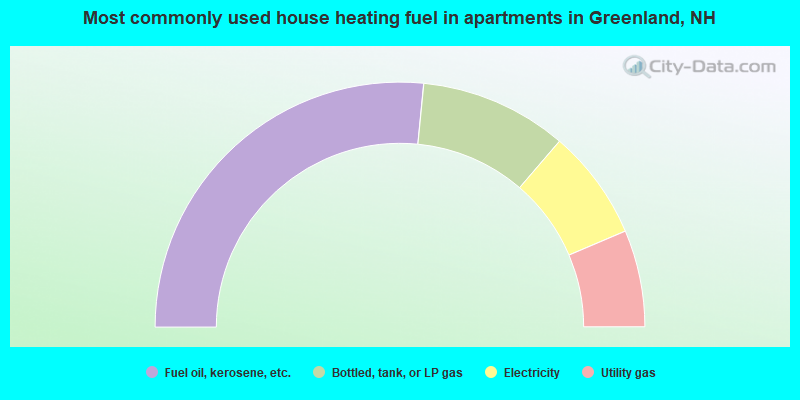
- 53.1%Fuel oil, kerosene, etc.
- 19.5%Bottled, tank, or LP gas
- 14.6%Electricity
- 12.8%Utility gas
Private vs. public school enrollment:
| Here: | 18.5% |
| New Hampshire: | 8.9% |
| Here: | 33.6% |
| New Hampshire: | 10.7% |
| Here: | 35.8% |
| New Hampshire: | 36.4% |


