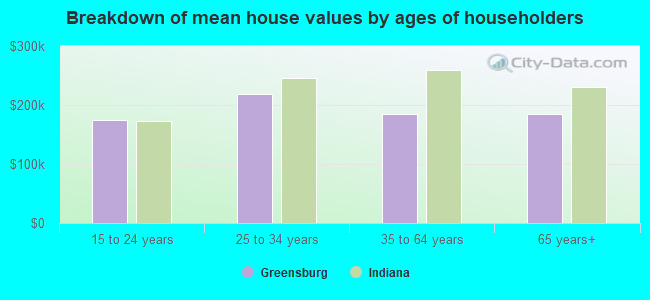
Greensburg, IN (Indiana) Houses and Residents
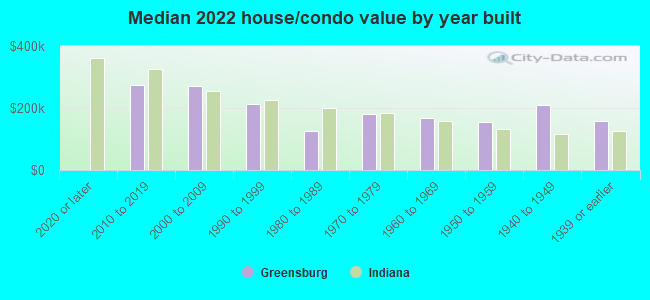
| Greensburg: | $182,783 |
| Indiana: | $208,700 |
Total population: 11,817 (Urban population: 10,296 (all inside urban clusters), Rural population: 25 (all nonfarm))
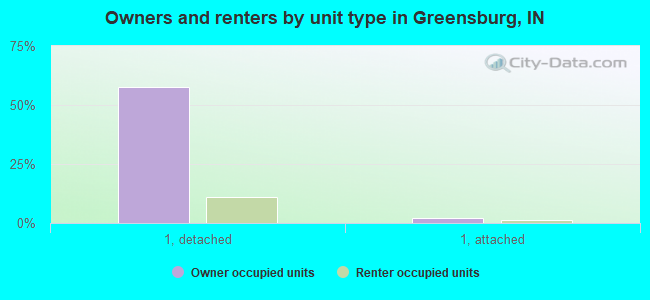
Houses: 5,389 (4,959 occupied: 2,997 owner occupied, 2,021 renter occupied)
| % of renters here: | 40% |
| State: | 29% |
Housing density: 1,124 houses/condos per square mile
Median price asked for vacant for-sale houses and condos in 2022: $121,754.
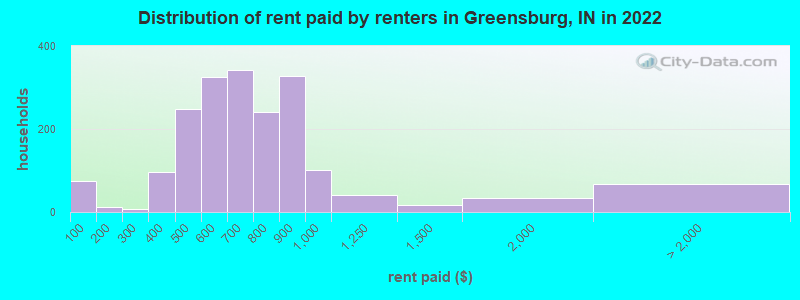
Median contract rent in 2022: $657 (lower quartile is $503, upper quartile is $855)
Median rent asked for vacant for-rent units in 2022: $729
Median gross rent in Greensburg, IN in 2022: $807
Housing units in Greensburg with a mortgage: 1,891 (302 second mortgage, 0 home equity loan, 284 both second mortgage and home equity loan)
Houses without a mortgage: 74
Median household income for houses/condos with a mortgage: $77,105
Median household income for apartments without a mortgage: $61,903
Median monthly housing costs: $828
Compare current foreclosures near Greensburg, IN:
| Photo | Address | Area | Beds / Baths | Price | Details |
|---|---|---|---|---|---|

|
#1
N Amrhein Dr
Greensburg, IN 47240
|
1,656 sq. feet
|
2 baths 4 beds |
show details | |

|
#2
W Main St
Greensburg, IN 47240
|
998 sq. feet
|
1 baths 2 beds |
show details | |

|
#3
E Washington St
Greensburg, IN 47240
|
1,123 sq. feet
|
1 baths 2 beds |
show details | |

|
#4
W 3rd St
Greensburg, IN 47240
|
1,092 sq. feet
|
1 baths 3 beds |
show details | |

|
#5
W Walnut St
Greensburg, IN 47240
|
981 sq. feet
|
1 baths 2 beds |
show details | |

|
#6
Nicklas Ct
Greensburg, IN 47240
|
2,363 sq. feet
|
2 baths 3 beds |
show details | |

|
#7
S Poplar St
Greensburg, IN 47240
|
1,748 sq. feet
|
1 baths 3 beds |
show details | |

|
#8
S Broadway St
Greensburg, IN 47240
|
1,022 sq. feet
|
1 baths 2 beds |
show details | |

|
#9
S County Road 60 SW
Greensburg, IN 47240
|
1,008 sq. feet
|
1 baths 2 beds |
show details | |

|
#10
W 5th St
Greensburg, IN 47240
|
864 sq. feet
|
1 baths 2 beds |
show details |
| Photo | Address | Area | Beds / Baths | Price | Details |
|---|---|---|---|---|---|

|
#11
S County Road 700 W
Greensburg, IN 47240
|
1,564 sq. feet
|
1 baths 4 beds |
show details | |

|
#12
S Monfort St
Greensburg, IN 47240
|
896 sq. feet
|
- baths 2 beds |
show details | |

|
#13
W Trimble St
Greensburg, IN 47240
|
- sq. feet
|
- baths - beds |
show details | |

|
#14
E Nightingale Dr
Greensburg, IN 47240
|
- sq. feet
|
- baths - beds |
show details | |

|
#15
E County Road 640 N
Greensburg, IN 47240
|
- sq. feet
|
- baths - beds |
show details | |

|
#16
E Colonial Manor Dr Apt 304
Greensburg, IN 47240
|
- sq. feet
|
- baths - beds |
show details | |

|
#17
W County Road 1200 N
Greensburg, IN 47240
|
- sq. feet
|
- baths - beds |
show details | |

|
#18
N Oakmont Ave
Greensburg, IN 47240
|
- sq. feet
|
- baths - beds |
show details | |

|
#19
W County Road 200 S
Greensburg, IN 47240
|
- sq. feet
|
- baths - beds |
show details | |

|
#20
W Base Rd
Greensburg, IN 47240
|
- sq. feet
|
- baths - beds |
show details |
| Photo | Address | Area | Beds / Baths | Price | Details |
|---|---|---|---|---|---|

|
#21
NE Chippewa Trl
Greensburg, IN 47240
|
- sq. feet
|
- baths - beds |
show details | |

|
#22
E North St
Greensburg, IN 47240
|
- sq. feet
|
- baths - beds |
show details | |

|
#23
Northgate Dr Apt D
Greensburg, IN 47240
|
- sq. feet
|
- baths - beds |
show details | |

|
#24
W Freedom St # B
Greensburg, IN 47240
|
- sq. feet
|
- baths - beds |
show details | |

|
#25
W Briarwood Way Apt E
Greensburg, IN 47240
|
- sq. feet
|
- baths - beds |
show details | |

|
#26
W Edgewater Dr Apt D
Greensburg, IN 47240
|
- sq. feet
|
- baths - beds |
show details | |

|
#27
W Tarkington Dr # A
Greensburg, IN 47240
|
- sq. feet
|
- baths - beds |
show details | |

|
#28
E State Road 46
Greensburg, IN 47240
|
- sq. feet
|
- baths - beds |
show details | |

|
#29
Pine Grove Dr
Batesville, IN 47006
|
2,824 sq. feet
|
3 baths 5 beds |
show details | |

|
#30
E Morris Firehouse Rd
Batesville, IN 47006
|
1,792 sq. feet
|
1 baths 4 beds |
show details |
| Photo | Address | Area | Beds / Baths | Price | Details |
|---|---|---|---|---|---|

|
#31
W County Road 1200 S
Westport, IN 47283
|
1,705 sq. feet
|
1 baths 3 beds |
show details | |

|
#32
N Newbern Rd
Columbus, IN 47203
|
2,064 sq. feet
|
2 baths 3 beds |
show details | |

|
#33
Schaefer Dr
Hope, IN 47246
|
960 sq. feet
|
1 baths 3 beds |
show details | |

|
#34
Locust St
Hope, IN 47246
|
1,675 sq. feet
|
3 baths 3 beds |
show details | |

|
#35
E Us Highway 52
Rushville, IN 46173
|
2,064 sq. feet
|
2 baths 3 beds |
show details | |

|
#36
Elm St
Hope, IN 47246
|
1,068 sq. feet
|
1 baths 2 beds |
show details | |

|
#37
Walnut St
Hope, IN 47246
|
1,470 sq. feet
|
1 baths 3 beds |
show details | |

|
#38
Northside Dr
Batesville, IN 47006
|
1,422 sq. feet
|
2 baths 2 beds |
show details | |

|
#39
E Lake Shore Dr S
Hope, IN 47246
|
2,912 sq. feet
|
2 baths 4 beds |
show details | |

|
#40
Belmont Pl W
Batesville, IN 47006
|
1,511 sq. feet
|
2 baths 3 beds |
show details |
| Photo | Address | Area | Beds / Baths | Price | Details |
|---|---|---|---|---|---|

|
#41
S Flatrock River Rd
Rushville, IN 46173
|
1,750 sq. feet
|
1 baths 3 beds |
show details | |

|
#42
N Us Highway 421
Osgood, IN 47037
|
1,768 sq. feet
|
2 baths 3 beds |
show details | |

|
#43
S Walnut St
Batesville, IN 47006
|
2,784 sq. feet
|
1 baths 3 beds |
show details | |

|
#44
W County Road 750 N
Saint Paul, IN 47272
|
2,458 sq. feet
|
1 baths 4 beds |
show details | |

|
#45
W 700 S
Rushville, IN 46173
|
1,600 sq. feet
|
2 baths 3 beds |
show details | |

|
#46
E River Bend Ct
Saint Paul, IN 47272
|
1,040 sq. feet
|
1 baths 3 beds |
show details | |

|
#47
S West St
Westport, IN 47283
|
1,024 sq. feet
|
1 baths 2 beds |
show details | |

|
#48
N County Road 200 W
Osgood, IN 47037
|
1,512 sq. feet
|
2 baths - beds |
show details | |

|
#49
Central Ave
Batesville, IN 47006
|
- sq. feet
|
- baths - beds |
show details | |

|
Check over 1 million property listings on Foreclosure.com!
|
browse all offers | |||

Latest news about housing in Greensburg, IN collected exclusively by city-data.com from local newspapers, TV, and radio stations

 | Columbus, IN rental homes? (3 replies) |
| Current articles on US growth trends and how it relates to Indianapolis (37 replies) |
| Southern Indiana, not sure where to start (10 replies) |
| Needing to relocate - Greensburg looks good ... (13 replies) |
| Indiana...a depressing place to live?? (350 replies) |
| Greensburg home for sale - advice? (4 replies) |

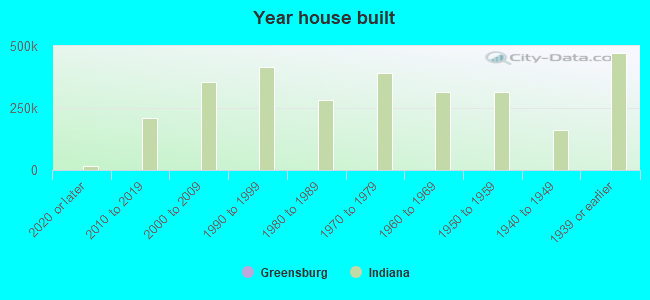
Median year apartment built: 1980
Household type by relationship:
Households: 11,512- Male householders: 2,533 (531 living alone), Female householders: 2,385 (1,118 living alone)
2,139 spouses (2,119 opposite-sex spouses), 398 unmarried partners, (398 opposite-sex unmarried partners), 2,968 children (2,367 natural, 40 adopted, 559 stepchildren), 299 grandchildren, 28 brothers or sisters, 31 parents, 0 foster children, 39 other relatives, 260 non-relatives
- In group quarters: 429
Size of family households: 1,367 2-persons, 715 3-persons, 486 4-persons, 238 5-persons, 66 6-persons, 42 7-or-more-persons.
Size of nonfamily households: 1,692 1-person, 402 2-persons, 10 3-persons.
1,538 married couples with children.
438 single-parent households (63 men, 375 women).
95.5% of residents of Greensburg speak English at home.
2.3% of residents speak Spanish at home (89% speak English very well, 11% speak English well).
1.3% of residents speak other Indo-European language at home (100% speak English very well).
0.4% of residents speak Asian or Pacific Island language at home (100% speak English very well).
Foreign born population: 302 (2.6%)
(22.2% of them are naturalized citizens)
| Here: | 6.3 |
| State: | 6.6 |
| Here: | 4.0 |
| State: | 4.3 |
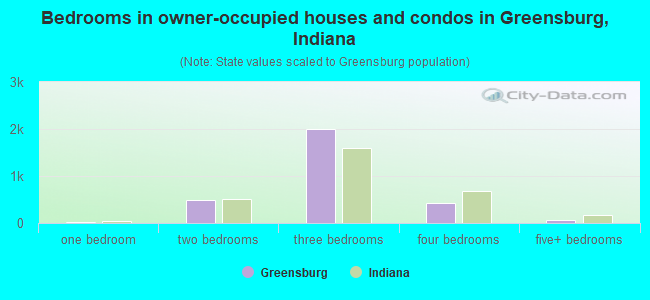
- Bedrooms in owner-occupied houses and condos in Greensburg, Indiana
- 0no bedroom
- 221 bedroom
- 4862 bedrooms
- 1,9903 bedrooms
- 4294 bedrooms
- 705+ bedrooms
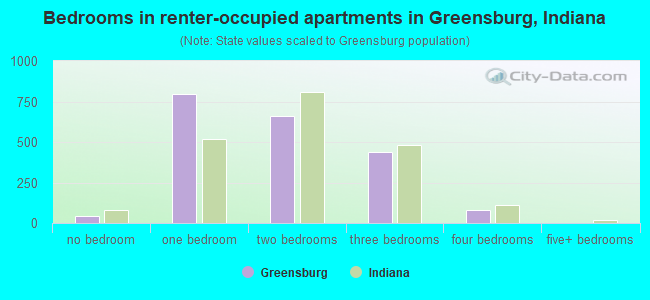
- Bedrooms in renter-occupied apartments in Greensburg, Indiana
- 46no bedroom
- 7971 bedroom
- 6592 bedrooms
- 4393 bedrooms
- 804 bedrooms
- 05+ bedrooms
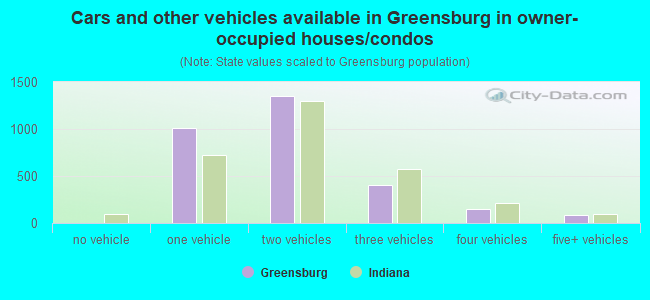
- Cars and other vehicles available in Greensburg in owner-occupied houses/condos
- 5no vehicle
- 1,0071 vehicle
- 1,3512 vehicles
- 4023 vehicles
- 1504 vehicles
- 825+ vehicles
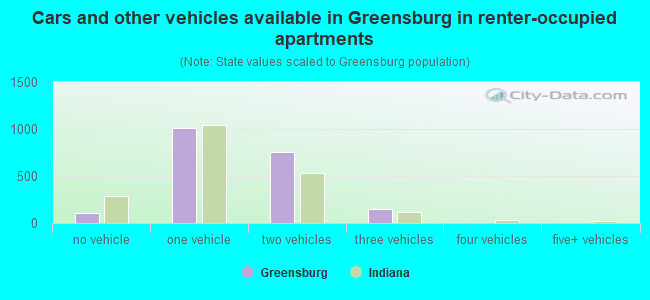
- Cars and other vehicles available in Greensburg in renter-occupied apartments
- 109no vehicle
- 1,0121 vehicle
- 7552 vehicles
- 1453 vehicles
- 04 vehicles
- 05+ vehicles
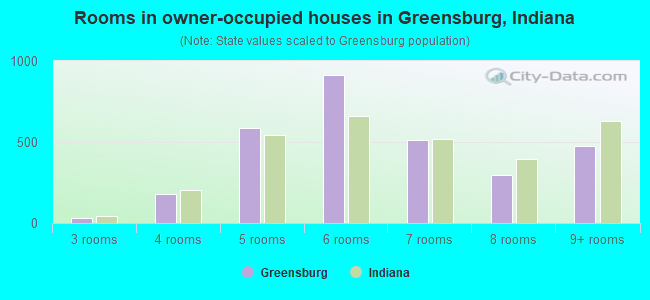
- Rooms in owner-occupied houses in Greensburg, Indiana
- 01 room
- 02 rooms
- 323 rooms
- 1774 rooms
- 5845 rooms
- 9156 rooms
- 5147 rooms
- 2988 rooms
- 4789+ rooms
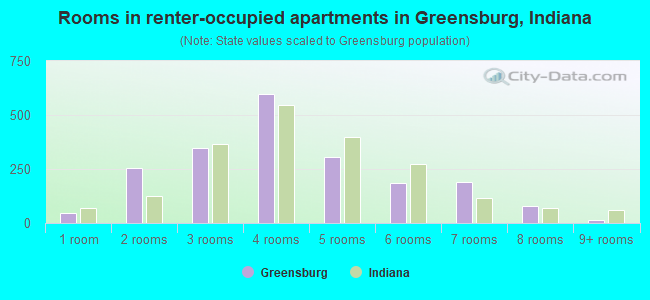
- Rooms in renter-occupied apartments in Greensburg, Indiana
- 461 room
- 2562 rooms
- 3483 rooms
- 5964 rooms
- 3065 rooms
- 1866 rooms
- 1887 rooms
- 788 rooms
- 169+ rooms
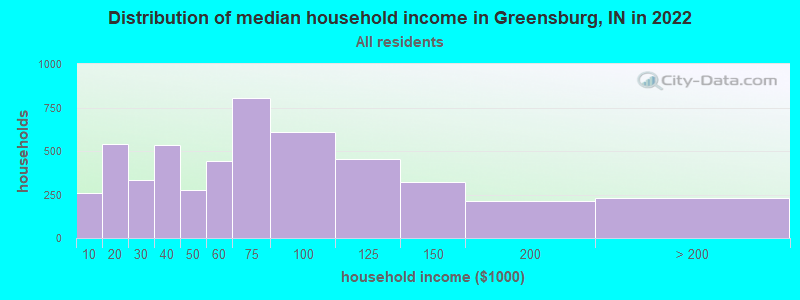
Greensburg, IN household income distribution

- 260Less than $10,000
- 541$10,000 to $19,999
- 334$20,000 to $29,999
- 533$30,000 to $39,999
- 274$40,000 to $49,999
- 445$50,000 to $59,999
- 805$60,000 to $74,999
- 608$75,000 to $99,999
- 452$100,000 to $124,999
- 324$125,000 to $149,999
- 210$150,000 to $199,999
- 232$200,000 or more
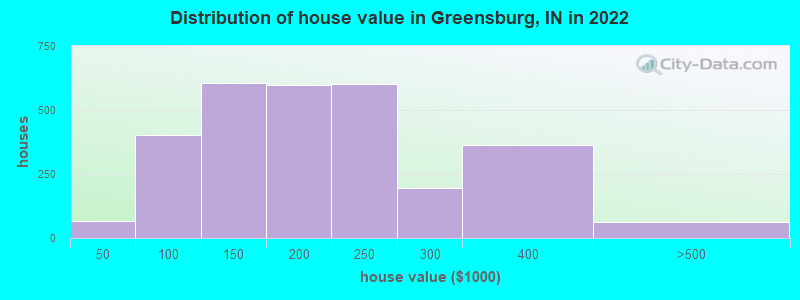
Home value of owner - occupied houses in 2022 in Greensburg, IN
-
- 42Less than $10,000
- 16$15,000 to $19,999
- 8$40,000 to $49,999
- 57$50,000 to $59,999
- 94$60,000 to $69,999
- 55$70,000 to $79,999
- 55$80,000 to $89,999
- 130$90,000 to $99,999
- 392$100,000 to $124,999
- 213$125,000 to $149,999
- 447$150,000 to $174,999
- 150$175,000 to $199,999
- 601$200,000 to $249,999
- 194$250,000 to $299,999
- 364$300,000 to $399,999
- 50$400,000 to $499,999
- 9$500,000 to $749,999
Rent paid by renters in 2022 in Greensburg, IN
-
- 73Less than $100
- 10$100 to $149
- 8$250 to $299
- 95$350 to $399
- 127$400 to $449
- 119$450 to $499
- 249$500 to $549
- 76$550 to $599
- 157$600 to $649
- 182$650 to $699
- 187$700 to $749
- 52$750 to $799
- 328$800 to $899
- 101$900 to $999
- 41$1,000 to $1,249
- 16$1,250 to $1,499
- 32$1,500 to $1,999
- 67No cash rent
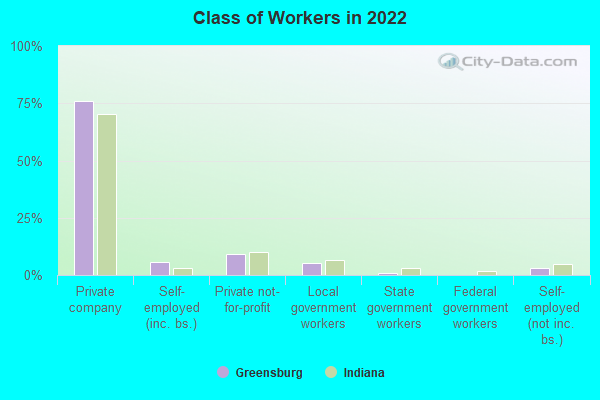
Percentage of workers working in this county: 71.3%
Number of people working at home: 681 (11.7% of all workers)
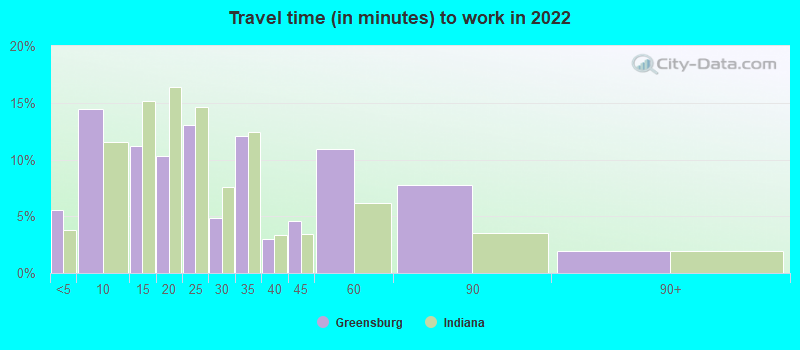
Travel time to work (commute)
- Less than 5 minutes: 505
- 5 to 9 minutes: 1,429
- 10 to 14 minutes: 765
- 15 to 19 minutes: 639
- 20 to 24 minutes: 432
- 25 to 29 minutes: 149
- 30 to 34 minutes: 385
- 35 to 39 minutes: 143
- 40 to 44 minutes: 319
- 45 to 59 minutes: 149
- 60 to 89 minutes: 164
- 90 or more minutes: 45
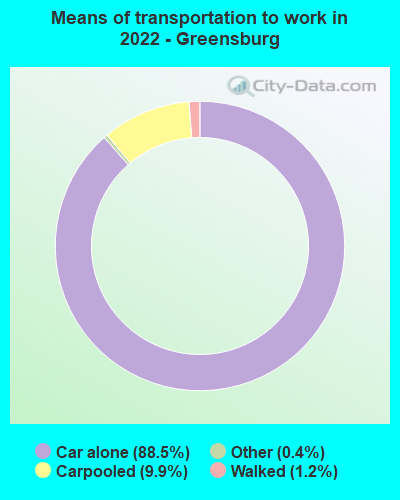
Means of transportation to work:
- Drove a car alone: 9,148 (81.1%)
- Carpooled: 1,132 (10.0%)
- Bus: 2 (0.0%)
- Taxi: 51 (0.5%)
- Walked: 122 (1.1%)
- Worked at home: 681 (6.0%)
- Unemployment by race in 2022
- Unemployment rate for White non-Hispanic residents
- 1.0%Males
- 0.9%Females
- Unemployment rate for other race residents
- 100.0%Males
- Unemployment rate for two or more race residents
- 8.8%Males
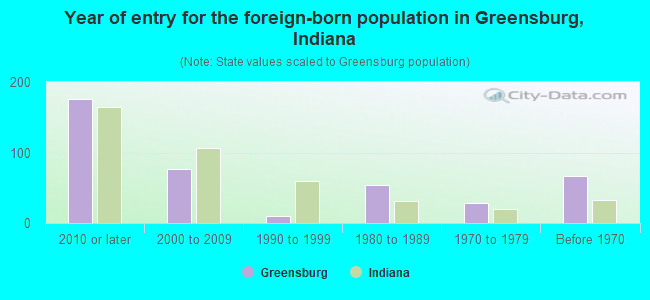
- Year of entry for the foreign-born population in Greensburg, Indiana
- 1762010 or later
- 772000 to 2009
- 101990 to 1999
- 541980 to 1989
- 291970 to 1979
- 67Before 1970
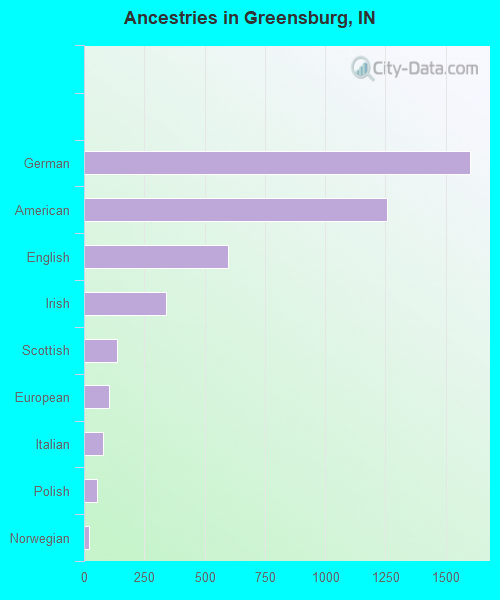
First ancestries reported:
- German: 1,600 (31.2%)
- American: 1,258 (24.6%)
- English: 597 (11.7%)
- Irish: 340 (6.6%)
- Scottish: 137 (2.7%)
- European: 104 (2.0%)
- Italian: 77 (1.5%)
- Polish: 52 (1.0%)
- Norwegian: 20 (0.4%)
- Canadian: 10 (0.2%)
- British: 8 (0.2%)
Most common places of birth for foreign-born residents (%):
| Greensburg: | 30.1% (91) |
| Indiana: | 8.5% (32,127) |
| Greensburg: | 24.8% (75) |
| Indiana: | 27.0% (101,996) |
| Greensburg: | 14.6% (44) |
| Indiana: | 1.2% (4,520) |
| Greensburg: | 9.6% (29) |
| Indiana: | 0.8% (3,114) |
| Greensburg: | 7.6% (23) |
| Indiana: | 1.7% (6,439) |
| Greensburg: | 5.6% (17) |
| Indiana: | 2.1% (7,834) |
| Greensburg: | 3.3% (10) |
| Indiana: | 0.8% (2,847) |
Place of birth for U.S.-born residents:
- This state: 9,268
- Other state: 1,803
- Northeast: 185
- Midwest: 659
- South: 909
- West: 24
90.9% of Greensburg residents lived in the same house 1 years ago.
Out of people who lived in different houses, 31.4% lived in this county.
Out of people who lived in different counties, 80.6% lived in Indiana.
| Greensburg: | 90.9% |
| State average: | 87.1% |
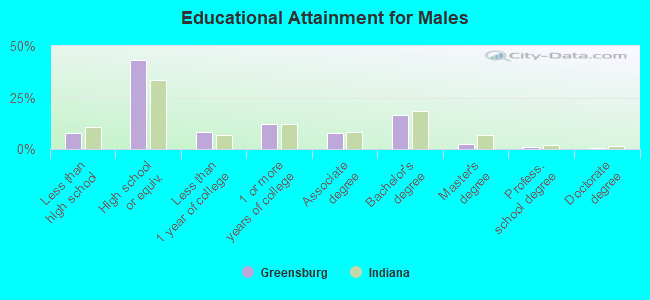
Education attainment for males 25 years and older:
- No schooling: 14
- Nursery to 4th grade: 0
- 5th and 6th grade: 0
- 7th and 8th grade: 86
- 9th grade: 28
- 10th grade: 53
- 11th grade: 26
- 12th grade, no diploma: 90
- High school graduate (or equivalency): 1,616
- Less than 1 year of college: 301
- Some college more than 1 year, no degree: 459
- Associate degree: 290
- Bachelor's degree: 623
- Master's degree: 82
- Professional school degree: 36
- Doctorate degree: 27
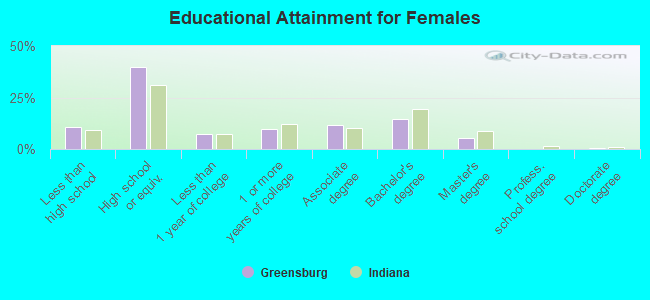
Education attainment for females 25 years and older:
- No schooling: 55
- Nursery to 4th grade: 0
- 5th and 6th grade: 38
- 7th and 8th grade: 123
- 9th grade: 17
- 10th grade: 44
- 11th grade: 135
- 12th grade, no diploma: 55
- High school graduate (or equivalency): 1,710
- Less than 1 year of college: 320
- Some college more than 1 year, no degree: 417
- Associate degree: 509
- Bachelor's degree: 631
- Master's degree: 229
- Professional school degree: 0
- Doctorate degree: 15


Housing units in structures:
- One, detached: 3,731
- One, attached: 220
- Two: 209
- 3 or 4: 222
- 5 to 9: 309
- 10 to 19: 123
- 20 to 49: 229
- 50 or more: 183
- Mobile homes: 158
Housing units lacking complete kitchen facilities in 2022: 2.5%
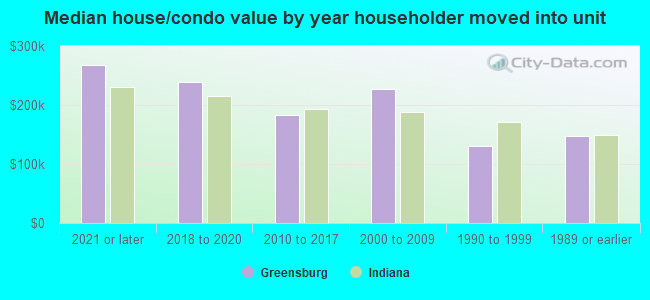
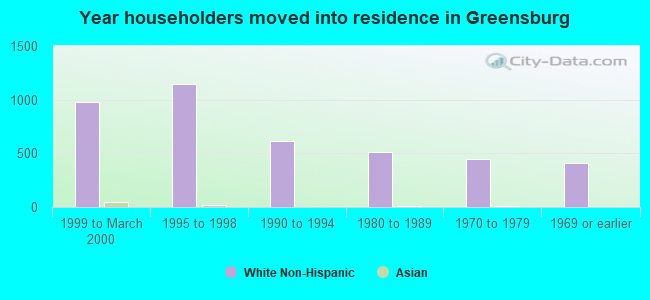
House/condo owner moved in on average 9 years ago
Renter moved in on average 5 years ago
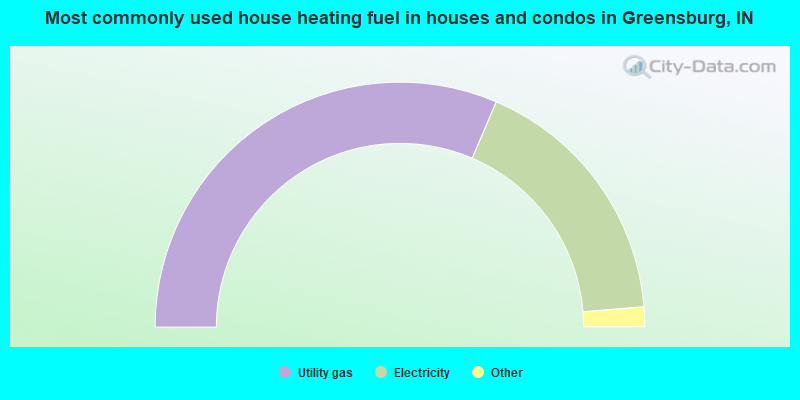
- 62.9%Utility gas
- 34.5%Electricity
- 2.2%Bottled, tank, or LP gas
- 0.4%Wood
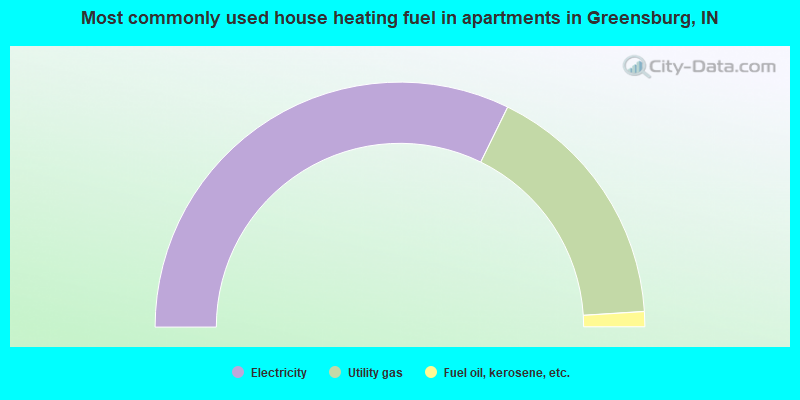
- 64.5%Electricity
- 33.5%Utility gas
- 2.0%Fuel oil, kerosene, etc.
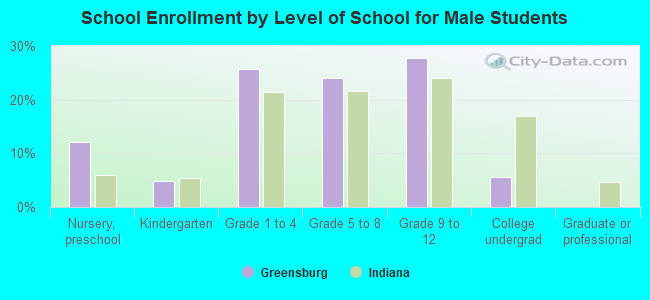
Private vs. public school enrollment:
| Here: | 16.6% |
| Indiana: | 14.9% |
| Here: | 9.8% |
| Indiana: | 11.4% |
| Here: | 14.4% |
| Indiana: | 22.3% |