Greenville, KY (Kentucky) Houses and Residents
| Greenville: | $131,865 |
| Kentucky: | $196,300 |
Total population: 4,402 (Urban population: 4,181 (all inside urban clusters), Rural population: 8 (all nonfarm))
Houses: 2,298 (1,946 occupied: 1,401 owner occupied, 586 renter occupied)
| % of renters here: | 29% |
| State: | 31% |
Housing density: 482 houses/condos per square mile
Median price asked for vacant for-sale houses and condos in 2022: $443,803.
Median contract rent in 2022: $504 (lower quartile is $193, upper quartile is $577)
Median rent asked for vacant for-rent units in 2022: $600
Median gross rent in Greenville, KY in 2022: $692
Housing units in Greenville with a mortgage: 615 (48 second mortgage, 0 home equity loan, 34 both second mortgage and home equity loan)
Houses without a mortgage: 51
Median household income for houses/condos with a mortgage: $95,500
Median household income for apartments without a mortgage: $114,549
Median monthly housing costs: $603
Compare current foreclosures near Greenville, KY:
| Photo | Address | Area | Beds / Baths | Price | Details |
|---|---|---|---|---|---|

|
#1
State Route 853
Greenville, KY 42345
|
- sq. feet
|
- baths - beds |
show details | |

|
#2
Kaylor Ln
Greenville, KY 42345
|
- sq. feet
|
- baths - beds |
show details | |

|
#3
Kentucky 1473
Greenville, KY 42345
|
- sq. feet
|
- baths - beds |
show details | |

|
#4
Robinwood Dr Apt 31
Greenville, KY 42345
|
- sq. feet
|
- baths - beds |
show details | |

|
#5
Joyce Ave
Greenville, KY 42345
|
- sq. feet
|
- baths - beds |
show details | |

|
#6
Joyce Ave
Greenville, KY 42345
|
- sq. feet
|
- baths - beds |
show details | |

|
#7
State Route 890
Greenville, KY 42345
|
1,368 sq. feet
|
- baths - beds |
show details | |

|
#8
James St
Greenville, KY 42345
|
- sq. feet
|
- baths - beds |
show details | |

|
#9
Steven Meadows Ln
Greenville, KY 42345
|
- sq. feet
|
- baths - beds |
show details | |

|
#10
Winstons Ln
Greenville, KY 42345
|
- sq. feet
|
- baths - beds |
show details |
| Photo | Address | Area | Beds / Baths | Price | Details |
|---|---|---|---|---|---|

|
#11
College St # 1
Greenville, KY 42345
|
- sq. feet
|
- baths - beds |
show details | |

|
#12
Countryside Loop
Greenville, KY 42345
|
- sq. feet
|
- baths - beds |
show details | |

|
#13
Friendship Rd
Greenville, KY 42345
|
- sq. feet
|
- baths - beds |
show details | |

|
#14
State Route 601
Greenville, KY 42345
|
- sq. feet
|
- baths - beds |
show details | |

|
#15
Friendship Rd
Greenville, KY 42345
|
- sq. feet
|
- baths - beds |
show details | |

|
#16
N Cherry St
Greenville, KY 42345
|
- sq. feet
|
- baths - beds |
show details | |

|
#17
Countryside Loop
Greenville, KY 42345
|
- sq. feet
|
- baths - beds |
show details | |

|
#18
State Route 189 S
Greenville, KY 42345
|
- sq. feet
|
- baths - beds |
show details | |

|
#19
Us Highway 62 W
Rockport, KY 42369
|
1,225 sq. feet
|
1 baths 3 beds |
show details | |

|
#20
Stringtown Rd
Sacramento, KY 42372
|
2,068 sq. feet
|
2 baths 4 beds |
show details |
| Photo | Address | Area | Beds / Baths | Price | Details |
|---|---|---|---|---|---|

|
#21
N Church St
White Plains, KY 42464
|
1,400 sq. feet
|
2 baths 3 beds |
show details | |

|
#22
Willow Glen Rd
Central City, KY 42330
|
1,100 sq. feet
|
1 baths 3 beds |
show details | |

|
#23
State Route 70 W
Central City, KY 42330
|
- sq. feet
|
1 baths 3 beds |
show details | |

|
#24
Reynolds Ln
Sacramento, KY 42372
|
1,496 sq. feet
|
1 baths 4 beds |
show details | |

|
#25
Concord Dr
White Plains, KY 42464
|
2,560 sq. feet
|
3 baths 4 beds |
show details | |

|
#26
New Salem Cir
Nortonville, KY 42442
|
1,653 sq. feet
|
2 baths - beds |
show details | |

|
#27
N Church St
White Plains, KY 42464
|
1,299 sq. feet
|
- baths - beds |
show details | |

|
#28
Inn View Ln
Dunmor, KY 42339
|
- sq. feet
|
- baths - beds |
show details | |

|
#29
State Route 2270 W
Belton, KY 42324
|
- sq. feet
|
- baths - beds |
show details | |

|
#30
State Route 70 W
Bremen, KY 42325
|
- sq. feet
|
- baths - beds |
show details |
| Photo | Address | Area | Beds / Baths | Price | Details |
|---|---|---|---|---|---|

|
#31
Willis Dr
Powderly, KY 42367
|
- sq. feet
|
- baths - beds |
show details | |

|
#32
Harris Rd
Belton, KY 42324
|
1,040 sq. feet
|
- baths - beds |
show details | |

|
#33
Hill Rd
Belton, KY 42324
|
- sq. feet
|
- baths - beds |
show details | |

|
#34
Rabbit Ridge Rd
Elkton, KY 42220
|
- sq. feet
|
- baths - beds |
show details | |

|
#35
N Franklin St
White Plains, KY 42464
|
- sq. feet
|
- baths - beds |
show details | |

|
#36
Red Bud Ln
Powderly, KY 42367
|
- sq. feet
|
- baths - beds |
show details | |

|
#37
Pendley Rd
Nortonville, KY 42442
|
- sq. feet
|
- baths - beds |
show details | |

|
#38
Dunmor Deer Lick Rd
Lewisburg, KY 42256
|
- sq. feet
|
- baths - beds |
show details | |

|
#39
Pendley St
Powderly, KY 42367
|
- sq. feet
|
- baths - beds |
show details | |

|
#40
NW Railroad St
White Plains, KY 42464
|
1,344 sq. feet
|
- baths - beds |
show details |
| Photo | Address | Area | Beds / Baths | Price | Details |
|---|---|---|---|---|---|

|
#41
Horse Shoe Loop
White Plains, KY 42464
|
- sq. feet
|
- baths - beds |
show details | |

|
#42
Hopkins Rd
White Plains, KY 42464
|
- sq. feet
|
- baths - beds |
show details | |

|
#43
Cavanaugh Rd
White Plains, KY 42464
|
1,872 sq. feet
|
- baths - beds |
show details | |

|
#44
Cleaton Rd Apt 3
Central City, KY 42330
|
- sq. feet
|
- baths - beds |
show details | |

|
#45
Us Highway 431 S
Dunmor, KY 42339
|
1,280 sq. feet
|
- baths - beds |
show details | |

|
#46
State Route 85 E
Centertown, KY 42328
|
- sq. feet
|
- baths - beds |
show details | |

|
#47
Obannon Ln
Central City, KY 42330
|
- sq. feet
|
- baths - beds |
show details | |

|
#48
Us Highway 431 S
Beechmont, KY 42323
|
- sq. feet
|
- baths - beds |
show details | |

|
#49
New Salem Cir
Nortonville, KY 42442
|
864 sq. feet
|
- baths - beds |
show details | |

|
Check over 1 million property listings on Foreclosure.com!
|
browse all offers | |||

Latest news about housing in Greenville, KY collected exclusively by city-data.com from local newspapers, TV, and radio stations

 | Louisville KY vs Jeffersonville IN (22 replies) |
| Best areas to live in Louisville? (6 replies) |
| Louisville Exceeded My Expectations!! Thinking of moving.. (21 replies) |
| Best Places to Retire in Kentucky? (21 replies) |
| Pretty neighborhoods in greater Louisville area (13 replies) |
| Another unfortunate ending: historic home leveled in Lex (0 replies) |

Median year apartment built: 1977
Household type by relationship:
Households: 4,472- Male householders: 1,000 (157 living alone), Female householders: 926 (440 living alone)
797 spouses (794 opposite-sex spouses), 102 unmarried partners, (64 opposite-sex unmarried partners), 994 children (827 natural, 0 adopted, 166 stepchildren), 60 grandchildren, 36 brothers or sisters, 55 parents, 0 foster children, 0 other relatives, 10 non-relatives
- In group quarters: 490
Size of family households: 803 2-persons, 211 3-persons, 160 4-persons, 56 5-persons, 6 6-persons, 15 7-or-more-persons.
Size of nonfamily households: 630 1-person, 107 2-persons.
666 married couples with children.
97 single-parent households (8 men, 89 women).
97.4% of residents of Greenville speak English at home.
1.1% of residents speak Spanish at home (100% speak English very well).
0.7% of residents speak other Indo-European language at home (100% speak English very well).
0.9% of residents speak Asian or Pacific Island language at home (100% speak English very well).
Foreign born population: 351 (7.8%)
(87.7% of them are naturalized citizens)
| Here: | 6.4 |
| State: | 6.4 |
| Here: | 4.4 |
| State: | 4.4 |

- Bedrooms in owner-occupied houses and condos in Greenville, Kentucky
- 0no bedroom
- 01 bedroom
- 5412 bedrooms
- 5613 bedrooms
- 2064 bedrooms
- 945+ bedrooms

- Bedrooms in renter-occupied apartments in Greenville, Kentucky
- 0no bedroom
- 1951 bedroom
- 3242 bedrooms
- 673 bedrooms
- 04 bedrooms
- 05+ bedrooms

- Cars and other vehicles available in Greenville in owner-occupied houses/condos
- 11no vehicle
- 2781 vehicle
- 4592 vehicles
- 5093 vehicles
- 1174 vehicles
- 285+ vehicles

- Cars and other vehicles available in Greenville in renter-occupied apartments
- 127no vehicle
- 2801 vehicle
- 1042 vehicles
- 743 vehicles
- 04 vehicles
- 05+ vehicles

- Rooms in owner-occupied houses in Greenville, Kentucky
- 01 room
- 02 rooms
- 03 rooms
- 3914 rooms
- 1525 rooms
- 1836 rooms
- 2177 rooms
- 1868 rooms
- 2739+ rooms

- Rooms in renter-occupied apartments in Greenville, Kentucky
- 01 room
- 612 rooms
- 893 rooms
- 1554 rooms
- 1625 rooms
- 966 rooms
- 07 rooms
- 178 rooms
- 69+ rooms


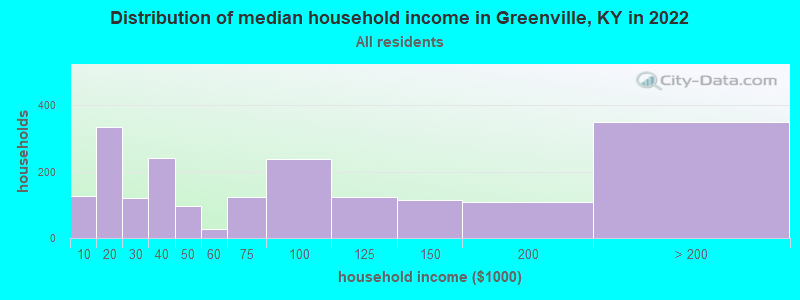
Greenville, KY household income distribution

- 125Less than $10,000
- 333$10,000 to $19,999
- 121$20,000 to $29,999
- 240$30,000 to $39,999
- 96$40,000 to $49,999
- 28$50,000 to $59,999
- 122$60,000 to $74,999
- 237$75,000 to $99,999
- 124$100,000 to $124,999
- 113$125,000 to $149,999
- 108$150,000 to $199,999
- 349$200,000 or more
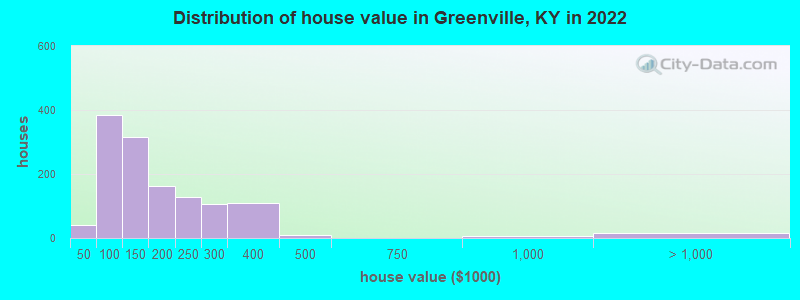
Home value of owner - occupied houses in 2022 in Greenville, KY
-
- 8Less than $10,000
- 17$10,000 to $14,999
- 6$30,000 to $34,999
- 8$40,000 to $49,999
- 246$50,000 to $59,999
- 27$60,000 to $69,999
- 4$70,000 to $79,999
- 72$80,000 to $89,999
- 26$90,000 to $99,999
- 217$100,000 to $124,999
- 99$125,000 to $149,999
- 66$150,000 to $174,999
- 96$175,000 to $199,999
- 129$200,000 to $249,999
- 105$250,000 to $299,999
- 108$300,000 to $399,999
- 7$400,000 to $499,999
- 7$750,000 to $999,999
- 15$2,000,000 or more
Rent paid by renters in 2022 in Greenville, KY
-
- 9Less than $100
- 79$100 to $149
- 70$150 to $199
- 54$200 to $249
- 5$250 to $299
- 14$300 to $349
- 5$350 to $399
- 5$400 to $449
- 32$450 to $499
- 168$500 to $549
- 24$550 to $599
- 48$650 to $699
- 9$700 to $749
- 48$800 to $899
- 16$1,250 to $1,499
- 3$2,000 to $2,499
- 1No cash rent


Percentage of workers working in this county: 53.3%
Number of people working at home: 0 (0.0% of all workers)
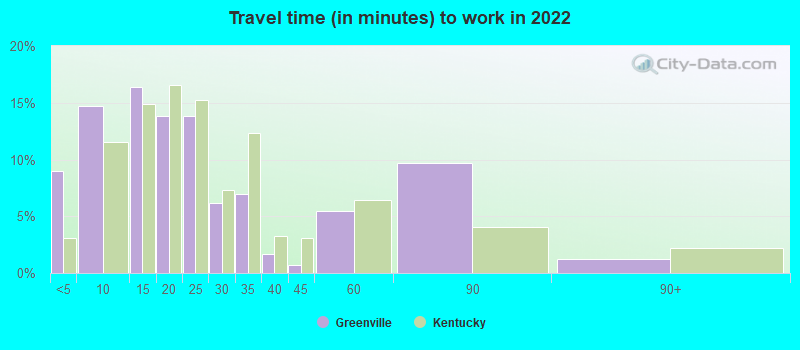
Travel time to work (commute)
- Less than 5 minutes: 221
- 5 to 9 minutes: 271
- 10 to 14 minutes: 228
- 15 to 19 minutes: 123
- 20 to 24 minutes: 148
- 25 to 29 minutes: 67
- 30 to 34 minutes: 222
- 35 to 39 minutes: 109
- 40 to 44 minutes: 312
- 45 to 59 minutes: 101
- 60 to 89 minutes: 24
- 90 or more minutes: 42
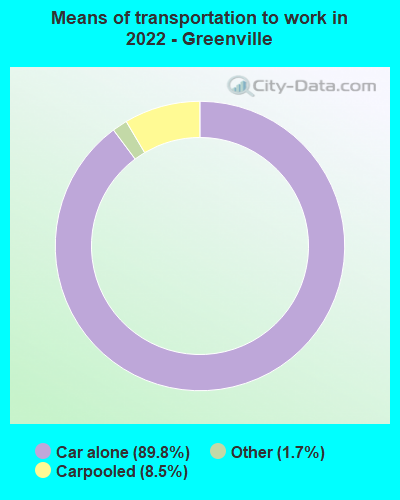
Means of transportation to work:
- Drove a car alone: 3,210 (86.5%)
- Carpooled: 337 (9.1%)
- Taxi: 72 (1.9%)

- Unemployment by race in 2022
- Unemployment rate for White non-Hispanic residents
- 7.4%Males
- 2.9%Females

- Year of entry for the foreign-born population in Greenville, Kentucky
- 672010 or later
- 02000 to 2009
- 01990 to 1999
- 131980 to 1989
- 01970 to 1979
- 7Before 1970
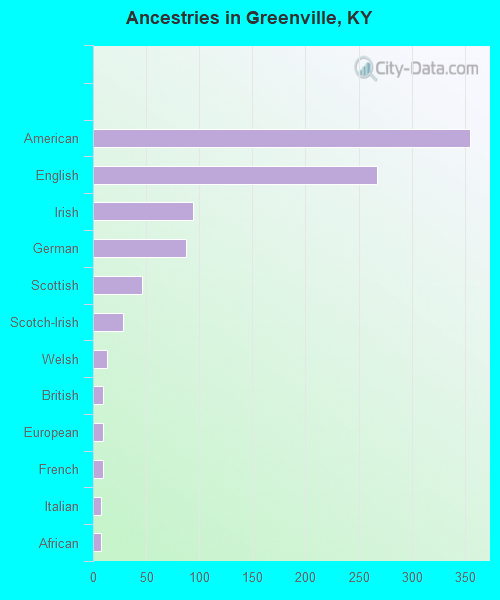
First ancestries reported:
- American: 355 (24.1%)
- English: 267 (18.1%)
- Irish: 94 (6.4%)
- German: 88 (6.0%)
- Scottish: 46 (3.1%)
- Scotch-Irish: 28 (1.9%)
- Welsh: 13 (0.9%)
- British: 9 (0.6%)
- European: 9 (0.6%)
- French: 9 (0.6%)
- Italian: 8 (0.5%)
- African: 8 (0.5%)
- Croatian: 3 (0.2%)
Most common places of birth for foreign-born residents (%):
| Greenville: | 80.5% (294) |
| Kentucky: | 0.4% (804) |
| Greenville: | 11.5% (42) |
| Kentucky: | 0.3% (614) |
| Greenville: | 4.1% (15) |
| Kentucky: | 0.9% (1,604) |
Place of birth for U.S.-born residents:
- This state: 3,147
- Other state: 911
- Northeast: 32
- Midwest: 462
- South: 341
- West: 71
83.3% of Greenville residents lived in the same house 1 years ago.
Out of people who lived in different houses, 29.6% lived in this county.
Out of people who lived in different counties, 76.1% lived in Kentucky.
| Greenville: | 83.3% |
| State average: | 87.2% |
Education attainment for males 25 years and older:
- No schooling: 22
- Nursery to 4th grade: 0
- 5th and 6th grade: 5
- 7th and 8th grade: 33
- 9th grade: 35
- 10th grade: 25
- 11th grade: 13
- 12th grade, no diploma: 6
- High school graduate (or equivalency): 653
- Less than 1 year of college: 41
- Some college more than 1 year, no degree: 261
- Associate degree: 87
- Bachelor's degree: 407
- Master's degree: 31
- Professional school degree: 37
- Doctorate degree: 60

Education attainment for females 25 years and older:
- No schooling: 0
- Nursery to 4th grade: 0
- 5th and 6th grade: 11
- 7th and 8th grade: 26
- 9th grade: 28
- 10th grade: 72
- 11th grade: 7
- 12th grade, no diploma: 2
- High school graduate (or equivalency): 605
- Less than 1 year of college: 163
- Some college more than 1 year, no degree: 199
- Associate degree: 361
- Bachelor's degree: 124
- Master's degree: 131
- Professional school degree: 17
- Doctorate degree: 21


Housing units in structures:
- One, detached: 1,784
- Two: 29
- 3 or 4: 132
- 5 to 9: 197
- 10 to 19: 51
- 20 to 49: 50
- 50 or more: 40
- Mobile homes: 12
Housing units lacking complete kitchen facilities in 2022: 13.7%
House/condo owner moved in on average 5 years ago
Renter moved in on average 4 years ago

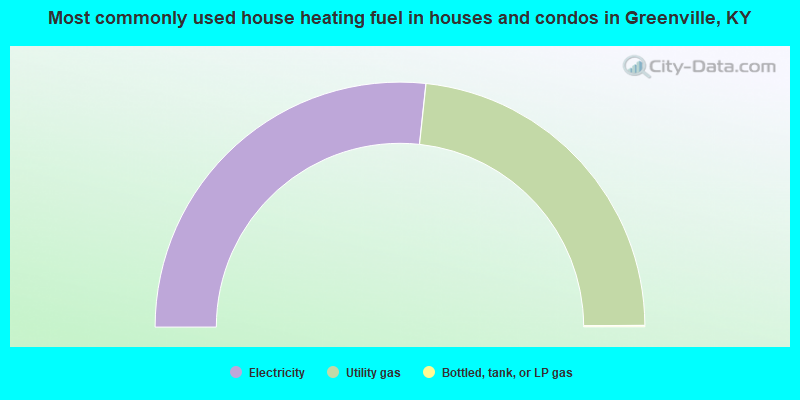
- 53.4%Electricity
- 46.4%Utility gas
- 0.2%Bottled, tank, or LP gas
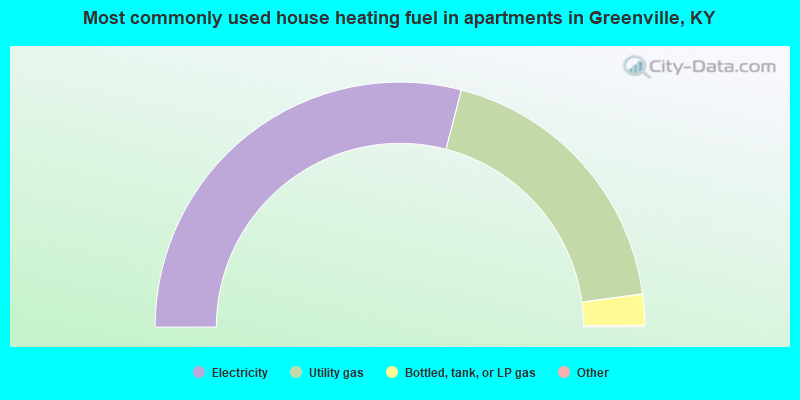
- 58.2%Electricity
- 37.7%Utility gas
- 4.1%Bottled, tank, or LP gas
Private vs. public school enrollment:
| Here: | 10.0% |
| Kentucky: | 17.2% |
| Here: | 2.5% |
| Kentucky: | 15.2% |
| Here: | 0.0% |
| Kentucky: | 19.6% |


