Greenville, SC (South Carolina) Houses and Residents
Estimated median house or condo value in 2022: $447,500 (it was $112,500 in 2000 )
Greenville:
$447,500South Carolina:
$254,600
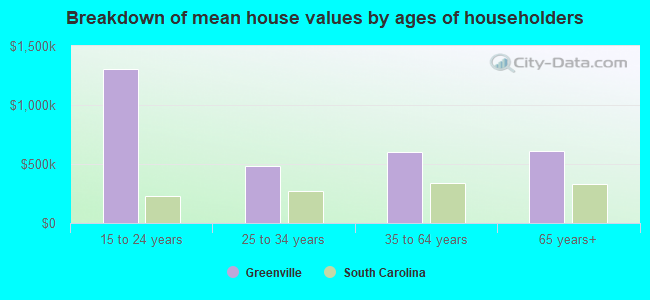
Lower value quartile - upper value quartile: $258,700 - $741,600Mean price in 2022: Detached houses: $543,611 Here:
$543,611State:
$368,255
Townhouses or other attached units: $306,217 Here:
$306,217State:
$292,023
In 2-unit structures: $388,954 Here:
$388,954State:
$358,283
In 3-to-4-unit structures: $195,409 Here:
$195,409State:
$230,702
In 5-or-more-unit structures: $397,552 Here:
$397,552State:
$326,361
Mobile homes: $128,709 Here:
$128,709State:
$102,531
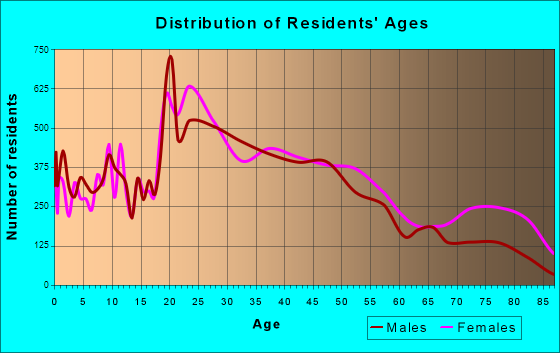
Total population: 62,252 (Urban population: 56,128, Rural population: 206 (all nonfarm) )
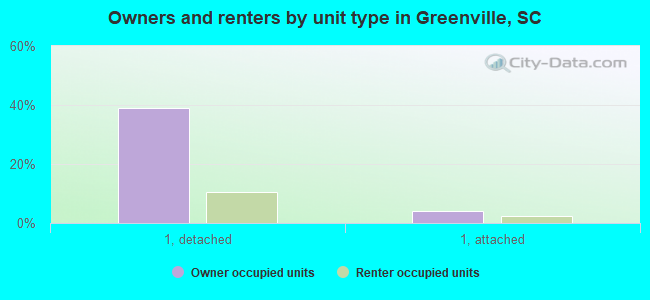
Houses: 38,214 (34,547 occupied: 15,368 owner occupied, 19,179 renter occupied )
% of renters here:
56%State:
28%
Housing density: 1,466 houses/condos per square mile
Median price asked for vacant for-sale houses and condos in 2022: $573,057.
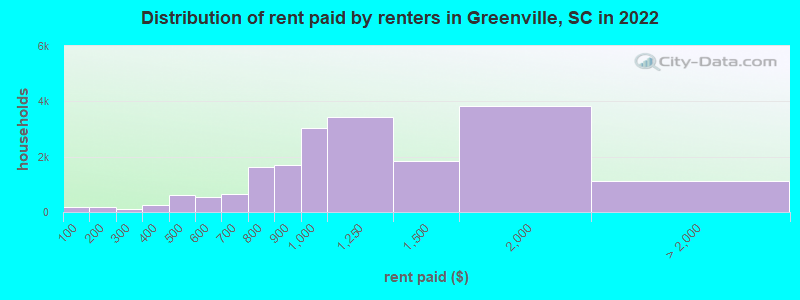
Median contract rent in 2022: $1,035 (lower quartile is $831, upper quartile is $1,486)
Median rent asked for vacant for-rent units in 2022: $760
Median gross rent in Greenville, SC in 2022: $1,189
Housing units in Greenville with a mortgage: 9,908 (996 second mortgage, 138 home equity loan, 812 both second mortgage and home equity loan )Houses without a mortgage: 247
Median household income for houses/condos with a mortgage: $125,020
Median household income for apartments without a mortgage: $62,987
Median monthly housing costs: $1,226
Data:
Median house or condo value ($)
Median house or condo value ($ change since 2000)
Median house or condo value ($) - White
Median house or condo value ($) - Black or African American
Median house or condo value ($) - Asian
Median house or condo value ($) - Hispanic or Latino
Median house or condo value ($) - American Indian and Alaska Native
Median house or condo value ($) - Multirace
Median house or condo value ($) - Other Race
Median price asked for mobile homes ($)
Household density (households per square mile)
Mean house or condo value by units in structure - 1, detached ($)
Mean house or condo value by units in structure - 1, attached ($)
Mean house or condo value by units in structure - 2 ($)
Mean house or condo value by units in structure by units in structure - 3 or 4 ($)
Mean house or condo value by units in structure - 5 or more ($)
Mean house or condo value by units in structure - Boat, RV, van, etc. ($)
Mean house or condo value by units in structure - Mobile home ($)
Median contract rent ($)
Median contract rent - Lower quartile ($)
Median contract rent - Upper quartile ($)
Median gross rent ($)
Urban houses (%)
Rural houses (%)
Houses occupied (%)
Houses occupied (% change since 2000)
Houses owner occupied (%)
Houses owner occupied (% change since 2000)
Houses renter occupied (%)
Houses renter occupied (% change since 2000)
Vacant housing units - For rent (%)
Vacant housing units - For rent (% change since 2000)
Vacant housing units - For sale only (%)
Vacant housing units - For sale only (% change since 2000)
Vacant housing units - Rented or sold, not occupied (%)
Vacant housing units - Rented or sold, not occupied (% change since 2000)
Vacant housing units - For seasonal, recreational, or occasional use (%)
Vacant housing units - For seasonal, recreational, or occasional use (% change since 2000)
Vacant housing units - For migrant workers (%)
Vacant housing units - For migrant workers (% change since 2000)
Vacant housing units - Other vacant (%)
Vacant housing units - Other vacant (% change since 2000)
Median monthly housing costs ($)
Median household income for houses/condos with a mortgage ($)
Median household income for houses/condos without a mortgage ($)
Median household income ($)
Median household income ($) - White
Median household income ($) - Black or African American
Median household income ($) - Asian
Median household income ($) - Hispanic or Latino
Median household income ($) - American Indian and Alaska Native
Median household income ($) - Multirace
Median household income ($) - Other Race
Mortgage status - with mortgage (%)
Mortgage status - with second mortgage (%)
Mortgage status - with home equity loan (%)
Mortgage status - with both second mortgage and home equity loan (%)
Mortgage status - without a mortgage (%)
Median year house/condo built
Median year apartment built
Household type by relationship - Male householder living alone (%)
Household type by relationship - Male householder not living alone (%)
Household type by relationship - Female householder living alone (%)
Household type by relationship - Female householder not living alone (%)
Household type by relationship - Opposite-Sex spouse (%)
Household type by relationship - Same-Sex spouse (%)
Household type by relationship - Opposite-Sex unmarried partner (%)
Household type by relationship - Same-Sex unmarried partner (%)
Household type by relationship - In group quarters (%)
Size of family households - 2-person household (%)
Size of family households - 3-person household (%)
Size of family households - 4-person household (%)
Size of family households - 5-person household (%)
Size of family households - 6-person household (%)
Size of family households - 7-or-more-person household (%)
Size of nonfamily households - 1-person household (%)
Size of nonfamily households - 2-person household (%)
Size of nonfamily households - 3-person household (%)
Size of nonfamily households - 4-person household (%)
Size of nonfamily households - 5-person household (%)
Size of nonfamily households - 6-person household (%)
Size of nonfamily households - 7-or-moreperson household (%)
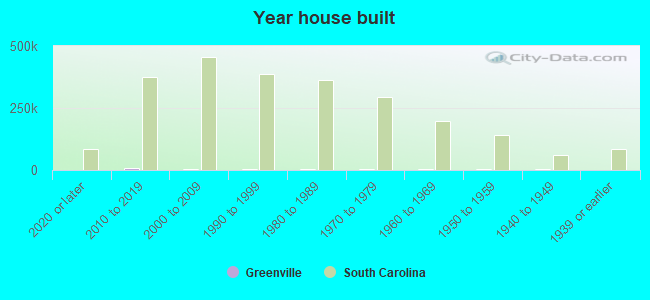
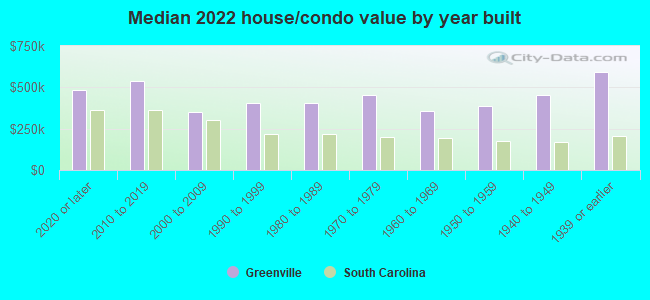
Year house built - Built 2010 or later (%)
Year house built - Built 2000 to 2009 (%)
Year house built - Built 1990 to 1999 (%)
Year house built - Built 1980 to 1989 (%)
Year house built - Built 1970 to 1979 (%)
Year house built - Built 1960 to 1969 (%)
Year house built - Built 1950 to 1959 (%)
Year house built - Built 1940 to 1949 (%)
Year house built - Built 1939 or earlier (%)
Median number of rooms in houses and condos
Median number of rooms in apartments
Median number of bedrooms in owner occupied houses
Mean number of bedrooms in owner occupied houses
Median number of bedrooms in renter occupied houses
Mean number of bedrooms in renter occupied houses
Median number of vehichles in owner occupied houses
Mean number of vehichles in owner occupied houses
Median number of vehichles in renter occupied houses
Mean number of vehichles in renter occupied houses
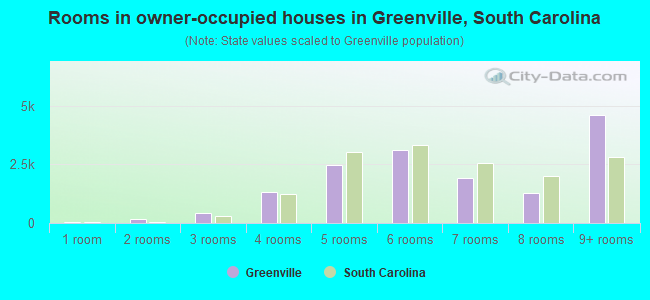
Rooms in owner-occupied houses - 1 room (%)
Rooms in owner-occupied houses - 2 rooms (%)
Rooms in owner-occupied houses - 3 rooms (%)
Rooms in owner-occupied houses - 4 rooms (%)
Rooms in owner-occupied houses - 5 rooms (%)
Rooms in owner-occupied houses - 6 rooms (%)
Rooms in owner-occupied houses - 7 rooms (%)
Rooms in owner-occupied houses - 8 rooms (%)
Rooms in owner-occupied houses - 9+ rooms (%)
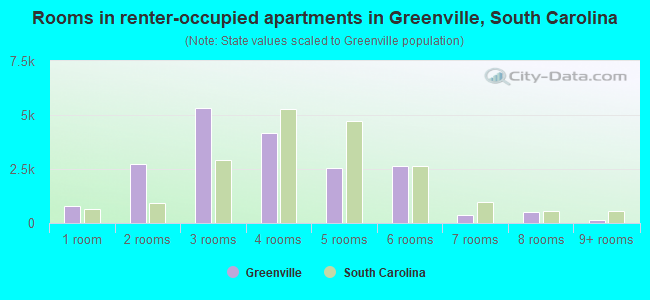
Rooms in renter-occupied houses - 1 room (%)
Rooms in renter-occupied houses - 2 rooms (%)
Rooms in renter-occupied houses - 3 rooms (%)
Rooms in renter-occupied houses - 4 rooms (%)
Rooms in renter-occupied houses - 5 rooms (%)
Rooms in renter-occupied houses - 6 rooms (%)
Rooms in renter-occupied houses - 7 rooms (%)
Rooms in renter-occupied houses - 8 rooms (%)
Rooms in renter-occupied houses - 9+ rooms (%)
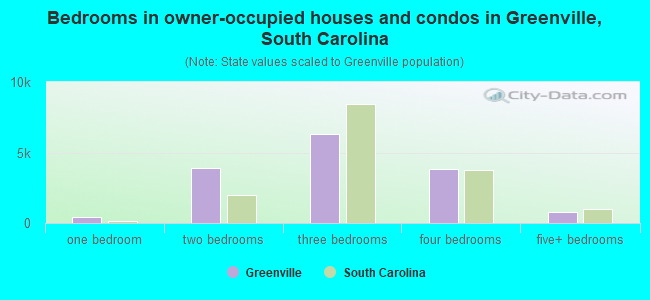
Bedrooms in owner-occupied houses - no bedrooms (%)
Bedrooms in owner-occupied houses - 1 bedroom (%)
Bedrooms in owner-occupied houses - 2 bedrooms (%)
Bedrooms in owner-occupied houses - 3 bedrooms (%)
Bedrooms in owner-occupied houses - 4 bedrooms (%)
Bedrooms in owner-occupied houses - 5+ bedrooms (%)
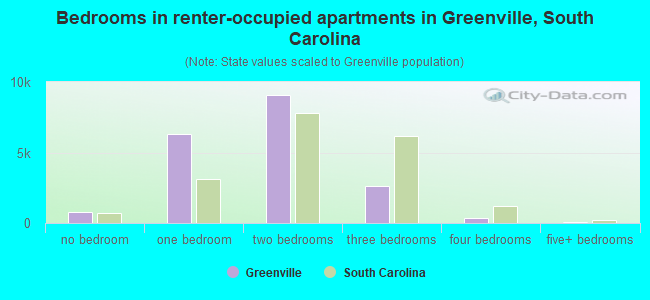
Bedrooms in renter-occupied houses - no bedrooms (%)
Bedrooms in renter-occupied houses - 1 bedroom (%)
Bedrooms in renter-occupied houses - 2 bedrooms (%)
Bedrooms in renter-occupied houses - 3 bedrooms (%)
Bedrooms in renter-occupied houses - 4 bedrooms (%)
Bedrooms in renter-occupied houses - 5+ bedrooms (%)
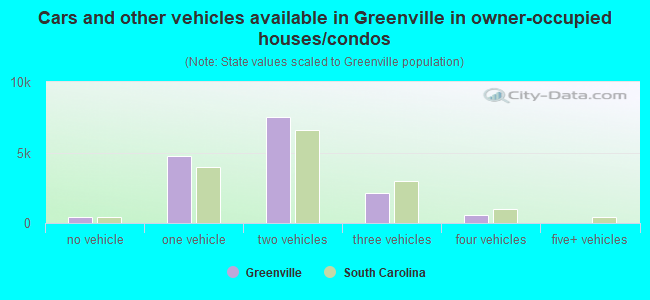
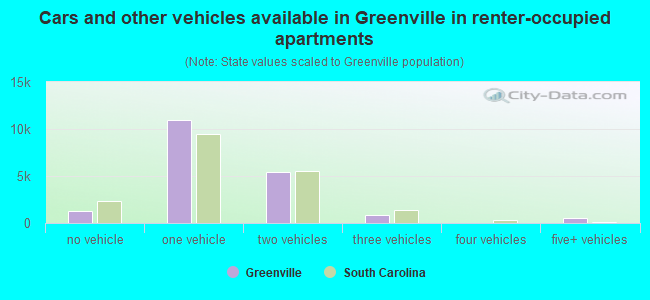
Vehicles available in owner-occupied houses - no vehicle available (%)
Vehicles available in owner-occupied houses - 1 vehicle available(%)
Vehicles available in owner-occupied houses - 2 Vehicles available (%)
Vehicles available in owner-occupied houses - 3 Vehicles available (%)
Vehicles available in owner-occupied houses - 4 Vehicles available (%)
Vehicles available in owner-occupied houses - 5+ Vehicles available (%)
Vehicles available in renter-occupied houses - no vehicle available (%)
Vehicles available in renter-occupied houses - 1 vehicle available (%)
Vehicles available in renter-occupied houses - 2 Vehicles available (%)
Vehicles available in renter-occupied houses - 3 Vehicles available (%)
Vehicles available in renter-occupied houses - 4 Vehicles available (%)
Vehicles available in renter-occupied houses - 5+ Vehicles available (%)
Housing units in structures - 1, detached (%)
Housing units in structures - 1, attached (%)
Housing units in structures - 2 (%)
Housing units in structures - 3 or 4 (%)
Housing units in structures - 5 to 9 (%)
Housing units in structures - 10 to 19 (%)
Housing units in structures - 20 to 49 (%)
Housing units in structures - 50 or more (%)
Housing units in structures - Mobile home (%)
Housing units in structures - Boat, RV, van, etc. (%)
Housing units in structures - Owners - 1, detached (%)
Housing units in structures - Owners - 1, attached (%)
Housing units in structures - Owners - 2 (%)
Housing units in structures - Owners - 3 or 4 (%)
Housing units in structures - Owners - 5 to 9 (%)
Housing units in structures - Owners - 10 to 19 (%)
Housing units in structures - Owners - 20 to 49 (%)
Housing units in structures - Owners - 50 or more (%)
Housing units in structures - Owners - Mobile home (%)
Housing units in structures - Owners - Boat, RV, van, etc. (%)
Housing units in structures - Renters - 1, detached (%)
Housing units in structures - Renters - 1, attached (%)
Housing units in structures - Renters - 2 (%)
Housing units in structures - Renters - 3 or 4 (%)
Housing units in structures - Renters - 5 to 9 (%)
Housing units in structures - Renters - 10 to 19 (%)
Housing units in structures - Renters - 20 to 49 (%)
Housing units in structures - Renters - 50 or more (%)
Housing units in structures - Renters - Mobile home (%)
Housing units in structures - Renters - Boat, RV, van, etc. (%)
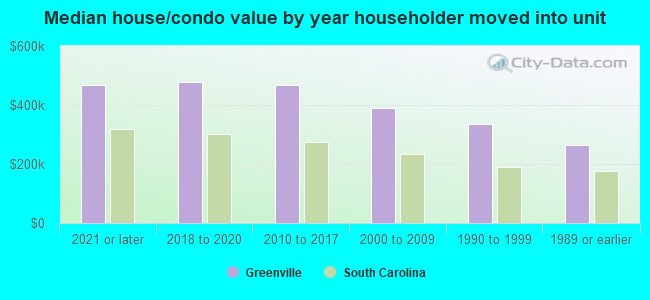
House/condo owner moved in on average (years ago)
Renter moved in on average (years ago)
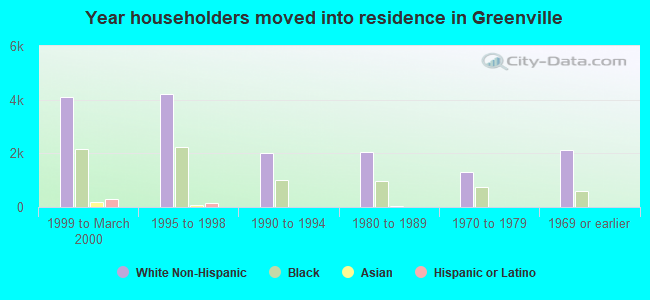
Year householder moved into unit - Moved in 1999 to March 2000 (%)
Year householder moved into unit - Moved in 1999 to March 2000 (%) - White
Year householder moved into unit - Moved in 1999 to March 2000 (%) - Black or African American
Year householder moved into unit - Moved in 1999 to March 2000 (%) - Asian
Year householder moved into unit - Moved in 1999 to March 2000 (%) - Hispanic or Latino
Year householder moved into unit - Moved in 1999 to March 2000 (%) - American Indian and Alaska Native
Year householder moved into unit - Moved in 1999 to March 2000 (%) - Multirace
Year householder moved into unit - Moved in 1999 to March 2000 (%) - Other Race
Year householder moved into unit - Moved in 1995 to 1998 (%)
Year householder moved into unit - Moved in 1995 to 1998 (%) - White
Year householder moved into unit - Moved in 1995 to 1998 (%) - Black or African American
Year householder moved into unit - Moved in 1995 to 1998 (%) - Asian
Year householder moved into unit - Moved in 1995 to 1998 (%) - Hispanic or Latino
Year householder moved into unit - Moved in 1995 to 1998 (%) - American Indian and Alaska Native
Year householder moved into unit - Moved in 1995 to 1998 (%) - Multirace
Year householder moved into unit - Moved in 1995 to 1998 (%) - Other Race
Year householder moved into unit - Moved in 1990 to 1994 (%)
Year householder moved into unit - Moved in 1990 to 1994 (%) - White
Year householder moved into unit - Moved in 1990 to 1994 (%) - Black or African American
Year householder moved into unit - Moved in 1990 to 1994 (%) - Asian
Year householder moved into unit - Moved in 1990 to 1994 (%) - Hispanic or Latino
Year householder moved into unit - Moved in 1990 to 1994 (%) - American Indian and Alaska Native
Year householder moved into unit - Moved in 1990 to 1994 (%) - Multirace
Year householder moved into unit - Moved in 1990 to 1994 (%) - Other Race
Year householder moved into unit - Moved in 1980 to 1989 (%)
Year householder moved into unit - Moved in 1980 to 1989 (%) - White
Year householder moved into unit - Moved in 1980 to 1989 (%) - Black or African American
Year householder moved into unit - Moved in 1980 to 1989 (%) - Asian
Year householder moved into unit - Moved in 1980 to 1989 (%) - Hispanic or Latino
Year householder moved into unit - Moved in 1980 to 1989 (%) - American Indian and Alaska Native
Year householder moved into unit - Moved in 1980 to 1989 (%) - Multirace
Year householder moved into unit - Moved in 1980 to 1989 (%) - Other Race
Year householder moved into unit - Moved in 1970 to 1979 (%)
Year householder moved into unit - Moved in 1970 to 1979 (%) - White
Year householder moved into unit - Moved in 1970 to 1979 (%) - Black or African American
Year householder moved into unit - Moved in 1970 to 1979 (%) - Asian
Year householder moved into unit - Moved in 1970 to 1979 (%) - Hispanic or Latino
Year householder moved into unit - Moved in 1970 to 1979 (%) - American Indian and Alaska Native
Year householder moved into unit - Moved in 1970 to 1979 (%) - Multirace
Year householder moved into unit - Moved in 1970 to 1979 (%) - Other Race
Year householder moved into unit - Moved in 1969 or earlier (%)
Year householder moved into unit - Moved in 1969 or earlier (%) - White
Year householder moved into unit - Moved in 1969 or earlier (%) - Black or African American
Year householder moved into unit - Moved in 1969 or earlier (%) - Asian
Year householder moved into unit - Moved in 1969 or earlier (%) - Hispanic or Latino
Year householder moved into unit - Moved in 1969 or earlier (%) - American Indian and Alaska Native
Year householder moved into unit - Moved in 1969 or earlier (%) - Multirace
Year householder moved into unit - Moved in 1969 or earlier (%) - Other Race
Housing units lacking complete plumbing facilities (%)
Housing units lacking complete kitchen facilities (%)
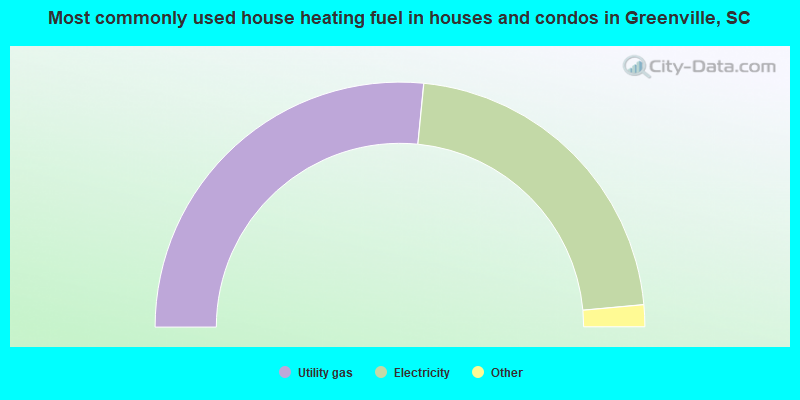
House heating fuel used in houses and condos - Utility gas (%)
House heating fuel used in houses and condos - Bottled, tank, or LP gas (%)
House heating fuel used in houses and condos - Electricity (%)
House heating fuel used in houses and condos - Fuel oil, kerosene, etc. (%)
House heating fuel used in houses and condos - Coal or coke (%)
House heating fuel used in houses and condos - Wood (%)
House heating fuel used in houses and condos - Solar energy (%)
House heating fuel used in houses and condos - Other fuel (%)
House heating fuel used in houses and condos - No fuel used (%)
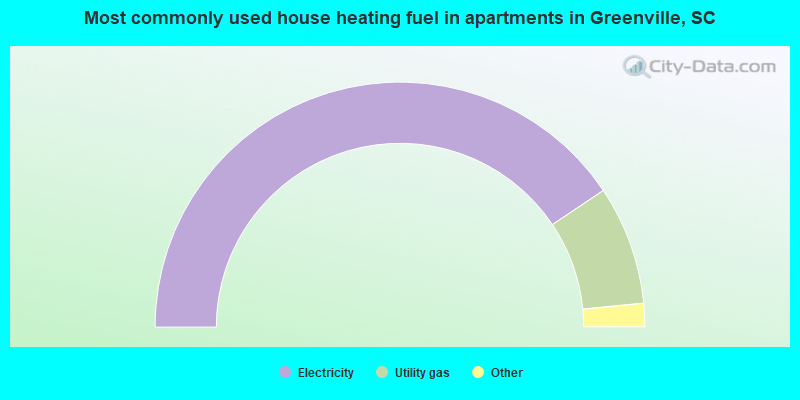
House heating fuel used in apartments - Utility gas (%)
House heating fuel used in apartments - Bottled, tank, or LP gas (%)
House heating fuel used in apartments - Electricity (%)
House heating fuel used in apartments - Fuel oil, kerosene, etc. (%)
House heating fuel used in apartments - Coal or coke (%)
House heating fuel used in apartments - Wood (%)
House heating fuel used in apartments - Solar energy (%)
House heating fuel used in apartments - Other fuel (%)
House heating fuel used in apartments - No fuel used (%)
Latest news about housing in Greenville, SC collected exclusively by city-data.com from local newspapers, TV, and radio stations
Median year house/condo built: 1965Median year apartment built: 1996Household type by relationship:
Households: 72,310
Male householders: 16,408 (6,654 living alone ), Female householders: 18,139 (6,716 living alone )13,456 spouses (13,428 opposite-sex spouses ), 1,699 unmarried partners , (936 opposite-sex unmarried partners ), 14,349 children (13,792 natural , 154 adopted , 403 stepchildren ), 1,001 grandchildren , 1,303 brothers or sisters , 294 parents , 0 foster children , 283 other relatives , 2,073 non-relatives In group quarters: 3,305
Size of family households: 10,038 2-persons , 4,025 3-persons , 2,404 4-persons , 828 5-persons , 359 6-persons , 157 7-or-more-persons .
Size of nonfamily households: 13,370 1-person , 3,087 2-persons , 279 3-persons .
8,249 married couples with children. single-parent households (306 men , 2,984 women ).
91.5% of residents of Greenville speak English at home. of residents speak Spanish at home (58% speak English very well , 19% speak English well , 17% speak English not well , 5% don't speak English at all ).of residents speak other Indo-European language at home (85% speak English very well , 15% speak English well ).of residents speak Asian or Pacific Island language at home (59% speak English very well , 38% speak English well , 4% speak English not well ).of residents speak other language at home (93% speak English very well , 6% speak English well , 1% speak English not well ).
Foreign born population: 5,470 (7.6%)of them are naturalized citizens )
Median number of rooms in houses and condos:
Median number of rooms in apartments
Owner-occupied Renter-occupied
Rooms in owner-occupied houses in Greenville, South Carolina
52 1 room 156 2 rooms 440 3 rooms 1,311 4 rooms 2,483 5 rooms 3,103 6 rooms 1,919 7 rooms 1,291 8 rooms 4,613 9+ rooms
Rooms in renter-occupied apartments in Greenville, South Carolina
786 1 room 2,744 2 rooms 5,339 3 rooms 4,158 4 rooms 2,550 5 rooms 2,623 6 rooms 369 7 rooms 493 8 rooms 117 9+ rooms
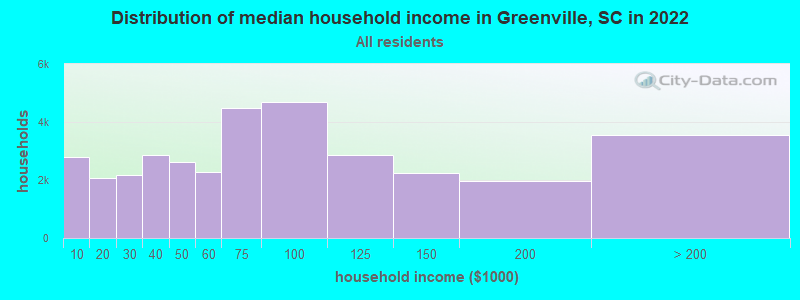
Greenville, SC household income distribution 2,778 Less than $10,0002,056 $10,000 to $19,9992,187 $20,000 to $29,9992,865 $30,000 to $39,9992,621 $40,000 to $49,9992,264 $50,000 to $59,9994,476 $60,000 to $74,9994,684 $75,000 to $99,9992,862 $100,000 to $124,9992,247 $125,000 to $149,9991,958 $150,000 to $199,9993,549 $200,000 or more
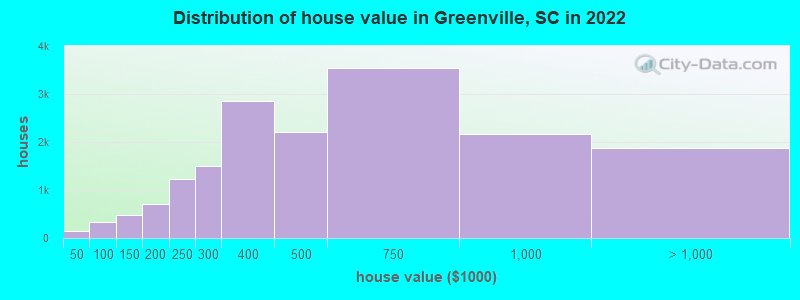
Home value of owner - occupied houses in 2022 in Greenville, SC 48 Less than $10,00041 $15,000 to $19,99910 $20,000 to $24,9993 $30,000 to $34,9993 $35,000 to $39,99936 $40,000 to $49,99977 $50,000 to $59,99934 $60,000 to $69,99939 $70,000 to $79,99970 $80,000 to $89,99968 $90,000 to $99,999269 $100,000 to $124,999218 $125,000 to $149,999487 $150,000 to $174,999223 $175,000 to $199,9991,237 $200,000 to $249,9991,505 $250,000 to $299,9992,850 $300,000 to $399,9992,204 $400,000 to $499,9993,550 $500,000 to $749,9992,156 $750,000 to $999,9991,443 $1,000,000 to $1,499,999128 $1,500,000 to $1,999,999311 $2,000,000 or moreRent paid by renters in 2022 in Greenville, SC 194 Less than $100185 $150 to $19960 $200 to $24963 $250 to $29980 $300 to $349171 $350 to $399440 $400 to $449157 $450 to $499405 $500 to $549127 $550 to $599325 $600 to $649314 $650 to $699775 $700 to $749867 $750 to $7991,706 $800 to $8993,049 $900 to $9993,440 $1,000 to $1,2491,838 $1,250 to $1,4993,847 $1,500 to $1,999346 $2,000 to $2,49954 $2,500 to $2,999288 $3,000 to $3,49957 $3,500 or more391 No cash rent
Percentage of workers working in this county: 86.8%Number of people working at home: 5,866 (14.8% of all workers )
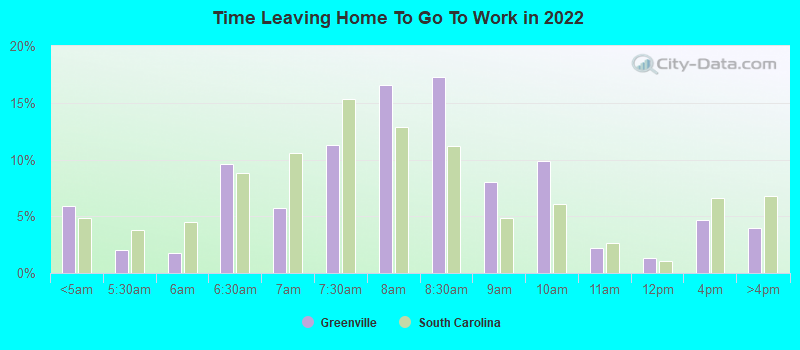
Travel time to work (commute)
Less than 5 minutes: 7785 to 9 minutes: 5,96410 to 14 minutes: 8,61615 to 19 minutes: 6,81120 to 24 minutes: 4,10925 to 29 minutes: 2,05030 to 34 minutes: 2,36235 to 39 minutes: 89840 to 44 minutes: 62745 to 59 minutes: 1,42760 to 89 minutes: 46790 or more minutes: 479
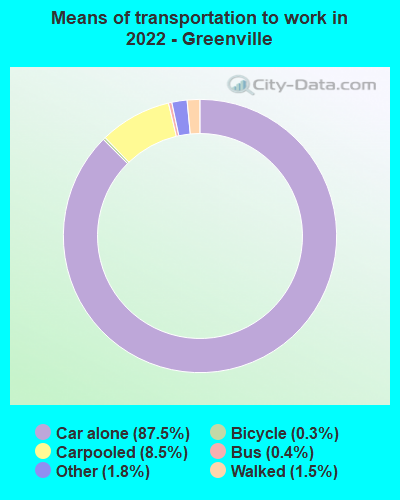
Means of transportation to work:
Drove a car alone: 90,589 (82.5%)Carpooled: 8,248 (7.5%)Bus : 475 (0.4%)Subway or elevated rail : 12 (0.0%)Long-distance train or commuter rail : 19 (0.0%)Taxi: 1,172 (1.1%)Bicycle: 347 (0.3%)Walked: 1,360 (1.2%)Worked at home: 5,866 (5.3%)
Unemployment by race in 2022
Unemployment rate for White non-Hispanic residents 2.3% Males0.6% FemalesUnemployment rate for Black residents 19.4% Males13.5% FemalesUnemployment rate for American Indian and Alaska Native residents 8.9% FemalesUnemployment rate for Asian residents 4.0% Males14.9% FemalesUnemployment rate for other race residents 1.6% Males9.0% FemalesUnemployment rate for two or more race residents 1.7% Males4.9% FemalesUnemployment rate for Hispanic or Latino residents 7.2% Males3.1% Females
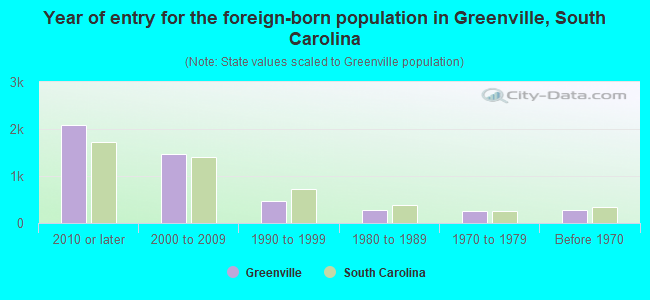
Year of entry for the foreign-born population in Greenville, South Carolina
2,077 2010 or later 1,478 2000 to 2009 468 1990 to 1999 270 1980 to 1989 262 1970 to 1979 277 Before 1970
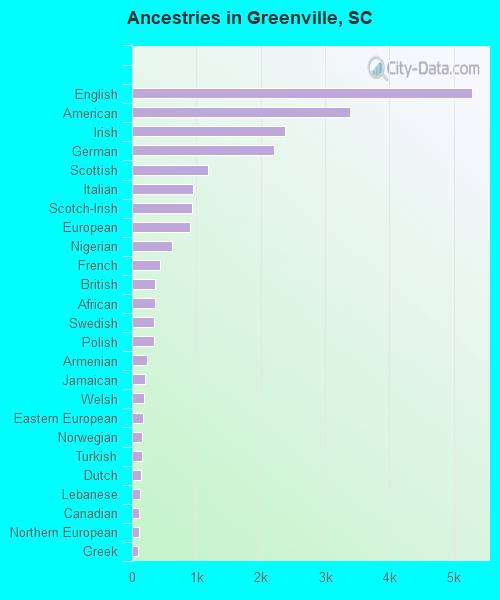
First ancestries reported:
English: 5,284 (14.0%)
American: 3,382 (8.9%)
Irish: 2,375 (6.3%)
German: 2,207 (5.8%)
Scottish: 1,186 (3.1%)
Italian: 952 (2.5%)
Scotch-Irish: 931 (2.5%)
European: 904 (2.4%)
Nigerian: 620 (1.6%)
French: 435 (1.2%)
British: 353 (0.9%)
African: 353 (0.9%)
Swedish: 339 (0.9%)
Polish: 339 (0.9%)
Armenian: 240 (0.6%)
Jamaican: 204 (0.5%)
Welsh: 183 (0.5%)
Eastern European: 166 (0.4%)
Norwegian: 157 (0.4%)
Turkish: 156 (0.4%)
Dutch: 135 (0.4%)
Lebanese: 131 (0.3%)
Canadian: 113 (0.3%)
Northern European: 102 (0.3%)
Greek: 93 (0.2%)
Yugoslavian: 91 (0.2%)
Hungarian: 62 (0.2%)
Romanian: 62 (0.2%)
Ukrainian: 62 (0.2%)
French Canadian: 61 (0.2%)
Portuguese: 59 (0.2%)
Finnish: 58 (0.2%)
Swiss: 53 (0.1%)
Russian: 47 (0.1%)
Trinidadian and Tobagonian: 31 (0.08%)
Ghanaian: 30 (0.08%)
South African: 29 (0.08%)
Danish: 29 (0.08%)
Czech: 28 (0.07%)
Brazilian: 27 (0.07%)
Slovak: 26 (0.07%)
West Indian: 21 (0.06%)
Austrian: 20 (0.05%)
Palestinian: 17 (0.04%)
Scandinavian: 16 (0.04%)
Croatian: 10 (0.03%)
Bulgarian: 9 (0.02%)
Ethiopian: 8 (0.02%)
Bahamian: 8 (0.02%)
Latvian: 7 (0.02%)
Belgian: 7 (0.02%)
Iranian: 6 (0.02%)
New Zealander: 6 (0.02%)
Ugandan: 6 (0.02%)
Syrian: 4 (0.01%)
Serbian: 3 (0.01%)
Haitian: 2 (0.01%)
Most common places of birth for foreign-born residents (%): Colombia Greenville:
11.1% (572)South Carolina:
4.3% (11,533)
Venezuela Greenville:
10.1% (522)South Carolina:
1.4% (3,822)
India Greenville:
8.7% (449)South Carolina:
6.8% (18,307)
Mexico Greenville:
8.1% (421)South Carolina:
22.5% (60,774)
Dominican Republic Greenville:
7.7% (400)South Carolina:
0.9% (2,357)
Canada Greenville:
5.9% (305)South Carolina:
3.0% (8,193)
Guatemala Greenville:
3.5% (179)South Carolina:
3.4% (9,058)
Jordan Greenville:
3.4% (176)South Carolina:
0.1% (353)
England Greenville:
3.0% (155)South Carolina:
1.9% (5,117)
China, excluding Hong Kong and Taiwan Greenville:
3.0% (155)South Carolina:
3.2% (8,721)
United Kingdom, excluding England and Scotland Greenville:
2.6% (135)South Carolina:
1.2% (3,296)
Turkey Greenville:
2.5% (128)South Carolina:
0.3% (701)
Jamaica Greenville:
2.2% (116)South Carolina:
2.6% (7,073)
Germany Greenville:
2.2% (112)South Carolina:
3.7% (9,982)
Honduras Greenville:
2.1% (110)South Carolina:
4.8% (12,834)
Scotland Greenville:
2.0% (103)South Carolina:
0.4% (1,092)
Philippines Greenville:
1.8% (92)South Carolina:
4.1% (11,031)
France Greenville:
1.6% (82)South Carolina:
0.7% (1,940)
Nigeria Greenville:
1.6% (81)South Carolina:
0.6% (1,652)
Korea Greenville:
1.5% (80)South Carolina:
1.7% (4,513)
Place of birth for U.S.-born residents:
This state: 32,989Other state: 32,808Northeast: 8,442Midwest: 6,455South: 15,871West: 2,040 79.8% of Greenville residents lived in the same house 1 years ago.
Out of people who lived in different houses, 25.9% lived in this county.
Out of people who lived in different counties, 37.7% lived in South Carolina.
Greenville:
79.8%State average:
86.5%
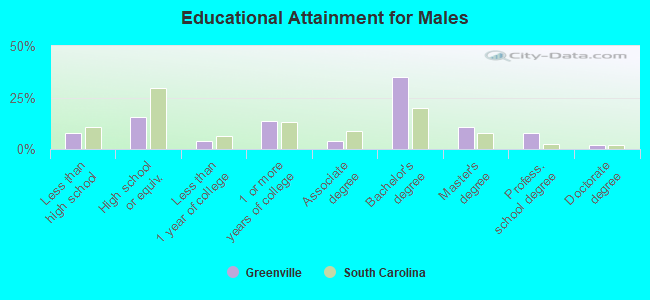
Education attainment for males 25 years and older:
No schooling: 31Nursery to 4th grade: 05th and 6th grade: 07th and 8th grade: 2559th grade: 2310th grade: 15411th grade: 33812th grade, no diploma: 1,265High school graduate (or equivalency): 3,952Less than 1 year of college: 990Some college more than 1 year, no degree: 3,567Associate degree: 1,048Bachelor's degree: 8,975Master's degree: 2,791Professional school degree: 1,971Doctorate degree: 459
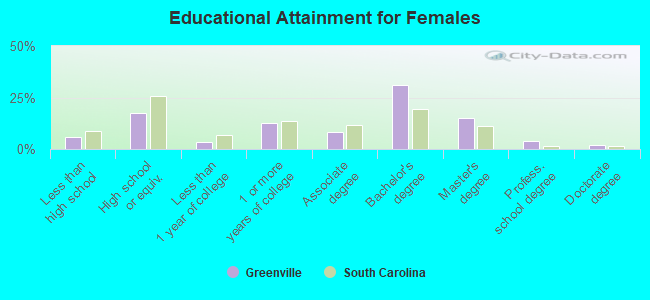
Education attainment for females 25 years and older:
No schooling: 140Nursery to 4th grade: 05th and 6th grade: 07th and 8th grade: 439th grade: 1310th grade: 22411th grade: 1,06812th grade, no diploma: 58High school graduate (or equivalency): 4,528Less than 1 year of college: 851Some college more than 1 year, no degree: 3,191Associate degree: 2,142Bachelor's degree: 7,994Master's degree: 3,865Professional school degree: 1,024Doctorate degree: 467
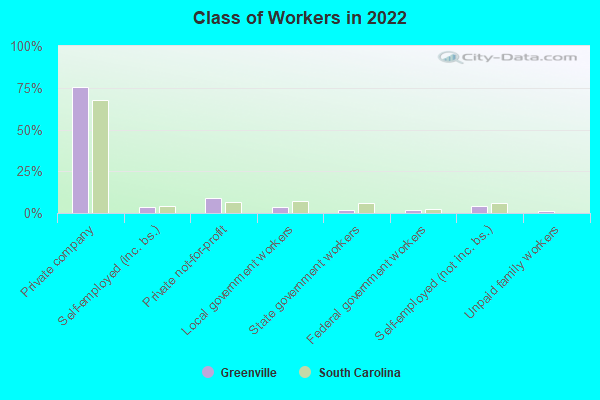
Housing units in structures:
One, detached: 17,617One, attached: 2,281Two: 1,7983 or 4: 1,2425 to 9: 3,33110 to 19: 3,89120 to 49: 3,00150 or more: 4,490Mobile homes: 511Boats, RVs, vans, etc.: 52Housing units lacking complete plumbing facilities in 2022: 1.3%Housing units lacking complete kitchen facilities in 2022: 1.7%House/condo owner moved in on average 9 years ago
Renter moved in on average 2 years ago
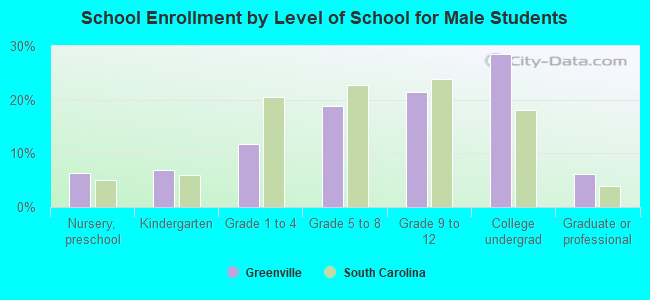
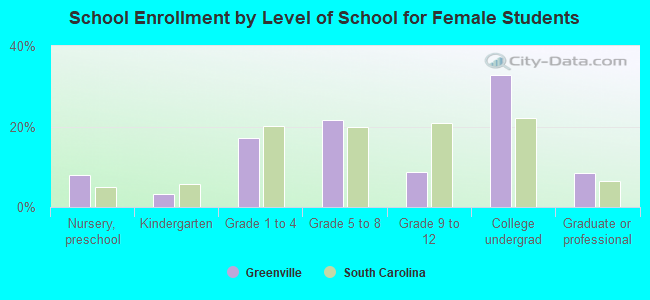
Private vs. public school enrollment:
Students in private schools in grades 1 to 8 (elementary and middle school): 1,049 Here:
20.9%South Carolina:
14.4%
Students in private schools in grades 9 to 12 (high school): 227 Here:
10.1%South Carolina:
11.1%
Students in private undergraduate colleges: 2,225 Here:
50.1%South Carolina:
21.9%