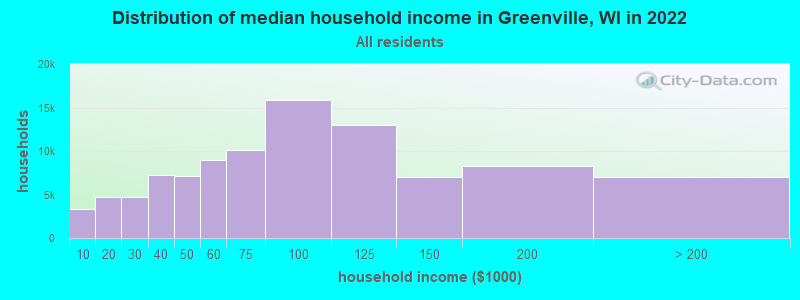
Median price asked for vacant for-sale houses and condos in 2022 in this county: $167,641.
Median contract rent in 2022: $1,179 (lower quartile is $910, upper quartile is $1,400)
Median gross rent in Greenville, WI in 2022: $1,415
Housing units in Greenville with a mortgage: 1,345 (179 second mortgage, 304 home equity loan, 0 both second mortgage and home equity loan) Houses without a mortgage: 354
In family households: 145,248 (36,416 male householders, 10,581 female householders)
37,914 spouses, 52,593 children (49,280 natural, 1,173 adopted, 2,140 stepchildren), 1,536 grandchildren, 1,017 brothers or sisters, 664 parents, foster children, 855 other relatives, 3,154 non-relatives
In nonfamily households: 28,408 (11,042 male householders (8,209 living alone)), 11,609 female householders (9,795 living alone)), 5,757 nonrelatives
In group quarters: 3,039 (1,363 institutionalized population)
35,807 married couples with children.
6,893 single-parent households (1,845 men, 5,048 women).
96.3% of residents of Greenville speak English at home.
2.6% of residents speak Spanish at home (52% speak English very well, 11% speak English well, 37% speak English not well).
1.0% of residents speak other Indo-European language at home (60% speak English very well, 29% speak English well, 11% speak English not well).
0.1% of residents speak Asian or Pacific Island language at home (100% speak English very well).
Foreign born population: 190 (2.3%)
(33.2% of them are naturalized citizens)
Year of entry for the foreign-born population in Greenville, Wisconsin
181995 to March 2000
141990 to 1994
151985 to 1989
211980 to 1984
141975 to 1979
01970 to 1974
131965 to 1969
23Before 1965
First ancestries reported:
German: 3,987 (46.8%)
Irish: 832 (9.8%)
Other: 560 (6.6%)
Polish: 455 (5.3%)
Norwegian: 433 (5.1%)
Dutch: 378 (4.4%)
United States: 378 (4.4%)
French: 339 (4.0%)
Swedish: 263 (3.1%)
English: 237 (2.8%)
Italian: 169 (2.0%)
Czech: 167 (2.0%)
French Canadian: 54 (0.6%)
Danish: 52 (0.6%)
Greek: 44 (0.5%)
Hungarian: 42 (0.5%)
Scotch-Irish: 41 (0.5%)
Scottish: 24 (0.3%)
Welsh: 24 (0.3%)
Swiss: 19 (0.2%)
Ukrainian: 18 (0.2%)
Russian: 9 (0.1%)
Most common places of birth for foreign-born residents (%):
El Salvador
Greenville:
35.6% (42)
Wisconsin:
0.4% (737)
Czechoslovakia (includes Czech Republic and Slovakia)
Greenville:
17.8% (21)
Wisconsin:
0.5% (1,060)
Canada
Greenville:
12.7% (15)
Wisconsin:
3.7% (7,189)
Austria
Greenville:
7.6% (9)
Wisconsin:
0.7% (1,281)
Yugoslavia
Greenville:
7.6% (9)
Wisconsin:
1.7% (3,241)
Laos
Greenville:
7.6% (9)
Wisconsin:
8.8% (17,072)
Germany
Greenville:
6.8% (8)
Wisconsin:
7.2% (13,863)
Brazil
Greenville:
4.2% (5)
Wisconsin:
0.4% (739)
Place of birth for U.S.-born residents:
This state: 5,435
Other state: 1,262
Northeast: 225
Midwest: 745
South: 191
West: 101
57% of Greenville residents lived in the same house 5 years ago. Out of people who lived in different houses, 41% lived in this county. Out of people who lived in different counties, 77% lived in Wisconsin.
Education attainment for males 25 years and older:
No schooling: 0
Nursery to 4th grade: 0
5th and 6th grade: 36
7th and 8th grade: 36
9th grade: 7
10th grade: 24
11th grade: 30
12th grade, no diploma: 8
High school graduate (or equivalency): 833
Less than 1 year of college: 118
Some college more than 1 year, no degree: 281
Associate degree: 217
Bachelor's degree: 444
Master's degree: 158
Professional school degree: 0
Doctorate degree: 0
Education attainment for females 25 years and older: