Grove City, OH (Ohio) Houses and Residents
| Grove City: | $302,258 |
| Ohio: | $204,100 |
Total population: 38,519 (Urban population: 26,805, Rural population: 215 (all nonfarm))
Houses: 18,108 (17,248 occupied: 12,129 owner occupied, 5,009 renter occupied)
| % of renters here: | 29% |
| State: | 33% |
Housing density: 1,298 houses/condos per square mile
Median price asked for vacant for-sale houses and condos in 2022: $175,126.
Median contract rent in 2022: $1,076 (lower quartile is $891, upper quartile is $1,303)
Median rent asked for vacant for-rent units in 2022: $1,539
Median gross rent in Grove City, OH in 2022: $1,249
Housing units in Grove City with a mortgage: 8,792 (1,126 second mortgage, 0 home equity loan, 1,006 both second mortgage and home equity loan)
Houses without a mortgage: 366
Median household income for houses/condos with a mortgage: $117,212
Median household income for apartments without a mortgage: $83,436
Median monthly housing costs: $1,386
Compare current foreclosures in Grove City, OH:
| Photo | Address | Area | Beds / Baths | Price | Details |
|---|---|---|---|---|---|

|
#1
Ashgrove Dr
Grove City, OH 43123
|
1,772 sq. feet
|
2 baths 4 beds |
show details | |

|
#2
London Groveport Rd
Grove City, OH 43123
|
816 sq. feet
|
1 baths 2 beds |
show details | |

|
#3
Fergus Rd
Grove City, OH 43123
|
3,312 sq. feet
|
2 baths 4 beds |
show details | |

|
#4
Sapphire Dr
Grove City, OH 43123
|
3,241 sq. feet
|
3 baths 4 beds |
show details | |

|
#5
Genteel Dr
Grove City, OH 43123
|
1,980 sq. feet
|
2 baths 4 beds |
show details | |

|
#6
Hoover Ct
Grove City, OH 43123
|
1,472 sq. feet
|
1 baths 3 beds |
show details | |

|
#7
Michelle Dr
Grove City, OH 43123
|
1,452 sq. feet
|
2 baths 3 beds |
show details | |

|
#8
Opossum Run Rd
Grove City, OH 43123
|
2,551 sq. feet
|
2 baths 3 beds |
show details | |

|
#9
Cannonmills Dr
Grove City, OH 43123
|
1,251 sq. feet
|
2 baths 3 beds |
show details | |

|
#10
Norton Rd
Grove City, OH 43123
|
1,876 sq. feet
|
2 baths 4 beds |
show details |
| Photo | Address | Area | Beds / Baths | Price | Details |
|---|---|---|---|---|---|

|
#11
Windsor Pl
Grove City, OH 43123
|
1,955 sq. feet
|
2 baths 3 beds |
show details | |

|
#12
Stephen St
Grove City, OH 43123
|
1,027 sq. feet
|
1 baths 3 beds |
show details | |

|
#13
Slate Cove Rd
Grove City, OH 43123
|
1,016 sq. feet
|
2 baths 3 beds |
show details | |

|
#14
Sunrush Ct
Grove City, OH 43123
|
1,908 sq. feet
|
2 baths 4 beds |
show details | |

|
#15
Brookgrove Dr
Grove City, OH 43123
|
942 sq. feet
|
1 baths 3 beds |
show details | |

|
#16
Blue Rock Blvd
Grove City, OH 43123
|
1,644 sq. feet
|
2 baths 4 beds |
show details | |

|
#17
Beaver Lake Dr
Grove City, OH 43123
|
2,144 sq. feet
|
2 baths 4 beds |
show details | |

|
#18
Sonora Dr
Grove City, OH 43123
|
1,414 sq. feet
|
1 baths 2 beds |
show details | |

|
#19
Bay Port Dr
Grove City, OH 43123
|
2,044 sq. feet
|
2 baths 4 beds |
show details | |

|
#20
Rosette Dr
Grove City, OH 43123
|
1,746 sq. feet
|
2 baths 3 beds |
show details |
| Photo | Address | Area | Beds / Baths | Price | Details |
|---|---|---|---|---|---|

|
#21
Forest Glen Dr
Grove City, OH 43123
|
2,040 sq. feet
|
2 baths 4 beds |
show details | |

|
#22
Acorn Ct
Grove City, OH 43123
|
2,708 sq. feet
|
4 baths 4 beds |
show details | |

|
#23
Willow View Dr
Grove City, OH 43123
|
948 sq. feet
|
1 baths 3 beds |
show details | |

|
#24
Woodgrove Dr
Grove City, OH 43123
|
1,582 sq. feet
|
2 baths 4 beds |
show details | |

|
#25
Gays Dr
Grove City, OH 43123
|
914 sq. feet
|
1 baths 2 beds |
show details | |

|
#26
Mayflower Cir
Grove City, OH 43123
|
2,084 sq. feet
|
2 baths 4 beds |
show details | |

|
#27
Cedar Creek Dr
Grove City, OH 43123
|
1,206 sq. feet
|
1 baths 4 beds |
show details | |

|
#28
Tolbert Ave
Grove City, OH 43123
|
1,240 sq. feet
|
2 baths 3 beds |
show details | |

|
#29
Queens Meadow Ln
Grove City, OH 43123
|
1,630 sq. feet
|
2 baths 4 beds |
show details | |

|
#30
Manley Way
Grove City, OH 43123
|
1,443 sq. feet
|
3 baths 2 beds |
show details |
| Photo | Address | Area | Beds / Baths | Price | Details |
|---|---|---|---|---|---|

|
#31
Young Rd
Grove City, OH 43123
|
1,471 sq. feet
|
2 baths 3 beds |
show details | |

|
#32
Northbranch Rd
Grove City, OH 43123
|
1,790 sq. feet
|
2 baths 3 beds |
show details | |

|
#33
Scioto Meadows Blvd
Grove City, OH 43123
|
1,580 sq. feet
|
2 baths 2 beds |
show details | |

|
#34
Moyer Ln
Grove City, OH 43123
|
1,350 sq. feet
|
2 baths 3 beds |
show details | |

|
#35
Blue Rock Blvd
Grove City, OH 43123
|
1,266 sq. feet
|
1 baths 3 beds |
show details | |

|
#36
Fergus Rd
Grove City, OH 43123
|
3,794 sq. feet
|
2 baths 4 beds |
show details | |

|
#37
Shirlene Dr
Grove City, OH 43123
|
1,420 sq. feet
|
2 baths 3 beds |
show details | |

|
#38
Bloxom St
Grove City, OH 43123
|
1,512 sq. feet
|
2 baths 3 beds |
show details | |

|
#39
Darby Blvd
Grove City, OH 43123
|
905 sq. feet
|
1 baths 2 beds |
show details | |

|
#40
Hoover Rd
Grove City, OH 43123
|
1,336 sq. feet
|
1 baths 3 beds |
show details |
| Photo | Address | Area | Beds / Baths | Price | Details |
|---|---|---|---|---|---|

|
#41
Rosette Dr
Grove City, OH 43123
|
1,980 sq. feet
|
2 baths 4 beds |
show details | |

|
#42
Spring Cress Ave
Grove City, OH 43123
|
1,221 sq. feet
|
2 baths 3 beds |
show details | |

|
#43
Casa Blvd
Grove City, OH 43123
|
1,002 sq. feet
|
1 baths 2 beds |
show details | |

|
#44
Norton Rd
Grove City, OH 43123
|
1,330 sq. feet
|
1 baths 3 beds |
show details | |

|
#45
Chinquo St
Grove City, OH 43123
|
1,350 sq. feet
|
1 baths 3 beds |
show details | |

|
#46
Sundew Ave
Grove City, OH 43123
|
1,802 sq. feet
|
2 baths 3 beds |
show details | |

|
#47
Farmbrook Cir N
Grove City, OH 43123
|
1,237 sq. feet
|
2 baths 2 beds |
show details | |

|
#48
Thornoak Dr
Grove City, OH 43123
|
2,134 sq. feet
|
2 baths 4 beds |
show details | |

|
#49
Willowgate Rd
Grove City, OH 43123
|
1,330 sq. feet
|
2 baths 3 beds |
show details | |

|
Check over 1 million property listings on Foreclosure.com!
|
browse all offers | |||


 | Columbus suburbs with houses not so close to each other (7 replies) |
| Real estate agent in grove city (0 replies) |
| Is Columbus the best city in the Midwest? (709 replies) |
| Where do affordable houses move fastest? (8 replies) |
| Apartments in Columbus = All the same (25 replies) |
| Moving to Columbus area, can't find a home to rent, pls HELP!!! (3 replies) |

Median year apartment built: 1987
Household type by relationship:
Households: 41,538- Male householders: 7,883 (1,797 living alone), Female householders: 9,060 (2,431 living alone)
9,146 spouses (9,091 opposite-sex spouses), 1,126 unmarried partners, (1,098 opposite-sex unmarried partners), 11,582 children (11,054 natural, 101 adopted, 426 stepchildren), 377 grandchildren, 391 brothers or sisters, 552 parents, 69 foster children, 339 other relatives, 727 non-relatives
- In group quarters: 282
Size of family households: 5,485 2-persons, 3,110 3-persons, 1,760 4-persons, 1,026 5-persons, 225 6-persons, 102 7-or-more-persons.
Size of nonfamily households: 4,414 1-person, 901 2-persons, 13 3-persons.
6,972 married couples with children.
2,221 single-parent households (764 men, 1,457 women).
92.6% of residents of Grove City speak English at home.
1.9% of residents speak Spanish at home (70% speak English very well, 12% speak English well, 18% speak English not well).
3.6% of residents speak other Indo-European language at home (60% speak English very well, 35% speak English well, 5% speak English not well).
0.9% of residents speak Asian or Pacific Island language at home (30% speak English very well, 52% speak English well, 18% speak English not well).
0.5% of residents speak other language at home (88% speak English very well, 12% speak English well).
Foreign born population: 1,540 (3.7%)
(49.9% of them are naturalized citizens)
| Here: | 6.8 |
| State: | 6.7 |
| Here: | 4.2 |
| State: | 4.4 |

- Bedrooms in owner-occupied houses and condos in Grove City, Ohio
- 17no bedroom
- 241 bedroom
- 1,9062 bedrooms
- 5,6863 bedrooms
- 4,0814 bedrooms
- 4155+ bedrooms

- Bedrooms in renter-occupied apartments in Grove City, Ohio
- 131no bedroom
- 1,1671 bedroom
- 2,5252 bedrooms
- 9233 bedrooms
- 2144 bedrooms
- 515+ bedrooms

- Cars and other vehicles available in Grove City in owner-occupied houses/condos
- 335no vehicle
- 2,6771 vehicle
- 5,7832 vehicles
- 2,3733 vehicles
- 7284 vehicles
- 2345+ vehicles

- Cars and other vehicles available in Grove City in renter-occupied apartments
- 483no vehicle
- 2,6641 vehicle
- 1,4032 vehicles
- 4283 vehicles
- 114 vehicles
- 215+ vehicles

- Rooms in owner-occupied houses in Grove City, Ohio
- 01 room
- 72 rooms
- 3433 rooms
- 9704 rooms
- 1,5265 rooms
- 2,6566 rooms
- 1,9987 rooms
- 2,0228 rooms
- 2,6099+ rooms

- Rooms in renter-occupied apartments in Grove City, Ohio
- 1181 room
- 3812 rooms
- 7073 rooms
- 1,6944 rooms
- 8205 rooms
- 4736 rooms
- 3447 rooms
- 528 rooms
- 4229+ rooms


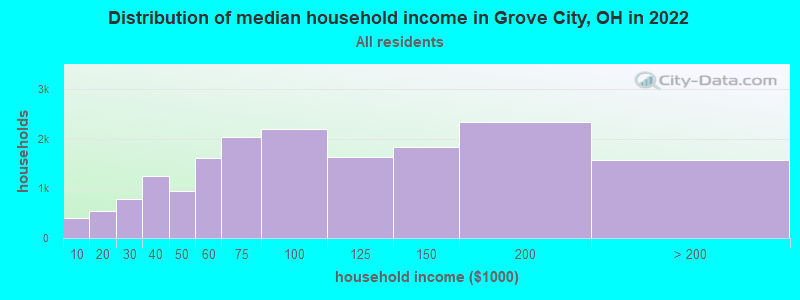
Grove City, OH household income distribution

- 412Less than $10,000
- 545$10,000 to $19,999
- 780$20,000 to $29,999
- 1,246$30,000 to $39,999
- 956$40,000 to $49,999
- 1,621$50,000 to $59,999
- 2,031$60,000 to $74,999
- 2,192$75,000 to $99,999
- 1,626$100,000 to $124,999
- 1,826$125,000 to $149,999
- 2,339$150,000 to $199,999
- 1,564$200,000 or more
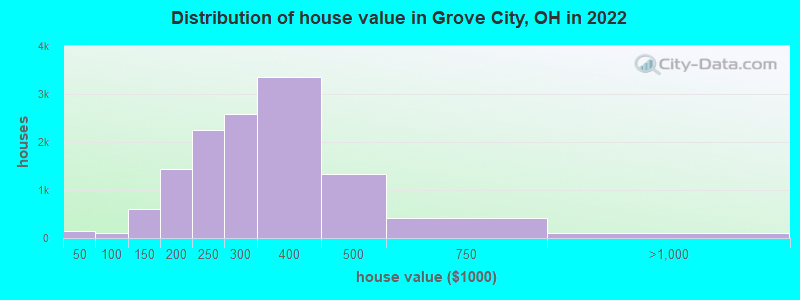
Home value of owner - occupied houses in 2022 in Grove City, OH
-
- 39$10,000 to $14,999
- 17$15,000 to $19,999
- 30$20,000 to $24,999
- 42$25,000 to $29,999
- 14$35,000 to $39,999
- 3$60,000 to $69,999
- 13$70,000 to $79,999
- 36$80,000 to $89,999
- 54$90,000 to $99,999
- 284$100,000 to $124,999
- 323$125,000 to $149,999
- 629$150,000 to $174,999
- 816$175,000 to $199,999
- 2,251$200,000 to $249,999
- 2,587$250,000 to $299,999
- 3,346$300,000 to $399,999
- 1,333$400,000 to $499,999
- 421$500,000 to $749,999
- 102$750,000 to $999,999
Rent paid by renters in 2022 in Grove City, OH
-
- 14Less than $100
- 16$100 to $149
- 23$200 to $249
- 16$250 to $299
- 13$300 to $349
- 18$350 to $399
- 141$400 to $449
- 33$450 to $499
- 29$500 to $549
- 78$550 to $599
- 42$600 to $649
- 204$650 to $699
- 119$700 to $749
- 91$750 to $799
- 441$800 to $899
- 813$900 to $999
- 1,526$1,000 to $1,249
- 631$1,250 to $1,499
- 684$1,500 to $1,999
- 0$2,000 to $2,499
- 50$3,000 to $3,499
- 16$3,500 or more
- 236No cash rent


Percentage of workers working in this county: 90.0%
Number of people working at home: 3,015 (13.4% of all workers)
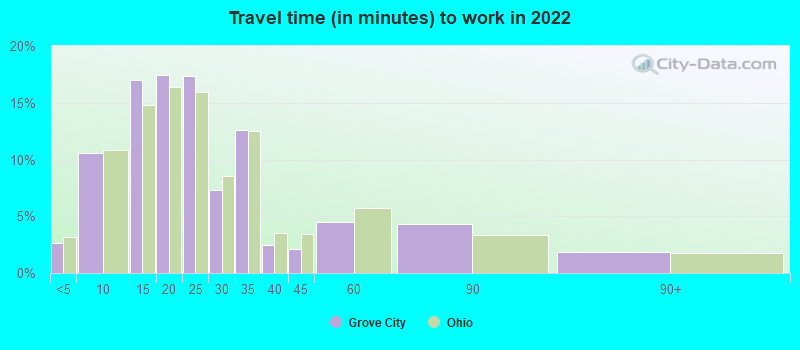
Travel time to work (commute)
- Less than 5 minutes: 262
- 5 to 9 minutes: 1,968
- 10 to 14 minutes: 2,900
- 15 to 19 minutes: 2,436
- 20 to 24 minutes: 3,721
- 25 to 29 minutes: 2,042
- 30 to 34 minutes: 3,030
- 35 to 39 minutes: 837
- 40 to 44 minutes: 502
- 45 to 59 minutes: 681
- 60 to 89 minutes: 404
- 90 or more minutes: 131
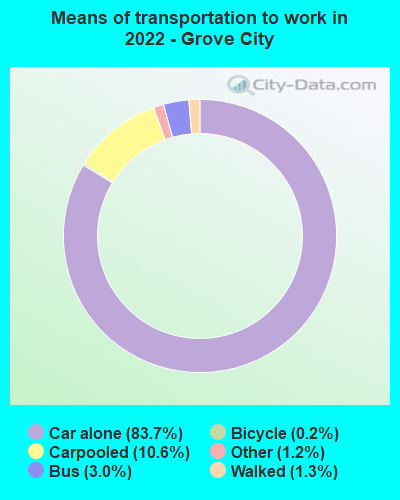
Means of transportation to work:
- Drove a car alone: 18,890 (71.6%)
- Carpooled: 2,805 (10.6%)
- Bus: 749 (2.8%)
- Taxi: 348 (1.3%)
- Bicycle: 43 (0.2%)
- Walked: 253 (1.0%)
- Worked at home: 3,015 (11.4%)

- Unemployment by race in 2022
- Unemployment rate for White non-Hispanic residents
- 2.3%Males
- 1.1%Females
- Unemployment rate for Asian residents
- 4.2%Males
- Unemployment rate for other race residents
- 11.9%Males
- Unemployment rate for two or more race residents
- 4.6%Males
- 2.5%Females
- Unemployment rate for Hispanic or Latino residents
- 7.3%Males
- 4.2%Females

- Year of entry for the foreign-born population in Grove City, Ohio
- 5562010 or later
- 2622000 to 2009
- 3901990 to 1999
- 1031980 to 1989
- 481970 to 1979
- 71Before 1970

First ancestries reported:
- German: 4,779 (23.6%)
- American: 3,203 (15.8%)
- English: 2,232 (11.0%)
- Irish: 1,698 (8.4%)
- Italian: 792 (3.9%)
- European: 481 (2.4%)
- Welsh: 287 (1.4%)
- Scotch-Irish: 275 (1.4%)
- Polish: 269 (1.3%)
- Scottish: 236 (1.2%)
- Danish: 158 (0.8%)
- Ukrainian: 139 (0.7%)
- French: 109 (0.5%)
- British: 88 (0.4%)
- Croatian: 66 (0.3%)
- Hungarian: 62 (0.3%)
- Ghanaian: 61 (0.3%)
- Brazilian: 59 (0.3%)
- Russian: 53 (0.3%)
- Eastern European: 51 (0.3%)
- French Canadian: 48 (0.2%)
- Belgian: 26 (0.1%)
- Romanian: 23 (0.1%)
- African: 23 (0.1%)
- Serbian: 20 (0.10%)
- Austrian: 17 (0.08%)
- Northern European: 15 (0.07%)
- Swiss: 15 (0.07%)
- Czechoslovakian: 13 (0.06%)
- Canadian: 12 (0.06%)
- Slovak: 12 (0.06%)
- Dutch: 6 (0.03%)
- Pennsylvania German: 6 (0.03%)
- Swedish: 3 (0.01%)
Most common places of birth for foreign-born residents (%):
| Grove City: | 12.1% (182) |
| Ohio: | 6.2% (35,703) |
| Grove City: | 10.6% (160) |
| Ohio: | 1.7% (9,564) |
| Grove City: | 8.5% (128) |
| Ohio: | 0.5% (2,620) |
| Grove City: | 7.1% (107) |
| Ohio: | 7.8% (44,796) |
| Grove City: | 7.0% (105) |
| Ohio: | 1.9% (10,960) |
| Grove City: | 6.7% (101) |
| Ohio: | 11.6% (66,525) |
| Grove City: | 5.4% (82) |
| Ohio: | 1.4% (7,947) |
| Grove City: | 3.5% (53) |
| Ohio: | 0.1% (433) |
| Grove City: | 3.5% (52) |
| Ohio: | 1.5% (8,452) |
| Grove City: | 3.5% (52) |
| Ohio: | 1.8% (10,561) |
| Grove City: | 3.4% (51) |
| Ohio: | 0.9% (5,101) |
| Grove City: | 3.3% (50) |
| Ohio: | 2.2% (12,846) |
| Grove City: | 3.1% (47) |
| Ohio: | 3.1% (17,818) |
| Grove City: | 2.8% (42) |
| Ohio: | 0.2% (1,065) |
| Grove City: | 2.8% (42) |
| Ohio: | 2.6% (14,988) |
| Grove City: | 2.3% (35) |
| Ohio: | 0.8% (4,549) |
| Grove City: | 2.3% (34) |
| Ohio: | 0.5% (3,090) |
Place of birth for U.S.-born residents:
- This state: 32,914
- Other state: 6,695
- Northeast: 1,515
- Midwest: 1,658
- South: 2,482
- West: 1,024
85.3% of Grove City residents lived in the same house 1 years ago.
Out of people who lived in different houses, 41.5% lived in this county.
Out of people who lived in different counties, 72.6% lived in Ohio.
| Grove City: | 85.3% |
| State average: | 87.8% |
Education attainment for males 25 years and older:
- No schooling: 207
- Nursery to 4th grade: 50
- 5th and 6th grade: 9
- 7th and 8th grade: 24
- 9th grade: 457
- 10th grade: 65
- 11th grade: 148
- 12th grade, no diploma: 469
- High school graduate (or equivalency): 4,331
- Less than 1 year of college: 1,219
- Some college more than 1 year, no degree: 1,885
- Associate degree: 1,102
- Bachelor's degree: 2,874
- Master's degree: 1,063
- Professional school degree: 163
- Doctorate degree: 205

Education attainment for females 25 years and older:
- No schooling: 95
- Nursery to 4th grade: 0
- 5th and 6th grade: 14
- 7th and 8th grade: 37
- 9th grade: 25
- 10th grade: 70
- 11th grade: 336
- 12th grade, no diploma: 185
- High school graduate (or equivalency): 4,681
- Less than 1 year of college: 941
- Some college more than 1 year, no degree: 1,898
- Associate degree: 1,370
- Bachelor's degree: 3,827
- Master's degree: 1,366
- Professional school degree: 111
- Doctorate degree: 321


Housing units in structures:
- One, detached: 11,795
- One, attached: 2,032
- Two: 247
- 3 or 4: 1,350
- 5 to 9: 1,491
- 10 to 19: 88
- 20 to 49: 158
- 50 or more: 916
- Mobile homes: 28
Housing units lacking complete kitchen facilities in 2022: 1.0%
House/condo owner moved in on average 10 years ago
Renter moved in on average 3 years ago

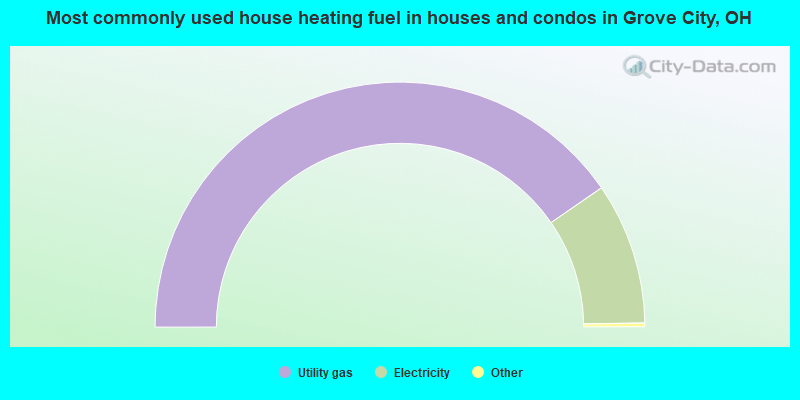
- 80.7%Utility gas
- 18.7%Electricity
- 0.4%Bottled, tank, or LP gas
- 0.1%No fuel used
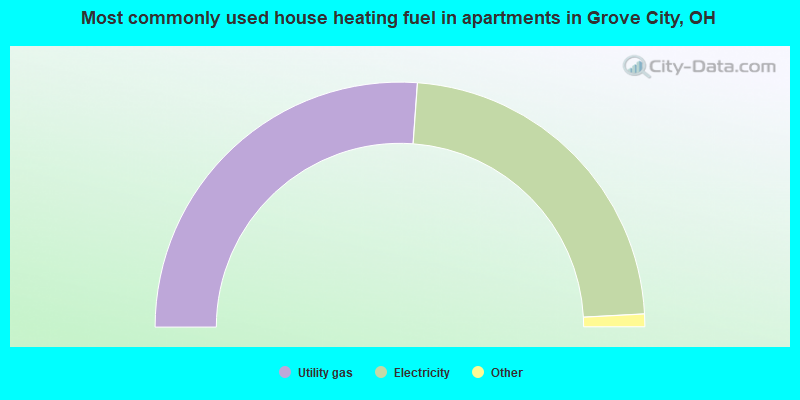
- 52.3%Utility gas
- 46.0%Electricity
- 1.3%Bottled, tank, or LP gas
- 0.3%No fuel used
- 0.2%Other fuel
Private vs. public school enrollment:
| Here: | 7.7% |
| Ohio: | 16.0% |
| Here: | 5.6% |
| Ohio: | 13.1% |
| Here: | 21.8% |
| Ohio: | 22.3% |


