Guerneville, CA (California) Houses and Residents
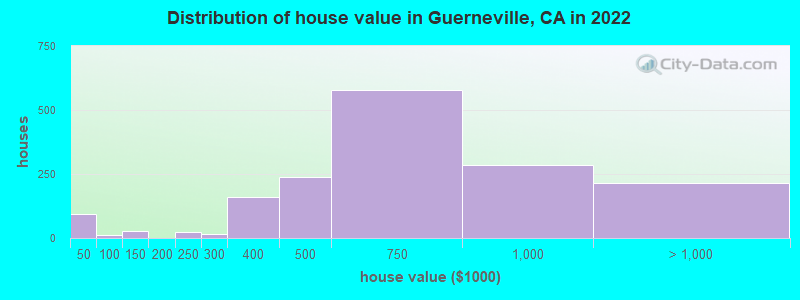
| Guerneville: | $609,281 |
| California: | $715,900 |
Total population: 4,534 (Urban population: 2,117 (all inside urban clusters), Rural population: 350 (all nonfarm))
Houses: 3,229 (2,489 occupied: 1,728 owner occupied, 789 renter occupied)
| % of renters here: | 31% |
| State: | 44% |
Housing density: 983 houses/condos per square mile
Median price asked for vacant for-sale houses and condos in 2022: $872,795.
Median contract rent in 2022: $1,221 (lower quartile is $993, upper quartile is $1,808)
Median rent asked for vacant for-rent units in 2022: $6,870
Median gross rent in Guerneville, CA in 2022: $1,406
Housing units in Guerneville with a mortgage: 1,074 (32 second mortgage, 0 home equity loan, 22 both second mortgage and home equity loan)
Houses without a mortgage: 0
Median household income for houses/condos with a mortgage: $93,627
Median household income for apartments without a mortgage: $72,243
Median monthly housing costs: $1,591
Compare current foreclosures near Guerneville, CA:
| Photo | Address | Area | Beds / Baths | Price | Details |
|---|---|---|---|---|---|

|
#1
Hidden Valley Rd
Guerneville, CA 95446
|
284 sq. feet
|
1 baths 1 beds |
$199,900
|
show details |

|
#2
Melody Ave
Guerneville, CA 95446
|
- sq. feet
|
- baths - beds |
show details | |

|
#3
Mcconnell Ave
Santa Rosa, CA 95404
|
1,216 sq. feet
|
2 baths 4 beds |
show details | |

|
#4
Corby Ave
Santa Rosa, CA 95407
|
836 sq. feet
|
1 baths 2 beds |
show details | |

|
#5
Carson St
Santa Rosa, CA 95403
|
1,408 sq. feet
|
2 baths 3 beds |
show details | |

|
#6
Harvest Ln
Santa Rosa, CA 95401
|
1,062 sq. feet
|
2 baths 2 beds |
show details | |

|
#7
Mill Station Rd
Sebastopol, CA 95472
|
2,992 sq. feet
|
2 baths 4 beds |
show details | |

|
#8
Alton Ln
Santa Rosa, CA 95403
|
1,422 sq. feet
|
2 baths 3 beds |
show details | |

|
#9
Ridgway Ave
Santa Rosa, CA 95401
|
1,603 sq. feet
|
2 baths 3 beds |
show details | |

|
#10
Decanter Cir
Windsor, CA 95492
|
2,855 sq. feet
|
2 baths 4 beds |
show details |
| Photo | Address | Area | Beds / Baths | Price | Details |
|---|---|---|---|---|---|

|
#11
Chiquita Rd
Healdsburg, CA 95448
|
1,606 sq. feet
|
1 baths 2 beds |
show details | |

|
#12
Graton Rd
Sebastopol, CA 95472
|
2,235 sq. feet
|
3 baths 4 beds |
show details | |

|
#13
Montecito Ave
Santa Rosa, CA 95404
|
1,537 sq. feet
|
2 baths 2 beds |
show details | |

|
#14
Donahue Ave
Santa Rosa, CA 95401
|
1,587 sq. feet
|
3 baths 3 beds |
show details | |

|
#15
S Wright Rd
Santa Rosa, CA 95407
|
1,274 sq. feet
|
1 baths 3 beds |
show details | |

|
#16
Malibu Cir
Santa Rosa, CA 95401
|
1,300 sq. feet
|
3 baths 3 beds |
show details | |

|
#17
Golden Gate Ave
Santa Rosa, CA 95407
|
500 sq. feet
|
1 baths 2 beds |
show details | |

|
#18
Tzabaco Creek Rd
Geyserville, CA 95441
|
1,536 sq. feet
|
2 baths 3 beds |
show details | |

|
#19
Match Point Ave
Santa Rosa, CA 95407
|
2,942 sq. feet
|
3 baths 3 beds |
show details | |

|
#20
Ashwood Dr
Santa Rosa, CA 95407
|
1,287 sq. feet
|
1 baths 4 beds |
show details |
| Photo | Address | Area | Beds / Baths | Price | Details |
|---|---|---|---|---|---|

|
#21
Gate Way
Santa Rosa, CA 95401
|
1,218 sq. feet
|
2 baths 3 beds |
show details | |

|
#22
Spinnaker Pl
Santa Rosa, CA 95403
|
1,307 sq. feet
|
2 baths 3 beds |
show details | |

|
#23
Big Oak Dr
Santa Rosa, CA 95401
|
1,775 sq. feet
|
3 baths 3 beds |
show details | |

|
#24
Barbara Dr
Sebastopol, CA 95472
|
960 sq. feet
|
1 baths 2 beds |
show details | |

|
#25
Tokay St
Santa Rosa, CA 95404
|
1,569 sq. feet
|
3 baths 4 beds |
show details | |

|
#26
El Mercado Pkwy
Santa Rosa, CA 95403
|
1,439 sq. feet
|
3 baths 3 beds |
show details | |

|
#27
Barnett Valley Rd
Sebastopol, CA 95472
|
1,790 sq. feet
|
2 baths 4 beds |
show details | |

|
#28
Parkside Dr
Santa Rosa, CA 95404
|
1,198 sq. feet
|
2 baths 3 beds |
show details | |

|
#29
Ludwig Ave
Santa Rosa, CA 95407
|
1,062 sq. feet
|
1 baths 2 beds |
show details | |

|
#30
Aston Cir
Santa Rosa, CA 95404
|
1,012 sq. feet
|
3 baths 3 beds |
show details |
| Photo | Address | Area | Beds / Baths | Price | Details |
|---|---|---|---|---|---|

|
#31
Wright St
Santa Rosa, CA 95404
|
1,208 sq. feet
|
1 baths 2 beds |
show details | |

|
#32
Raccoon Ln
Santa Rosa, CA 95401
|
1,163 sq. feet
|
3 baths 2 beds |
show details | |

|
#33
Rose Ave
Santa Rosa, CA 95407
|
1,407 sq. feet
|
1 baths 3 beds |
show details | |

|
#34
Marble St
Santa Rosa, CA 95407
|
1,623 sq. feet
|
2 baths 3 beds |
show details | |

|
#35
De Meo St
Santa Rosa, CA 95407
|
1,901 sq. feet
|
3 baths 4 beds |
show details | |

|
#36
Santa Barbara Dr
Santa Rosa, CA 95404
|
877 sq. feet
|
1 baths 2 beds |
show details | |

|
#37
Ridgway Ave
Santa Rosa, CA 95401
|
1,603 sq. feet
|
2 baths 3 beds |
show details | |

|
#38
Goldpan Cir
Santa Rosa, CA 95407
|
1,700 sq. feet
|
3 baths 3 beds |
show details | |

|
#39
Crystal Dr
Santa Rosa, CA 95404
|
1,245 sq. feet
|
2 baths 3 beds |
show details | |

|
#40
Antelope Ln
Santa Rosa, CA 95407
|
1,700 sq. feet
|
3 baths 4 beds |
show details |
| Photo | Address | Area | Beds / Baths | Price | Details |
|---|---|---|---|---|---|

|
#41
Leo Dr
Santa Rosa, CA 95407
|
1,873 sq. feet
|
2 baths 3 beds |
show details | |

|
#42
Colgan Ave
Santa Rosa, CA 95404
|
1,340 sq. feet
|
1 baths 2 beds |
show details | |

|
#43
Stony Point Rd
Santa Rosa, CA 95407
|
1,844 sq. feet
|
3 baths 3 beds |
show details | |

|
#44
Debbie Dr
Santa Rosa, CA 95407
|
1,077 sq. feet
|
2 baths 3 beds |
show details | |

|
#45
Hewett St
Santa Rosa, CA 95401
|
2,432 sq. feet
|
2 baths 4 beds |
show details | |

|
#46
Autumn Walk Dr
Santa Rosa, CA 95403
|
- sq. feet
|
2 baths 3 beds |
show details | |

|
#47
Hilltop Rd
Healdsburg, CA 95448
|
949 sq. feet
|
1 baths 1 beds |
show details | |

|
#48
Frei Rd # C
Sebastopol, CA 95472
|
2,396 sq. feet
|
3 baths 4 beds |
show details | |

|
#49
Wooded Glen Ct
Windsor, CA 95492
|
1,633 sq. feet
|
3 baths 4 beds |
show details | |

|
Check over 1 million property listings on Foreclosure.com!
|
browse all offers | |||

Latest news about housing in Guerneville, CA collected exclusively by city-data.com from local newspapers, TV, and radio stations

 | Guerneville/Russian River - Living Year Round? (12 replies) |
| Guerneville rents? (5 replies) |
| Where is the highest standard of living for the price in California? (41 replies) |
| Paso Robles vs Healdsburg (4 replies) |
| Gay Couple Looking for Small Liberal Forest Town in CA (35 replies) |
| Things You Should Know Before Moving to Sonoma County (49 replies) |

Median year apartment built: 1963
Household type by relationship:
Households: 4,707- Male householders: 1,317 (625 living alone), Female householders: 1,106 (390 living alone)
805 spouses (755 opposite-sex spouses), 289 unmarried partners, (244 opposite-sex unmarried partners), 690 children (674 natural, 0 adopted, 15 stepchildren), 49 grandchildren, 28 brothers or sisters, 29 parents, 0 foster children, 58 other relatives, 322 non-relatives
- In group quarters: 9
Size of family households: 702 2-persons, 232 3-persons, 104 4-persons, 42 5-persons, 15 6-persons, 7 7-or-more-persons.
Size of nonfamily households: 1,118 1-person, 237 2-persons, 130 3-persons.
239 married couples with children.
159 single-parent households (8 men, 151 women).
91.1% of residents of Guerneville speak English at home.
8.2% of residents speak Spanish at home (63% speak English very well, 14% speak English well, 23% speak English not well).
1.0% of residents speak other Indo-European language at home (100% speak English very well).
0.4% of residents speak other language at home (53% speak English well, 47% speak English not well).
Foreign born population: 284 (6.0%)
(69.0% of them are naturalized citizens)
| Here: | 4.9 |
| State: | 6.0 |
| Here: | 3.5 |
| State: | 3.9 |

- Bedrooms in owner-occupied houses and condos in Guerneville, California
- 0no bedroom
- 1581 bedroom
- 6132 bedrooms
- 7923 bedrooms
- 1564 bedrooms
- 105+ bedrooms

- Bedrooms in renter-occupied apartments in Guerneville, California
- 91no bedroom
- 1721 bedroom
- 3992 bedrooms
- 1173 bedrooms
- 94 bedrooms
- 05+ bedrooms

- Cars and other vehicles available in Guerneville in owner-occupied houses/condos
- 82no vehicle
- 5821 vehicle
- 5392 vehicles
- 3383 vehicles
- 744 vehicles
- 1145+ vehicles

- Cars and other vehicles available in Guerneville in renter-occupied apartments
- 109no vehicle
- 2631 vehicle
- 3352 vehicles
- 833 vehicles
- 04 vehicles
- 05+ vehicles

- Rooms in owner-occupied houses in Guerneville, California
- 01 room
- 162 rooms
- 1563 rooms
- 4014 rooms
- 5035 rooms
- 3466 rooms
- 1497 rooms
- 768 rooms
- 819+ rooms

- Rooms in renter-occupied apartments in Guerneville, California
- 611 room
- 1192 rooms
- 1963 rooms
- 1974 rooms
- 1295 rooms
- 96 rooms
- 347 rooms
- 218 rooms
- 249+ rooms


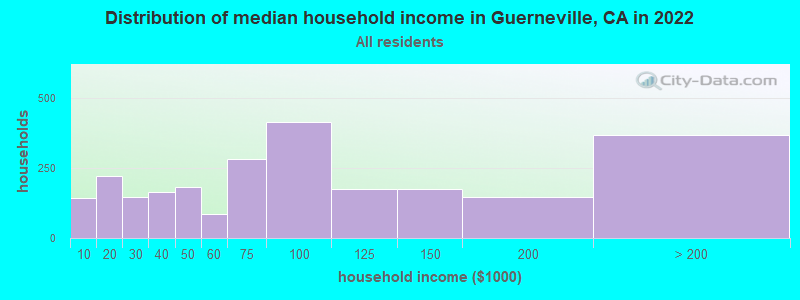
Guerneville, CA household income distribution

- 144Less than $10,000
- 220$10,000 to $19,999
- 145$20,000 to $29,999
- 162$30,000 to $39,999
- 181$40,000 to $49,999
- 85$50,000 to $59,999
- 280$60,000 to $74,999
- 413$75,000 to $99,999
- 173$100,000 to $124,999
- 176$125,000 to $149,999
- 145$150,000 to $199,999
- 368$200,000 or more
Home value of owner - occupied houses in 2022 in Guerneville, CA
-
- 76Less than $10,000
- 7$20,000 to $24,999
- 10$35,000 to $39,999
- 10$50,000 to $59,999
- 28$100,000 to $124,999
- 23$200,000 to $249,999
- 14$250,000 to $299,999
- 161$300,000 to $399,999
- 237$400,000 to $499,999
- 578$500,000 to $749,999
- 285$750,000 to $999,999
- 188$1,000,000 to $1,499,999
- 15$1,500,000 to $1,999,999
- 11$2,000,000 or more
Rent paid by renters in 2022 in Guerneville, CA
-
- 11$150 to $199
- 24$550 to $599
- 13$700 to $749
- 17$750 to $799
- 67$800 to $899
- 40$900 to $999
- 220$1,000 to $1,249
- 125$1,250 to $1,499
- 122$1,500 to $1,999
- 71$2,000 to $2,499
- 41$2,500 to $2,999
- 2$3,000 to $3,499
- 74No cash rent


Percentage of workers working in this county: 95.8%
Number of people working at home: 478 (22.3% of all workers)
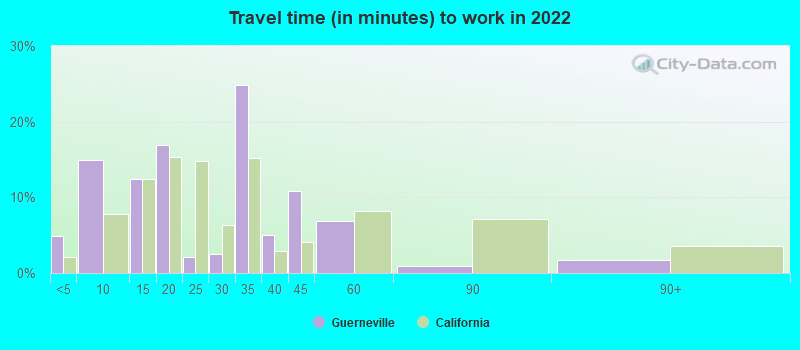
Travel time to work (commute)
- Less than 5 minutes: 71
- 5 to 9 minutes: 195
- 10 to 14 minutes: 63
- 15 to 19 minutes: 71
- 20 to 24 minutes: 92
- 25 to 29 minutes: 29
- 30 to 34 minutes: 557
- 35 to 39 minutes: 80
- 40 to 44 minutes: 207
- 45 to 59 minutes: 237
- 60 to 89 minutes: 20
- 90 or more minutes: 75
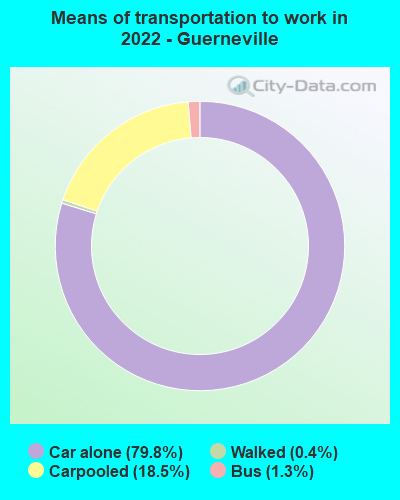
Means of transportation to work:
- Drove a car alone: 1,077 (60.4%)
- Carpooled: 207 (11.6%)
- Bus: 12 (0.7%)
- Walked: 6 (0.3%)
- Worked at home: 478 (26.8%)

- Unemployment by race in 2022
- Unemployment rate for White non-Hispanic residents
- 13.0%Males
- 3.7%Females
- Unemployment rate for two or more race residents
- 13.7%Females
- Unemployment rate for Hispanic or Latino residents
- 11.3%Females

- Year of entry for the foreign-born population in Guerneville, California
- 132010 or later
- 332000 to 2009
- 531990 to 1999
- 571980 to 1989
- 101970 to 1979
- 42Before 1970

First ancestries reported:
- European: 267 (12.4%)
- English: 191 (8.9%)
- German: 170 (7.9%)
- Irish: 155 (7.2%)
- Italian: 99 (4.6%)
- Scottish: 49 (2.3%)
- French: 46 (2.1%)
- Polish: 46 (2.1%)
- Eastern European: 43 (2.0%)
- American: 35 (1.6%)
- Swiss: 27 (1.3%)
- Northern European: 26 (1.2%)
- Norwegian: 26 (1.2%)
- Russian: 26 (1.2%)
- Pennsylvania German: 22 (1.0%)
- Austrian: 19 (0.9%)
- West Indian: 19 (0.9%)
- Lithuanian: 18 (0.8%)
- Yugoslavian: 17 (0.8%)
- British: 16 (0.7%)
- Assyrian: 14 (0.7%)
- Finnish: 12 (0.6%)
- Ukrainian: 9 (0.4%)
- Scotch-Irish: 7 (0.3%)
- Slovak: 6 (0.3%)
Most common places of birth for foreign-born residents (%):
| Guerneville: | 38.6% (110) |
| California: | 37.2% (3,881,193) |
| Guerneville: | 9.5% (27) |
| California: | 6.6% (684,672) |
| Guerneville: | 5.6% (16) |
| California: | 2.0% (206,004) |
| Guerneville: | 5.6% (16) |
| California: | 0.5% (48,911) |
| Guerneville: | 4.9% (14) |
| California: | 0.1% (6,773) |
| Guerneville: | 3.9% (11) |
| California: | 0.6% (60,761) |
| Guerneville: | 3.9% (11) |
| California: | 0.6% (57,953) |
| Guerneville: | 3.5% (10) |
| California: | 0.3% (31,439) |
| Guerneville: | 3.5% (10) |
| California: | 0.2% (17,699) |
| Guerneville: | 2.8% (8) |
| California: | 0.4% (40,224) |
| Guerneville: | 2.8% (8) |
| California: | 1.2% (127,477) |
| Guerneville: | 2.5% (7) |
| California: | 0.1% (9,159) |
| Guerneville: | 2.5% (7) |
| California: | 0.7% (73,304) |
| Guerneville: | 2.1% (6) |
| California: | 0.6% (65,335) |
| Guerneville: | 2.1% (6) |
| California: | 4.2% (440,287) |
Place of birth for U.S.-born residents:
- This state: 2,769
- Other state: 1,642
- Northeast: 442
- Midwest: 461
- South: 409
- West: 329
88.1% of Guerneville residents lived in the same house 1 years ago.
Out of people who lived in different houses, 37.8% lived in this county.
Out of people who lived in different counties, 43.0% lived in California.
| Guerneville: | 88.1% |
| State average: | 88.9% |
Education attainment for males 25 years and older:
- No schooling: 14
- Nursery to 4th grade: 0
- 5th and 6th grade: 0
- 7th and 8th grade: 11
- 9th grade: 4
- 10th grade: 27
- 11th grade: 0
- 12th grade, no diploma: 90
- High school graduate (or equivalency): 483
- Less than 1 year of college: 261
- Some college more than 1 year, no degree: 389
- Associate degree: 176
- Bachelor's degree: 543
- Master's degree: 183
- Professional school degree: 58
- Doctorate degree: 24

Education attainment for females 25 years and older:
- No schooling: 0
- Nursery to 4th grade: 51
- 5th and 6th grade: 0
- 7th and 8th grade: 8
- 9th grade: 0
- 10th grade: 0
- 11th grade: 0
- 12th grade, no diploma: 46
- High school graduate (or equivalency): 210
- Less than 1 year of college: 180
- Some college more than 1 year, no degree: 227
- Associate degree: 298
- Bachelor's degree: 474
- Master's degree: 168
- Professional school degree: 30
- Doctorate degree: 53


Housing units in structures:
- One, detached: 2,706
- One, attached: 62
- Two: 254
- 3 or 4: 67
- 5 to 9: 23
- 10 to 19: 6
- Mobile homes: 89
- Boats, RVs, vans, etc.: 18
Housing units lacking complete kitchen facilities in 2022: 2.0%
House/condo owner moved in on average 12 years ago
Renter moved in on average 3 years ago

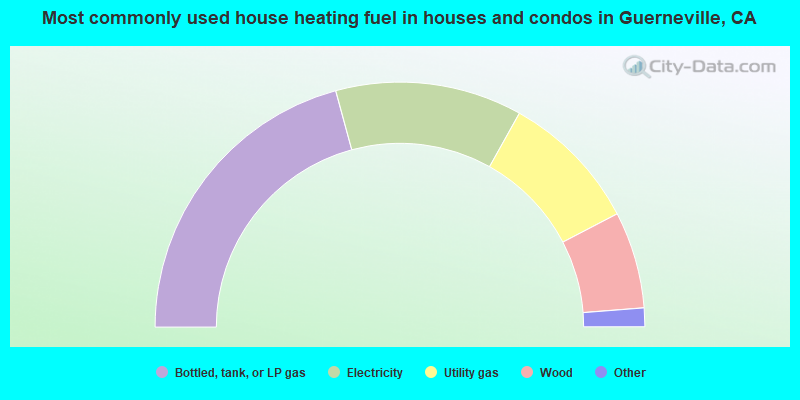
- 41.6%Bottled, tank, or LP gas
- 24.7%Electricity
- 18.5%Utility gas
- 12.8%Wood
- 0.8%Fuel oil, kerosene, etc.
- 0.8%Solar energy
- 0.7%No fuel used
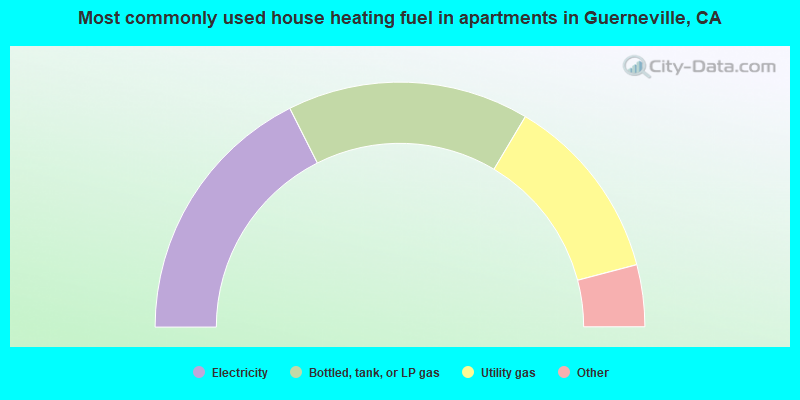
- 35.2%Electricity
- 32.0%Bottled, tank, or LP gas
- 24.7%Utility gas
- 3.8%Other fuel
- 3.6%Wood
- 0.7%No fuel used
Private vs. public school enrollment:
| Here: | 0.0% |
| California: | 10.5% |
| Here: | 3.5% |
| California: | 8.5% |
| Here: | 0.0% |
| California: | 15.9% |


