Gulfport, MS (Mississippi) Houses and Residents
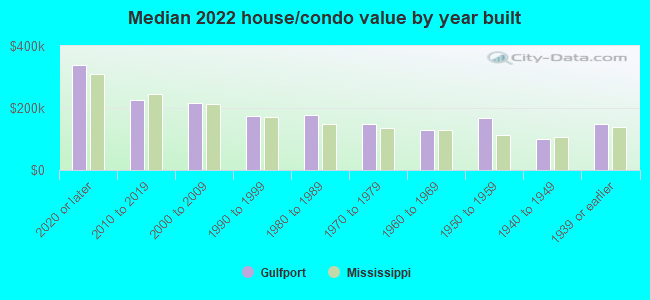
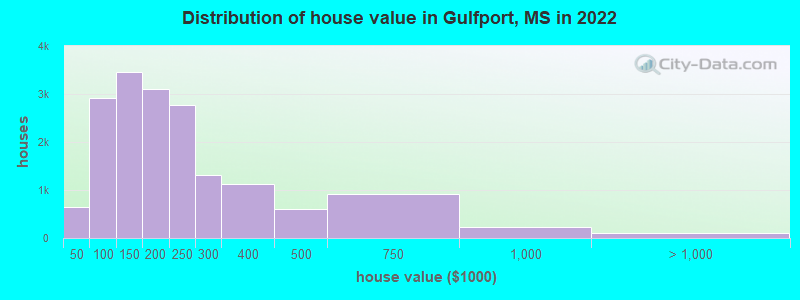
Estimated median house or condo value in 2022: $172,600 (it was $77,900 in 2000 )
Gulfport:
$172,600Mississippi:
$162,500
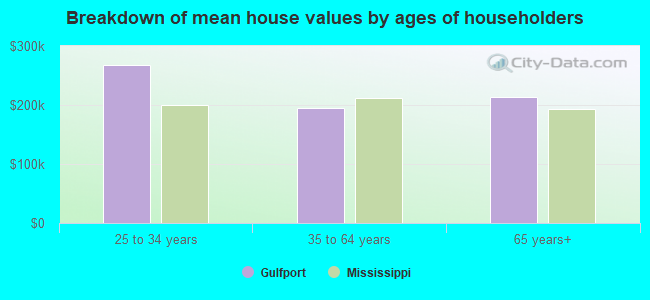
Lower value quartile - upper value quartile: $119,100 - $250,500Mean price in 2022: Detached houses: $199,766 Here:
$199,766State:
$226,494
Townhouses or other attached units: $431,019 Here:
$431,019State:
$254,198
In 2-unit structures: $127,212 Here:
$127,212State:
$195,375
In 3-to-4-unit structures: $216,923 Here:
$216,923State:
$185,930
In 5-or-more-unit structures: $347,428 Here:
$347,428State:
$359,860
Mobile homes: $72,281 Here:
$72,281State:
$73,695
Occupied boats, RVs, vans, etc.: $21,879 Here:
$21,879State:
$99,840
Total population: 71,750 (Urban population: 67,067, Rural population: 3,919 (all nonfarm) )
Houses: 32,769 (29,156 occupied: 17,053 owner occupied, 12,103 renter occupied )
% of renters here:
42%State:
30%
Housing density: 576 houses/condos per square mile
Median price asked for vacant for-sale houses and condos in 2022: $278,146.
Median contract rent in 2022: $792 (lower quartile is $562, upper quartile is $976)
Median rent asked for vacant for-rent units in 2022: $404
Median gross rent in Gulfport, MS in 2022: $1,000
Housing units in Gulfport with a mortgage: 10,236 (1,157 second mortgage, 25 home equity loan, 350 both second mortgage and home equity loan )Houses without a mortgage: 281
Median household income for houses/condos with a mortgage: $75,425
Median household income for apartments without a mortgage: $40,611
Median monthly housing costs: $965
Data:
Median house or condo value ($)
Median house or condo value ($ change since 2000)
Median house or condo value ($) - White
Median house or condo value ($) - Black or African American
Median house or condo value ($) - Asian
Median house or condo value ($) - Hispanic or Latino
Median house or condo value ($) - American Indian and Alaska Native
Median house or condo value ($) - Multirace
Median house or condo value ($) - Other Race
Median price asked for mobile homes ($)
Household density (households per square mile)
Mean house or condo value by units in structure - 1, detached ($)
Mean house or condo value by units in structure - 1, attached ($)
Mean house or condo value by units in structure - 2 ($)
Mean house or condo value by units in structure by units in structure - 3 or 4 ($)
Mean house or condo value by units in structure - 5 or more ($)
Mean house or condo value by units in structure - Boat, RV, van, etc. ($)
Mean house or condo value by units in structure - Mobile home ($)
Median contract rent ($)
Median contract rent - Lower quartile ($)
Median contract rent - Upper quartile ($)
Median gross rent ($)
Urban houses (%)
Rural houses (%)
Houses occupied (%)
Houses occupied (% change since 2000)
Houses owner occupied (%)
Houses owner occupied (% change since 2000)
Houses renter occupied (%)
Houses renter occupied (% change since 2000)
Vacant housing units - For rent (%)
Vacant housing units - For rent (% change since 2000)
Vacant housing units - For sale only (%)
Vacant housing units - For sale only (% change since 2000)
Vacant housing units - Rented or sold, not occupied (%)
Vacant housing units - Rented or sold, not occupied (% change since 2000)
Vacant housing units - For seasonal, recreational, or occasional use (%)
Vacant housing units - For seasonal, recreational, or occasional use (% change since 2000)
Vacant housing units - For migrant workers (%)
Vacant housing units - For migrant workers (% change since 2000)
Vacant housing units - Other vacant (%)
Vacant housing units - Other vacant (% change since 2000)
Median monthly housing costs ($)
Median household income for houses/condos with a mortgage ($)
Median household income for houses/condos without a mortgage ($)
Median household income ($)
Median household income ($) - White
Median household income ($) - Black or African American
Median household income ($) - Asian
Median household income ($) - Hispanic or Latino
Median household income ($) - American Indian and Alaska Native
Median household income ($) - Multirace
Median household income ($) - Other Race
Mortgage status - with mortgage (%)
Mortgage status - with second mortgage (%)
Mortgage status - with home equity loan (%)
Mortgage status - with both second mortgage and home equity loan (%)
Mortgage status - without a mortgage (%)
Median year house/condo built
Median year apartment built
Household type by relationship - Male householder living alone (%)
Household type by relationship - Male householder not living alone (%)
Household type by relationship - Female householder living alone (%)
Household type by relationship - Female householder not living alone (%)
Household type by relationship - Opposite-Sex spouse (%)
Household type by relationship - Same-Sex spouse (%)
Household type by relationship - Opposite-Sex unmarried partner (%)
Household type by relationship - Same-Sex unmarried partner (%)
Household type by relationship - In group quarters (%)
Size of family households - 2-person household (%)
Size of family households - 3-person household (%)
Size of family households - 4-person household (%)
Size of family households - 5-person household (%)
Size of family households - 6-person household (%)
Size of family households - 7-or-more-person household (%)
Size of nonfamily households - 1-person household (%)
Size of nonfamily households - 2-person household (%)
Size of nonfamily households - 3-person household (%)
Size of nonfamily households - 4-person household (%)
Size of nonfamily households - 5-person household (%)
Size of nonfamily households - 6-person household (%)
Size of nonfamily households - 7-or-moreperson household (%)
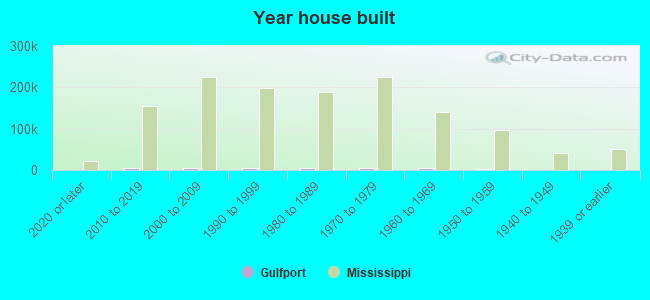
Year house built - Built 2010 or later (%)
Year house built - Built 2000 to 2009 (%)
Year house built - Built 1990 to 1999 (%)
Year house built - Built 1980 to 1989 (%)
Year house built - Built 1970 to 1979 (%)
Year house built - Built 1960 to 1969 (%)
Year house built - Built 1950 to 1959 (%)
Year house built - Built 1940 to 1949 (%)
Year house built - Built 1939 or earlier (%)
Median number of rooms in houses and condos
Median number of rooms in apartments
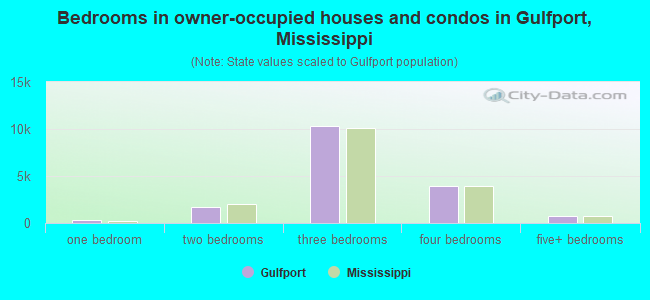
Median number of bedrooms in owner occupied houses
Mean number of bedrooms in owner occupied houses
Median number of bedrooms in renter occupied houses
Mean number of bedrooms in renter occupied houses
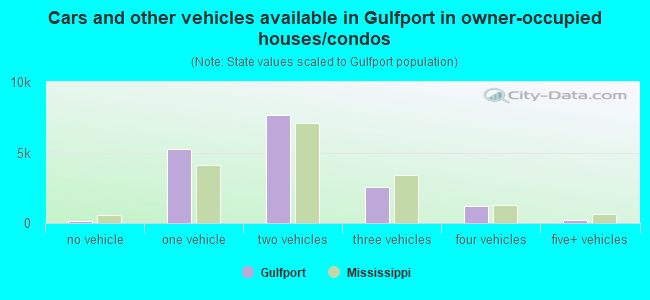
Median number of vehichles in owner occupied houses
Mean number of vehichles in owner occupied houses
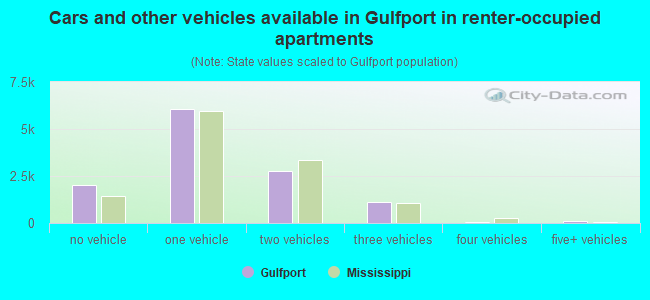
Median number of vehichles in renter occupied houses
Mean number of vehichles in renter occupied houses
Rooms in owner-occupied houses - 1 room (%)
Rooms in owner-occupied houses - 2 rooms (%)
Rooms in owner-occupied houses - 3 rooms (%)
Rooms in owner-occupied houses - 4 rooms (%)
Rooms in owner-occupied houses - 5 rooms (%)
Rooms in owner-occupied houses - 6 rooms (%)
Rooms in owner-occupied houses - 7 rooms (%)
Rooms in owner-occupied houses - 8 rooms (%)
Rooms in owner-occupied houses - 9+ rooms (%)
Rooms in renter-occupied houses - 1 room (%)
Rooms in renter-occupied houses - 2 rooms (%)
Rooms in renter-occupied houses - 3 rooms (%)
Rooms in renter-occupied houses - 4 rooms (%)
Rooms in renter-occupied houses - 5 rooms (%)
Rooms in renter-occupied houses - 6 rooms (%)
Rooms in renter-occupied houses - 7 rooms (%)
Rooms in renter-occupied houses - 8 rooms (%)
Rooms in renter-occupied houses - 9+ rooms (%)
Bedrooms in owner-occupied houses - no bedrooms (%)
Bedrooms in owner-occupied houses - 1 bedroom (%)
Bedrooms in owner-occupied houses - 2 bedrooms (%)
Bedrooms in owner-occupied houses - 3 bedrooms (%)
Bedrooms in owner-occupied houses - 4 bedrooms (%)
Bedrooms in owner-occupied houses - 5+ bedrooms (%)
Bedrooms in renter-occupied houses - no bedrooms (%)
Bedrooms in renter-occupied houses - 1 bedroom (%)
Bedrooms in renter-occupied houses - 2 bedrooms (%)
Bedrooms in renter-occupied houses - 3 bedrooms (%)
Bedrooms in renter-occupied houses - 4 bedrooms (%)
Bedrooms in renter-occupied houses - 5+ bedrooms (%)
Vehicles available in owner-occupied houses - no vehicle available (%)
Vehicles available in owner-occupied houses - 1 vehicle available(%)
Vehicles available in owner-occupied houses - 2 Vehicles available (%)
Vehicles available in owner-occupied houses - 3 Vehicles available (%)
Vehicles available in owner-occupied houses - 4 Vehicles available (%)
Vehicles available in owner-occupied houses - 5+ Vehicles available (%)
Vehicles available in renter-occupied houses - no vehicle available (%)
Vehicles available in renter-occupied houses - 1 vehicle available (%)
Vehicles available in renter-occupied houses - 2 Vehicles available (%)
Vehicles available in renter-occupied houses - 3 Vehicles available (%)
Vehicles available in renter-occupied houses - 4 Vehicles available (%)
Vehicles available in renter-occupied houses - 5+ Vehicles available (%)
Housing units in structures - 1, detached (%)
Housing units in structures - 1, attached (%)
Housing units in structures - 2 (%)
Housing units in structures - 3 or 4 (%)
Housing units in structures - 5 to 9 (%)
Housing units in structures - 10 to 19 (%)
Housing units in structures - 20 to 49 (%)
Housing units in structures - 50 or more (%)
Housing units in structures - Mobile home (%)
Housing units in structures - Boat, RV, van, etc. (%)
Housing units in structures - Owners - 1, detached (%)
Housing units in structures - Owners - 1, attached (%)
Housing units in structures - Owners - 2 (%)
Housing units in structures - Owners - 3 or 4 (%)
Housing units in structures - Owners - 5 to 9 (%)
Housing units in structures - Owners - 10 to 19 (%)
Housing units in structures - Owners - 20 to 49 (%)
Housing units in structures - Owners - 50 or more (%)
Housing units in structures - Owners - Mobile home (%)
Housing units in structures - Owners - Boat, RV, van, etc. (%)
Housing units in structures - Renters - 1, detached (%)
Housing units in structures - Renters - 1, attached (%)
Housing units in structures - Renters - 2 (%)
Housing units in structures - Renters - 3 or 4 (%)
Housing units in structures - Renters - 5 to 9 (%)
Housing units in structures - Renters - 10 to 19 (%)
Housing units in structures - Renters - 20 to 49 (%)
Housing units in structures - Renters - 50 or more (%)
Housing units in structures - Renters - Mobile home (%)
Housing units in structures - Renters - Boat, RV, van, etc. (%)
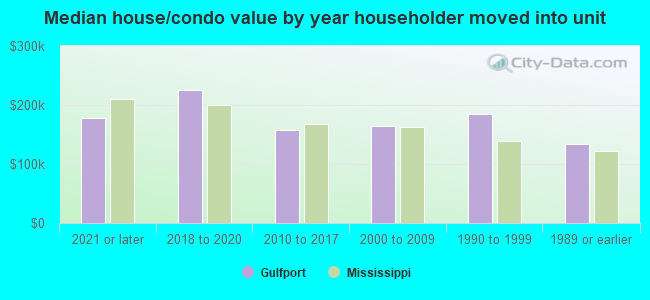
House/condo owner moved in on average (years ago)
Renter moved in on average (years ago)
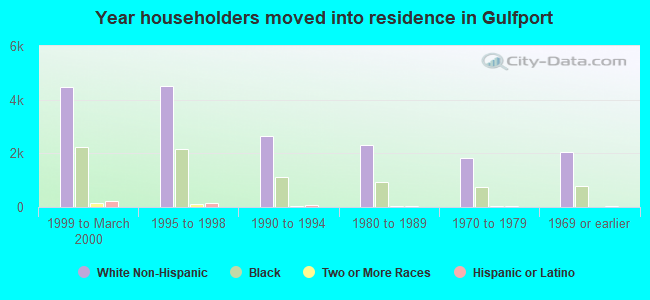
Year householder moved into unit - Moved in 1999 to March 2000 (%)
Year householder moved into unit - Moved in 1999 to March 2000 (%) - White
Year householder moved into unit - Moved in 1999 to March 2000 (%) - Black or African American
Year householder moved into unit - Moved in 1999 to March 2000 (%) - Asian
Year householder moved into unit - Moved in 1999 to March 2000 (%) - Hispanic or Latino
Year householder moved into unit - Moved in 1999 to March 2000 (%) - American Indian and Alaska Native
Year householder moved into unit - Moved in 1999 to March 2000 (%) - Multirace
Year householder moved into unit - Moved in 1999 to March 2000 (%) - Other Race
Year householder moved into unit - Moved in 1995 to 1998 (%)
Year householder moved into unit - Moved in 1995 to 1998 (%) - White
Year householder moved into unit - Moved in 1995 to 1998 (%) - Black or African American
Year householder moved into unit - Moved in 1995 to 1998 (%) - Asian
Year householder moved into unit - Moved in 1995 to 1998 (%) - Hispanic or Latino
Year householder moved into unit - Moved in 1995 to 1998 (%) - American Indian and Alaska Native
Year householder moved into unit - Moved in 1995 to 1998 (%) - Multirace
Year householder moved into unit - Moved in 1995 to 1998 (%) - Other Race
Year householder moved into unit - Moved in 1990 to 1994 (%)
Year householder moved into unit - Moved in 1990 to 1994 (%) - White
Year householder moved into unit - Moved in 1990 to 1994 (%) - Black or African American
Year householder moved into unit - Moved in 1990 to 1994 (%) - Asian
Year householder moved into unit - Moved in 1990 to 1994 (%) - Hispanic or Latino
Year householder moved into unit - Moved in 1990 to 1994 (%) - American Indian and Alaska Native
Year householder moved into unit - Moved in 1990 to 1994 (%) - Multirace
Year householder moved into unit - Moved in 1990 to 1994 (%) - Other Race
Year householder moved into unit - Moved in 1980 to 1989 (%)
Year householder moved into unit - Moved in 1980 to 1989 (%) - White
Year householder moved into unit - Moved in 1980 to 1989 (%) - Black or African American
Year householder moved into unit - Moved in 1980 to 1989 (%) - Asian
Year householder moved into unit - Moved in 1980 to 1989 (%) - Hispanic or Latino
Year householder moved into unit - Moved in 1980 to 1989 (%) - American Indian and Alaska Native
Year householder moved into unit - Moved in 1980 to 1989 (%) - Multirace
Year householder moved into unit - Moved in 1980 to 1989 (%) - Other Race
Year householder moved into unit - Moved in 1970 to 1979 (%)
Year householder moved into unit - Moved in 1970 to 1979 (%) - White
Year householder moved into unit - Moved in 1970 to 1979 (%) - Black or African American
Year householder moved into unit - Moved in 1970 to 1979 (%) - Asian
Year householder moved into unit - Moved in 1970 to 1979 (%) - Hispanic or Latino
Year householder moved into unit - Moved in 1970 to 1979 (%) - American Indian and Alaska Native
Year householder moved into unit - Moved in 1970 to 1979 (%) - Multirace
Year householder moved into unit - Moved in 1970 to 1979 (%) - Other Race
Year householder moved into unit - Moved in 1969 or earlier (%)
Year householder moved into unit - Moved in 1969 or earlier (%) - White
Year householder moved into unit - Moved in 1969 or earlier (%) - Black or African American
Year householder moved into unit - Moved in 1969 or earlier (%) - Asian
Year householder moved into unit - Moved in 1969 or earlier (%) - Hispanic or Latino
Year householder moved into unit - Moved in 1969 or earlier (%) - American Indian and Alaska Native
Year householder moved into unit - Moved in 1969 or earlier (%) - Multirace
Year householder moved into unit - Moved in 1969 or earlier (%) - Other Race
Housing units lacking complete plumbing facilities (%)
Housing units lacking complete kitchen facilities (%)
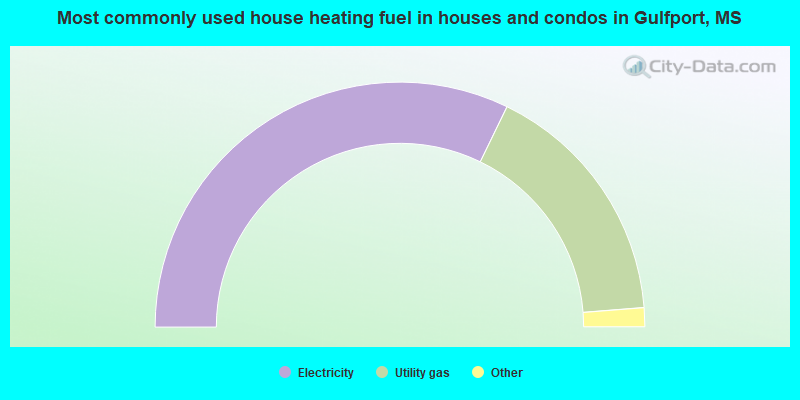
House heating fuel used in houses and condos - Utility gas (%)
House heating fuel used in houses and condos - Bottled, tank, or LP gas (%)
House heating fuel used in houses and condos - Electricity (%)
House heating fuel used in houses and condos - Fuel oil, kerosene, etc. (%)
House heating fuel used in houses and condos - Coal or coke (%)
House heating fuel used in houses and condos - Wood (%)
House heating fuel used in houses and condos - Solar energy (%)
House heating fuel used in houses and condos - Other fuel (%)
House heating fuel used in houses and condos - No fuel used (%)
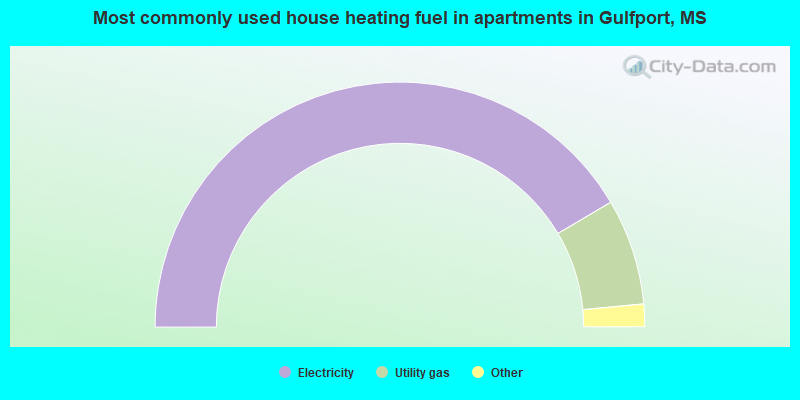
House heating fuel used in apartments - Utility gas (%)
House heating fuel used in apartments - Bottled, tank, or LP gas (%)
House heating fuel used in apartments - Electricity (%)
House heating fuel used in apartments - Fuel oil, kerosene, etc. (%)
House heating fuel used in apartments - Coal or coke (%)
House heating fuel used in apartments - Wood (%)
House heating fuel used in apartments - Solar energy (%)
House heating fuel used in apartments - Other fuel (%)
House heating fuel used in apartments - No fuel used (%)
Latest news about housing in Gulfport, MS collected exclusively by city-data.com from local newspapers, TV, and radio stations
Median year house/condo built: 1982Median year apartment built: 1991Household type by relationship:
Households: 72,228
Male householders: 12,844 (4,519 living alone ), Female householders: 16,312 (5,099 living alone )10,018 spouses (9,722 opposite-sex spouses ), 2,273 unmarried partners , (2,198 opposite-sex unmarried partners ), 20,023 children (17,760 natural , 615 adopted , 1,648 stepchildren ), 2,969 grandchildren , 913 brothers or sisters , 689 parents , 38 foster children , 903 other relatives , 3,450 non-relatives In group quarters: 1,796
Size of family households: 9,116 2-persons , 4,081 3-persons , 2,991 4-persons , 1,361 5-persons , 221 6-persons .
Size of nonfamily households: 9,618 1-person , 1,156 2-persons , 416 3-persons , 196 4-persons .
6,524 married couples with children. single-parent households (1,900 men , 4,958 women ).
93.6% of residents of Gulfport speak English at home. of residents speak Spanish at home (49% speak English very well , 21% speak English well , 13% speak English not well , 17% don't speak English at all ).of residents speak other Indo-European language at home (82% speak English very well , 15% speak English well , 2% speak English not well ).of residents speak Asian or Pacific Island language at home (56% speak English very well , 23% speak English well , 8% speak English not well , 13% don't speak English at all ).of residents speak other language at home (98% speak English very well , 2% speak English well ).
Foreign born population: 2,382 (3.3%)of them are naturalized citizens )
Median number of rooms in houses and condos:
Median number of rooms in apartments
Owner-occupied Renter-occupied
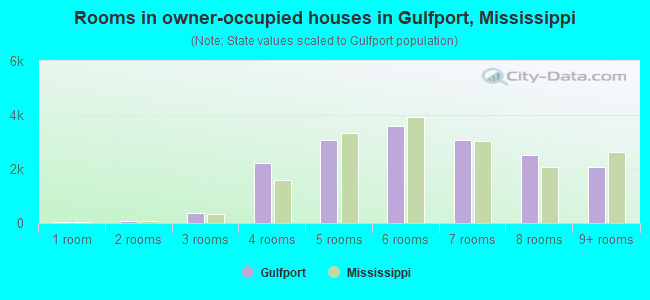
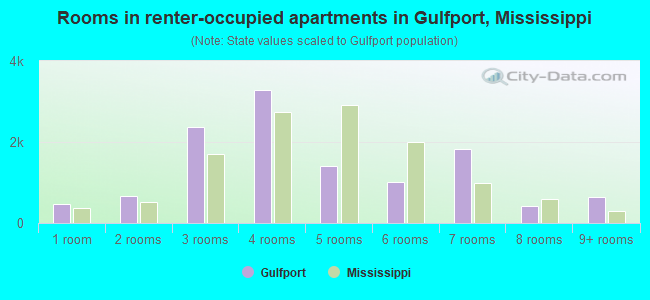
Rooms in owner-occupied houses in Gulfport, Mississippi
49 1 room 84 2 rooms 376 3 rooms 2,208 4 rooms 3,076 5 rooms 3,588 6 rooms 3,084 7 rooms 2,518 8 rooms 2,070 9+ rooms
Rooms in renter-occupied apartments in Gulfport, Mississippi
470 1 room 672 2 rooms 2,362 3 rooms 3,283 4 rooms 1,414 5 rooms 1,005 6 rooms 1,818 7 rooms 431 8 rooms 648 9+ rooms
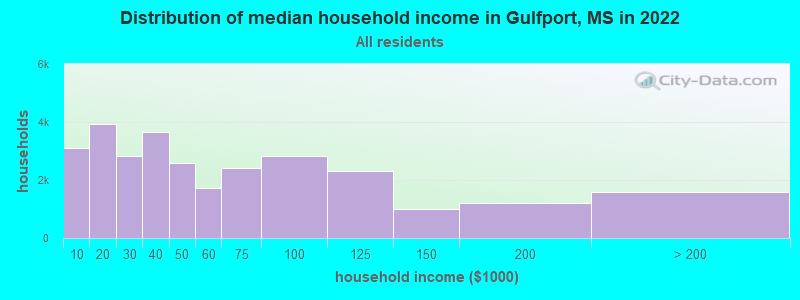
Gulfport, MS household income distribution 3,093 Less than $10,0003,934 $10,000 to $19,9992,812 $20,000 to $29,9993,650 $30,000 to $39,9992,590 $40,000 to $49,9991,725 $50,000 to $59,9992,407 $60,000 to $74,9992,833 $75,000 to $99,9992,306 $100,000 to $124,9991,008 $125,000 to $149,9991,211 $150,000 to $199,9991,587 $200,000 or more
Home value of owner - occupied houses in 2022 in Gulfport, MS 190 Less than $10,000199 $10,000 to $14,99940 $15,000 to $19,99944 $20,000 to $24,99940 $30,000 to $34,999133 $40,000 to $49,999158 $50,000 to $59,999591 $60,000 to $69,999392 $70,000 to $79,999601 $80,000 to $89,9991,035 $90,000 to $99,9991,097 $100,000 to $124,9992,369 $125,000 to $149,9991,812 $150,000 to $174,9991,298 $175,000 to $199,9992,777 $200,000 to $249,9991,305 $250,000 to $299,9991,126 $300,000 to $399,999596 $400,000 to $499,999923 $500,000 to $749,999231 $750,000 to $999,99966 $1,000,000 to $1,499,99930 $1,500,000 to $1,999,999Rent paid by renters in 2022 in Gulfport, MS 237 Less than $100315 $100 to $149374 $150 to $199112 $200 to $249227 $250 to $299270 $300 to $349310 $400 to $44958 $450 to $499829 $500 to $549641 $550 to $599720 $600 to $649501 $650 to $699463 $700 to $749847 $750 to $7991,656 $800 to $8991,442 $900 to $9991,486 $1,000 to $1,249765 $1,250 to $1,499289 $1,500 to $1,999561 No cash rent
Percentage of workers working in this county: 88.4%Number of people working at home: 1,656 (5.6% of all workers )
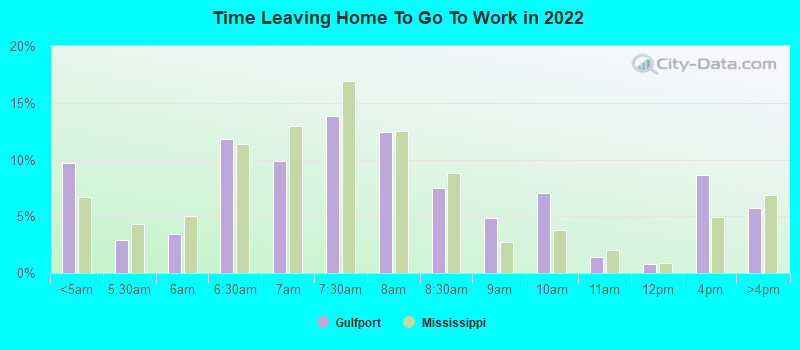
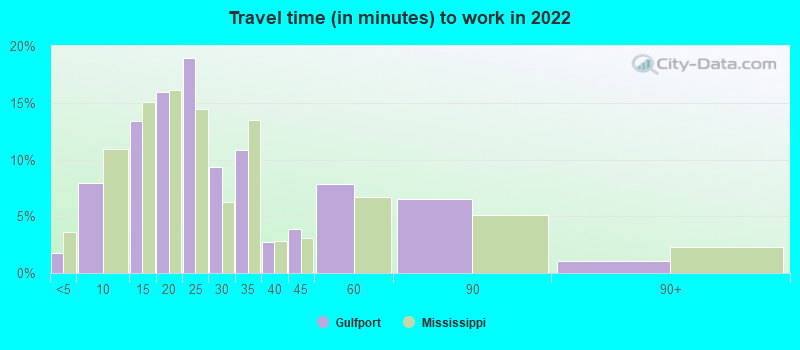
Travel time to work (commute)
Less than 5 minutes: 4685 to 9 minutes: 3,28410 to 14 minutes: 4,49315 to 19 minutes: 4,86220 to 24 minutes: 4,14125 to 29 minutes: 1,34230 to 34 minutes: 3,29335 to 39 minutes: 82840 to 44 minutes: 1,40045 to 59 minutes: 1,17560 to 89 minutes: 1,34790 or more minutes: 484
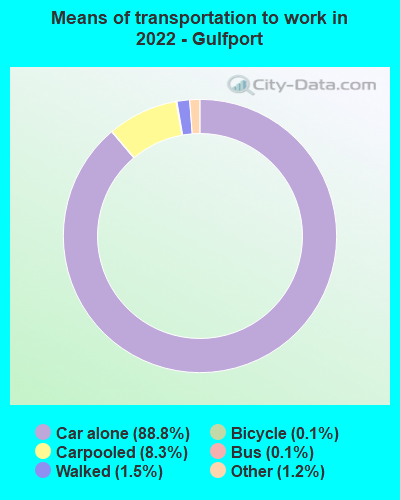
Means of transportation to work:
Drove a car alone: 40,382 (85.2%)Carpooled: 3,943 (8.3%)Bus : 115 (0.2%)Subway or elevated rail : 14 (0.0%)Taxi: 286 (0.6%)Bicycle: 46 (0.1%)Walked: 753 (1.6%)Worked at home: 1,656 (3.5%)
Unemployment by race in 2022
Unemployment rate for White non-Hispanic residents 3.3% Males6.1% FemalesUnemployment rate for Black residents 22.7% Males21.2% FemalesUnemployment rate for American Indian and Alaska Native residents 50.0% FemalesUnemployment rate for Asian residents 4.6% Males26.4% FemalesUnemployment rate for other race residents 11.1% FemalesUnemployment rate for two or more race residents 16.8% Males3.9% FemalesUnemployment rate for Hispanic or Latino residents 1.3% Males4.2% Females
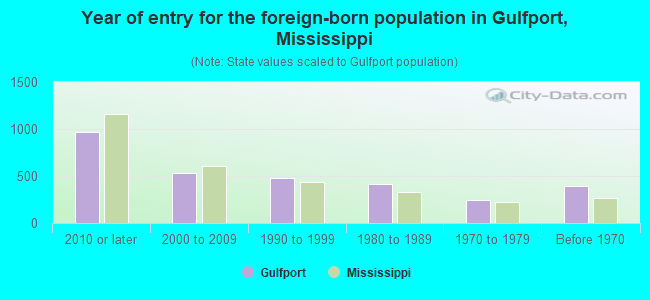
Year of entry for the foreign-born population in Gulfport, Mississippi
963 2010 or later 537 2000 to 2009 478 1990 to 1999 415 1980 to 1989 240 1970 to 1979 393 Before 1970
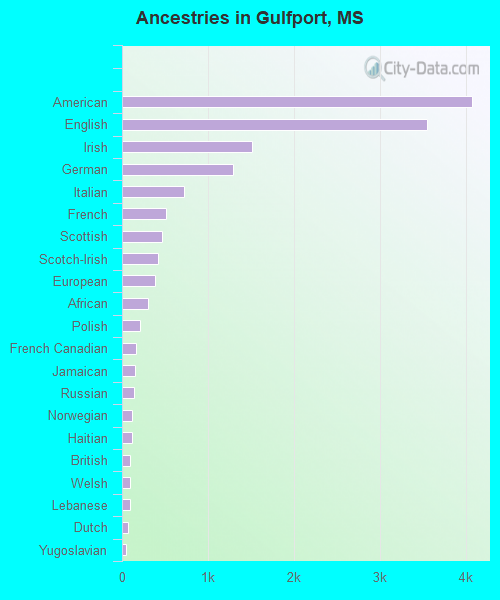
First ancestries reported:
American: 4,069 (10.2%)
English: 3,553 (8.9%)
Irish: 1,509 (3.8%)
German: 1,298 (3.3%)
Italian: 722 (1.8%)
French: 507 (1.3%)
Scottish: 460 (1.2%)
Scotch-Irish: 415 (1.0%)
European: 382 (1.0%)
African: 299 (0.7%)
Polish: 212 (0.5%)
French Canadian: 166 (0.4%)
Jamaican: 155 (0.4%)
Russian: 141 (0.4%)
Norwegian: 118 (0.3%)
Haitian: 111 (0.3%)
British: 94 (0.2%)
Welsh: 93 (0.2%)
Lebanese: 90 (0.2%)
Dutch: 67 (0.2%)
Yugoslavian: 46 (0.1%)
Cape Verdean: 36 (0.09%)
Czech: 26 (0.07%)
Iranian: 21 (0.05%)
Cajun: 20 (0.05%)
Barbadian: 18 (0.05%)
Greek: 17 (0.04%)
Croatian: 17 (0.04%)
South African: 17 (0.04%)
Bulgarian: 13 (0.03%)
West Indian: 13 (0.03%)
Danish: 12 (0.03%)
Slavic: 12 (0.03%)
Palestinian: 10 (0.03%)
Belgian: 10 (0.03%)
Syrian: 9 (0.02%)
Nigerian: 9 (0.02%)
Austrian: 7 (0.02%)
Hungarian: 6 (0.02%)
Slovene: 6 (0.02%)
Turkish: 6 (0.02%)
Northern European: 3 (0.01%)
Swedish: 3 (0.01%) Most common places of birth for foreign-born residents (%): Mexico Gulfport:
20.7% (561)Mississippi:
25.4% (17,354)
Honduras Gulfport:
11.9% (324)Mississippi:
5.1% (3,475)
Philippines Gulfport:
7.9% (215)Mississippi:
4.7% (3,211)
Jamaica Gulfport:
6.6% (179)Mississippi:
1.3% (899)
Guatemala Gulfport:
6.0% (162)Mississippi:
5.5% (3,723)
South Africa Gulfport:
5.4% (147)Mississippi:
0.7% (496)
Haiti Gulfport:
4.0% (109)Mississippi:
0.6% (385)
Vietnam Gulfport:
3.3% (90)Mississippi:
5.8% (3,948)
Cameroon Gulfport:
2.9% (79)Mississippi:
0.8% (555)
El Salvador Gulfport:
2.8% (77)Mississippi:
0.9% (646)
Bolivia Gulfport:
2.7% (74)Mississippi:
0.2% (124)
China, excluding Hong Kong and Taiwan Gulfport:
2.0% (54)Mississippi:
4.3% (2,948)
Germany Gulfport:
1.8% (50)Mississippi:
3.1% (2,126)
Cuba Gulfport:
1.7% (46)Mississippi:
1.3% (879)
Colombia Gulfport:
1.6% (44)Mississippi:
1.4% (941)
India Gulfport:
1.5% (41)Mississippi:
6.3% (4,325)
Place of birth for U.S.-born residents:
This state: 40,726Other state: 28,164Northeast: 3,201Midwest: 4,910South: 16,015West: 4,038 81.9% of Gulfport residents lived in the same house 1 years ago.
Out of people who lived in different houses, 38.1% lived in this county.
Out of people who lived in different counties, 42.5% lived in Mississippi.
Gulfport:
81.9%State average:
88.9%
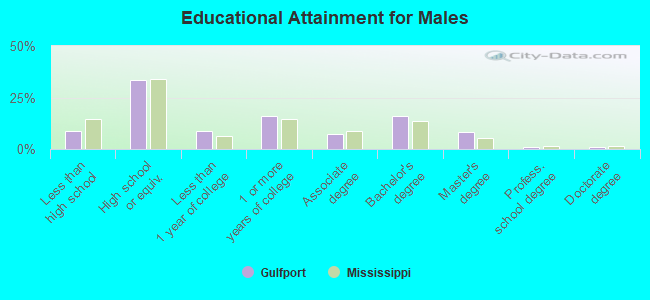
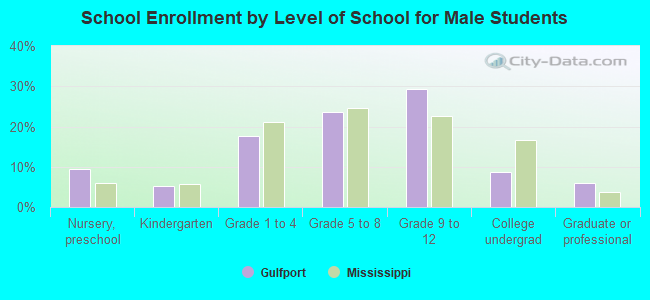
Education attainment for males 25 years and older:
No schooling: 348Nursery to 4th grade: 05th and 6th grade: 157th and 8th grade: 2779th grade: 39210th grade: 36411th grade: 30112th grade, no diploma: 244High school graduate (or equivalency): 7,637Less than 1 year of college: 2,006Some college more than 1 year, no degree: 3,595Associate degree: 1,640Bachelor's degree: 3,594Master's degree: 1,829Professional school degree: 191Doctorate degree: 246
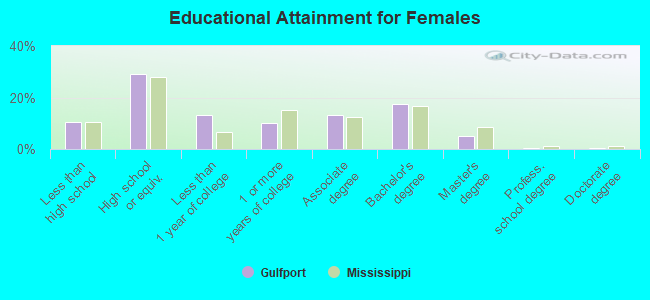
Education attainment for females 25 years and older:
No schooling: 357Nursery to 4th grade: 05th and 6th grade: 07th and 8th grade: 4569th grade: 44410th grade: 22711th grade: 72912th grade, no diploma: 535High school graduate (or equivalency): 7,739Less than 1 year of college: 3,545Some college more than 1 year, no degree: 2,694Associate degree: 3,533Bachelor's degree: 4,622Master's degree: 1,390Professional school degree: 143Doctorate degree: 142
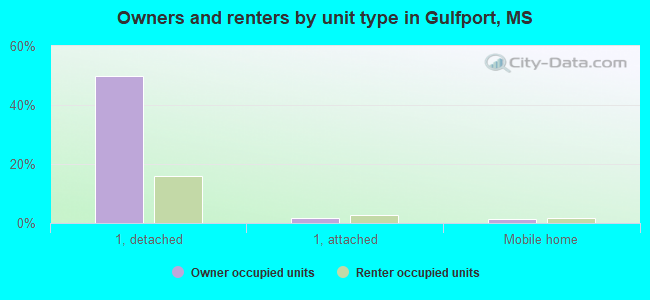
Housing units in structures:
One, detached: 22,394One, attached: 985Two: 9033 or 4: 2,4115 to 9: 1,24810 to 19: 1,61120 to 49: 91250 or more: 844Mobile homes: 1,358Boats, RVs, vans, etc.: 103Median worth of mobile homes: $74,991
Housing units lacking complete plumbing facilities in 2022: 1.6%Housing units lacking complete kitchen facilities in 2022: 1.9%House/condo owner moved in on average 11 years ago
Renter moved in on average 2 years ago
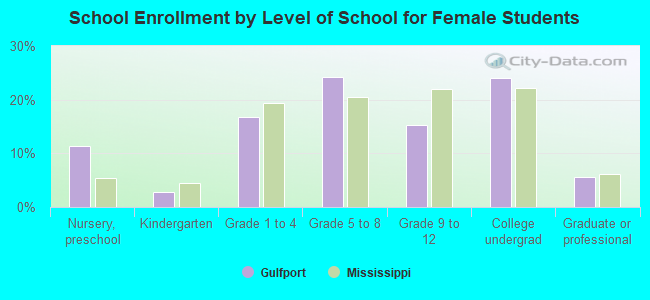
Private vs. public school enrollment:
Students in private schools in grades 1 to 8 (elementary and middle school): 1,494 Here:
22.9%Mississippi:
16.1%
Students in private schools in grades 9 to 12 (high school): 681 Here:
19.4%Mississippi:
14.6%
Students in private undergraduate colleges: 542 Here:
20.6%Mississippi:
12.8%