Hallsburg, TX (Texas) Houses and Residents
| Hallsburg: | $222,823 |
| Texas: | $275,400 |
Mean price in 2022:
Detached houses: $281,898
Here: $281,898 State: $369,058 Mobile homes: $70,383
Here: $70,383 State: $124,413
Total population: 518 (Urban population: 0, Rural population: 519 (11 farm, 508 nonfarm))
Houses: 233 (201 occupied: 157 owner occupied, 38 renter occupied)
| % of renters here: | 19% |
| State: | 38% |
Housing density: 28 houses/condos per square mile
Median price asked for vacant for-sale houses and condos in 2022 in this county: $214,746.
Median contract rent in 2022: $902 (lower quartile is $729, upper quartile is $1,060)
Median gross rent in Hallsburg, TX in 2022: $1,240
Housing units in Hallsburg with a mortgage: 96 (2 second mortgage, 0 home equity loan, 0 both second mortgage and home equity loan)
Houses without a mortgage: 2
Median household income for houses/condos with a mortgage: $97,900
Median household income for apartments without a mortgage: $51,053
Median monthly housing costs: $1,389
Compare current foreclosures near Hallsburg, TX:
| Photo | Address | Area | Beds / Baths | Price | Details |
|---|---|---|---|---|---|

|
#1
Lux Dr
Waco, TX 76706
|
1,745 sq. feet
|
2 baths 4 beds |
$182,000
|
show details |

|
#2
Cranbrook Dr
Wac-Woodway, TX 76712
|
1,888 sq. feet
|
2 baths 3 beds |
$319,900
|
show details |

|
#3
South Fork Ranch Road
Waco, TX 76705
|
1,626 sq. feet
|
2 baths 3 beds |
show details | |

|
#4
Woodland Dr
Lorena, TX 76655
|
- sq. feet
|
3 baths 4 beds |
show details | |

|
#5
Torrance St
Waco, TX 76705
|
1,380 sq. feet
|
2 baths 3 beds |
show details | |

|
#6
Highway 164 W
Mart, TX 76664
|
1,381 sq. feet
|
1 baths 3 beds |
show details | |

|
#7
Hawthorne Dr
Waco, TX 76710
|
- sq. feet
|
2 baths 3 beds |
show details | |

|
#8
Alexander Ave
Waco, TX 76708
|
1,428 sq. feet
|
2 baths 2 beds |
show details | |

|
#9
Mosley Dr
Waco, TX 76705
|
1,792 sq. feet
|
2 baths 3 beds |
show details | |

|
#10
N 40th St
Waco, TX 76707
|
- sq. feet
|
1 baths 2 beds |
show details |
| Photo | Address | Area | Beds / Baths | Price | Details |
|---|---|---|---|---|---|

|
#11
N 43rd St
Waco, TX 76710
|
1,958 sq. feet
|
2 baths 4 beds |
show details | |

|
#12
Neely Rd
Hewitt, TX 76643
|
1,627 sq. feet
|
2 baths 3 beds |
show details | |

|
#13
Lcr 318
Mart, TX 76664
|
- sq. feet
|
2 baths 3 beds |
show details | |

|
#14
Tejas Dr
Wac-Woodway, TX 76712
|
- sq. feet
|
2 baths 3 beds |
show details | |

|
#15
Serena Ln
Wac-Woodway, TX 76712
|
1,947 sq. feet
|
2 baths 4 beds |
show details | |

|
#16
N Barbara St
Waco, TX 76705
|
1,496 sq. feet
|
2 baths 3 beds |
show details | |

|
#17
N 22nd St
Waco, TX 76708
|
1,160 sq. feet
|
1 baths 3 beds |
show details | |

|
#18
Avenue G
Waco, TX 76705
|
1,461 sq. feet
|
2 baths 3 beds |
show details | |

|
#19
Brewster St
Waco, TX 76706
|
1,585 sq. feet
|
2 baths 3 beds |
show details | |

|
#20
Cleveland Ave
Waco, TX 76711
|
868 sq. feet
|
1 baths 2 beds |
show details |
| Photo | Address | Area | Beds / Baths | Price | Details |
|---|---|---|---|---|---|

|
#21
Glasgow Dr
Waco, TX 76710
|
2,271 sq. feet
|
2 baths 4 beds |
show details | |

|
#22
N 30th St
Waco, TX 76707
|
1,506 sq. feet
|
1 baths 3 beds |
show details | |

|
#23
Lake Haven Dr
Waco, TX 76710
|
1,836 sq. feet
|
2 baths 3 beds |
show details | |

|
#24
White Hall Rd
Wac-Woodway, TX 76712
|
2,120 sq. feet
|
2 baths 4 beds |
show details | |

|
#25
Eagles Nest Dr
Hewitt, TX 76643
|
1,593 sq. feet
|
2 baths 3 beds |
show details | |

|
#26
Durango Trl
Wac-Woodway, TX 76712
|
1,759 sq. feet
|
2 baths 3 beds |
show details | |

|
#27
County Road 185
Marlin, TX 76661
|
- sq. feet
|
3 baths 4 beds |
show details | |

|
#28
Cedarwood Ln
Hewitt, TX 76643
|
1,931 sq. feet
|
2 baths 3 beds |
show details | |

|
#29
Dossett St
Waco, TX 76705
|
1,668 sq. feet
|
1 baths 3 beds |
show details | |

|
#30
Haden Dr
Waco, TX 76710
|
1,642 sq. feet
|
1 baths 3 beds |
show details |
| Photo | Address | Area | Beds / Baths | Price | Details |
|---|---|---|---|---|---|

|
#31
Howe Hill Rd
Waco, TX 76706
|
1,522 sq. feet
|
2 baths - beds |
show details | |

|
#32
Ute Trl
Hewitt, TX 76643
|
2,103 sq. feet
|
- baths 4 beds |
show details | |

|
#33
Memorial Dr
Waco, TX 76711
|
922 sq. feet
|
1 baths - beds |
show details | |

|
#34
Sydney Dr
Waco, TX 76708
|
1,224 sq. feet
|
2 baths - beds |
show details | |

|
#35
Kirkland Hill Rd
Axtell, TX 76624
|
1,512 sq. feet
|
- baths - beds |
show details | |

|
#36
Cole Ave
Waco, TX 76707
|
1,074 sq. feet
|
1 baths - beds |
show details | |

|
#37
S Hedwig St
Riesel, TX 76682
|
1,612 sq. feet
|
2 baths - beds |
show details | |

|
#38
N Baese Rd
West, TX 76691
|
1,370 sq. feet
|
1 baths - beds |
show details | |

|
#39
Cumberland Ave
Waco, TX 76707
|
1,264 sq. feet
|
1 baths - beds |
show details | |

|
#40
Live Oak Ave
Waco, TX 76708
|
1,037 sq. feet
|
1 baths - beds |
show details |
| Photo | Address | Area | Beds / Baths | Price | Details |
|---|---|---|---|---|---|

|
#41
Windsor Ave
Waco, TX 76708
|
916 sq. feet
|
1 baths - beds |
show details | |

|
#42
W Jade Dr
Hewitt, TX 76643
|
1,544 sq. feet
|
- baths 3 beds |
show details | |

|
#43
Telluride Dr
Wac-Woodway, TX 76712
|
2,693 sq. feet
|
3 baths - beds |
show details | |

|
#44
Applewood Ln
Hewitt, TX 76643
|
1,517 sq. feet
|
2 baths - beds |
show details | |

|
#45
N 62nd St
Waco, TX 76710
|
1,754 sq. feet
|
2 baths - beds |
show details | |

|
#46
Macarthur Dr
Waco, TX 76708
|
3,964 sq. feet
|
2 baths - beds |
show details | |

|
#47
N 26th St
Waco, TX 76708
|
1,686 sq. feet
|
1 baths - beds |
show details | |

|
#48
Sleeper Ave
Waco, TX 76707
|
1,438 sq. feet
|
1 baths - beds |
show details | |

|
#49
N 26th St
Waco, TX 76708
|
1,864 sq. feet
|
1 baths - beds |
show details | |

|
Check over 1 million property listings on Foreclosure.com!
|
browse all offers | |||

Latest news about housing in Hallsburg, TX collected exclusively by city-data.com from local newspapers, TV, and radio stations


Median year apartment built: 1997
Household type by relationship:
Households: 540- Male householders: 81 (28 living alone), Female householders: 119 (21 living alone)
98 spouses (98 opposite-sex spouses), 29 unmarried partners, (29 opposite-sex unmarried partners), 165 children (138 natural, 8 adopted, 18 stepchildren), 14 grandchildren, 4 brothers or sisters, 7 parents, 2 foster children, 2 other relatives, 16 non-relatives
Size of family households: 68 2-persons, 24 3-persons, 17 4-persons, 12 5-persons, 22 6-persons.
Size of nonfamily households: 45 1-person, 10 2-persons.
67 married couples with children.
51 single-parent households (2 men, 49 women).
82.3% of residents of Hallsburg speak English at home.
16.4% of residents speak Spanish at home (85% speak English very well, 13% speak English well, 2% speak English not well).
0.8% of residents speak other Indo-European language at home (100% speak English very well).
Foreign born population: 31 (5.7%)
(83.9% of them are naturalized citizens)
| Here: | 6.0 |
| State: | 6.3 |
| Here: | 4.9 |
| State: | 4.0 |

- Bedrooms in owner-occupied houses and condos in Hallsburg, Texas
- 3no bedroom
- 11 bedroom
- 252 bedrooms
- 1003 bedrooms
- 264 bedrooms
- 35+ bedrooms

- Bedrooms in renter-occupied apartments in Hallsburg, Texas
- 0no bedroom
- 71 bedroom
- 22 bedrooms
- 303 bedrooms
- 04 bedrooms
- 05+ bedrooms

- Cars and other vehicles available in Hallsburg in owner-occupied houses/condos
- 0no vehicle
- 341 vehicle
- 832 vehicles
- 333 vehicles
- 44 vehicles
- 45+ vehicles

- Cars and other vehicles available in Hallsburg in renter-occupied apartments
- 0no vehicle
- 171 vehicle
- 222 vehicles
- 03 vehicles
- 04 vehicles
- 05+ vehicles

- Rooms in owner-occupied houses in Hallsburg, Texas
- 31 room
- 02 rooms
- 03 rooms
- 174 rooms
- 335 rooms
- 456 rooms
- 517 rooms
- 28 rooms
- 79+ rooms

- Rooms in renter-occupied apartments in Hallsburg, Texas
- 01 room
- 02 rooms
- 73 rooms
- 24 rooms
- 235 rooms
- 06 rooms
- 27 rooms
- 58 rooms
- 09+ rooms


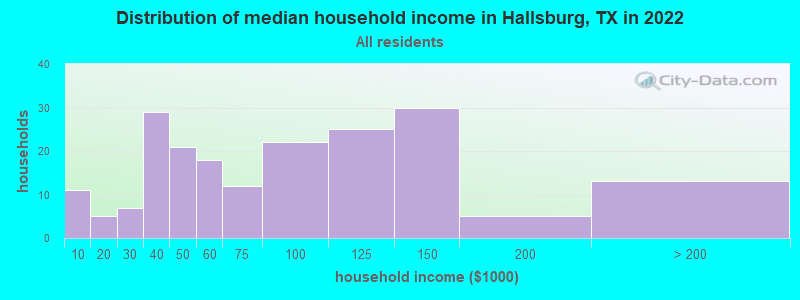
Hallsburg, TX household income distribution

- 11Less than $10,000
- 5$10,000 to $19,999
- 7$20,000 to $29,999
- 29$30,000 to $39,999
- 21$40,000 to $49,999
- 18$50,000 to $59,999
- 12$60,000 to $74,999
- 22$75,000 to $99,999
- 25$100,000 to $124,999
- 30$125,000 to $149,999
- 5$150,000 to $199,999
- 13$200,000 or more
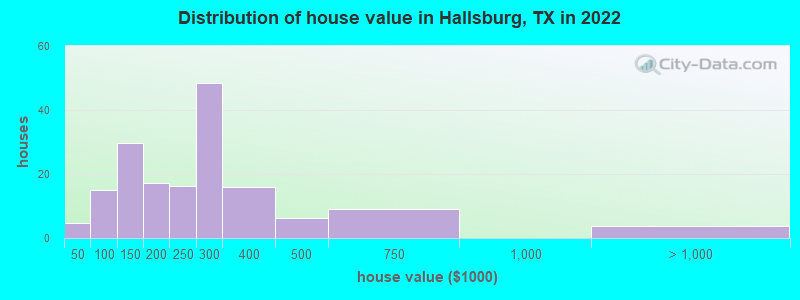
Home value of owner - occupied houses in 2022 in Hallsburg, TX
-
- 1Less than $10,000
- 0$10,000 to $14,999
- 1$20,000 to $24,999
- 1$25,000 to $29,999
- 0$40,000 to $49,999
- 1$60,000 to $69,999
- 8$70,000 to $79,999
- 2$80,000 to $89,999
- 1$90,000 to $99,999
- 28$100,000 to $124,999
- 0$125,000 to $149,999
- 15$150,000 to $174,999
- 2$175,000 to $199,999
- 16$200,000 to $249,999
- 48$250,000 to $299,999
- 16$300,000 to $399,999
- 6$400,000 to $499,999
- 9$500,000 to $749,999
- 3$1,000,000 to $1,499,999
Rent paid by renters in 2022 in Hallsburg, TX
-
- 1$150 to $199
- 5$300 to $349
- 4$650 to $699
- 1$700 to $749
- 1$750 to $799
- 6$800 to $899
- 8$900 to $999
- 2$1,000 to $1,249
- 1No cash rent


Percentage of workers working in this county: 89.5%
Number of people working at home: 20 (8.1% of all workers)
Travel time to work (commute)
- Less than 5 minutes: 0
- 5 to 9 minutes: 2
- 10 to 14 minutes: 11
- 15 to 19 minutes: 41
- 20 to 24 minutes: 55
- 25 to 29 minutes: 26
- 30 to 34 minutes: 45
- 35 to 39 minutes: 7
- 40 to 44 minutes: 0
- 45 to 59 minutes: 17
- 60 to 89 minutes: 0
- 90 or more minutes: 16
Means of transportation to work:
- Drove a car alone: 199 (74.8%)
- Carpooled: 58 (21.8%)
- Walked: 5 (1.9%)
- Other means: 2 (0.8%)
- Worked at home: 2 (0.8%)

- Unemployment by race in 2022
- Unemployment rate for White non-Hispanic residents
- 1.5%Males
- Unemployment rate for other race residents
- 76.3%Males
- Unemployment rate for Hispanic or Latino residents
- 21.3%Males

- Year of entry for the foreign-born population in Hallsburg, Texas
- 02010 or later
- 02000 to 2009
- 221990 to 1999
- 01980 to 1989
- 41970 to 1979
- 0Before 1970

First ancestries reported:
- German: 40 (18.7%)
- English: 21 (9.8%)
- Italian: 18 (8.4%)
- Irish: 17 (7.9%)
- American: 12 (5.6%)
- European: 5 (2.3%)
- Scottish: 3 (1.4%)
- Czech: 1 (0.5%)
- French: 1 (0.5%)
Most common places of birth for foreign-born residents (%):
| Hallsburg: | 90.9% (30) |
| Texas: | 48.4% (2,411,723) |
Place of birth for U.S.-born residents:
- This state: 376
- Other state: 133
- Northeast: 8
- Midwest: 14
- South: 69
- West: 44
93.3% of Hallsburg residents lived in the same house 1 years ago.
Out of people who lived in different houses, 42.4% lived in this county.
Out of people who lived in different counties, 42.9% lived in Texas.
| Hallsburg: | 93.3% |
| State average: | 85.7% |
Education attainment for males 25 years and older:
- No schooling: 9
- Nursery to 4th grade: 0
- 5th and 6th grade: 0
- 7th and 8th grade: 0
- 9th grade: 11
- 10th grade: 2
- 11th grade: 1
- 12th grade, no diploma: 2
- High school graduate (or equivalency): 46
- Less than 1 year of college: 15
- Some college more than 1 year, no degree: 36
- Associate degree: 35
- Bachelor's degree: 13
- Master's degree: 2
- Professional school degree: 0
- Doctorate degree: 0

Education attainment for females 25 years and older:
- No schooling: 0
- Nursery to 4th grade: 0
- 5th and 6th grade: 1
- 7th and 8th grade: 1
- 9th grade: 0
- 10th grade: 0
- 11th grade: 0
- 12th grade, no diploma: 6
- High school graduate (or equivalency): 51
- Less than 1 year of college: 8
- Some college more than 1 year, no degree: 43
- Associate degree: 31
- Bachelor's degree: 30
- Master's degree: 7
- Professional school degree: 0
- Doctorate degree: 1


Housing units in structures:
- One, detached: 179
- 5 to 9: 3
- Mobile homes: 51
Housing units lacking complete kitchen facilities in 2022: 0.4%
House/condo owner moved in on average 17 years ago
Renter moved in on average 5 years ago

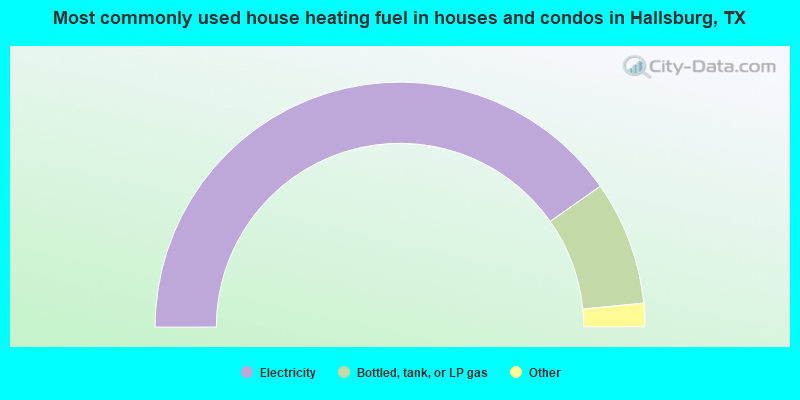
- 81.0%Electricity
- 16.5%Bottled, tank, or LP gas
- 1.9%Utility gas
- 0.6%Other fuel
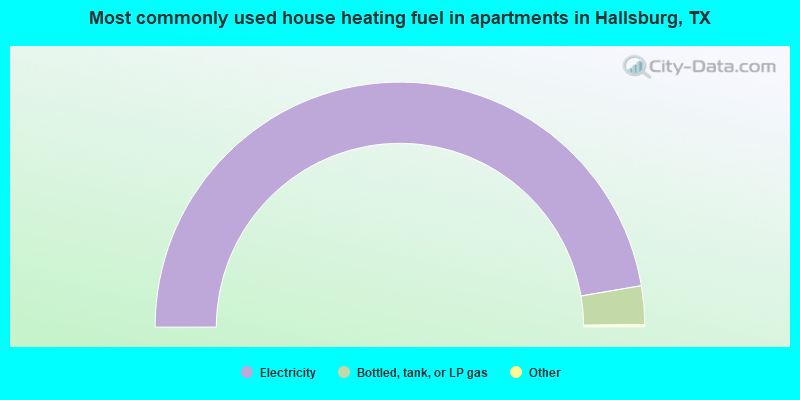
- 94.9%Electricity
- 5.1%Bottled, tank, or LP gas
Private vs. public school enrollment:
| Here: | 0.0% |
| Texas: | 8.8% |
| Here: | 0.0% |
| Texas: | 8.0% |
| Here: | 33.3% |
| Texas: | 16.2% |


