Hallsville, TX (Texas) Houses and Residents
| Hallsville: | $170,100 |
| Texas: | $275,400 |
Mean price in 2022:
Detached houses: $321,681
Here: $321,681 State: $369,058 Mobile homes: $110,539
Here: $110,539 State: $124,413
Total population: 3,905 (Urban population: 2,555 (all inside urban clusters), Rural population: 107 (2 farm, 105 nonfarm))
Houses: 1,933 (1,650 occupied: 977 owner occupied, 767 renter occupied)
| % of renters here: | 44% |
| State: | 38% |
Housing density: 849 houses/condos per square mile
Median price asked for vacant for-sale houses and condos in 2022 in this county: $663,369.
Median contract rent in 2022: $999 (lower quartile is $919, upper quartile is $1,215)
Median rent asked for vacant for-rent units in 2022: $1,236
Median gross rent in Hallsville, TX in 2022: $1,117
Housing units in Hallsville with a mortgage: 699 (15 second mortgage, 0 home equity loan, 16 both second mortgage and home equity loan)
Houses without a mortgage: 0
Median household income for houses/condos with a mortgage: $129,250
Median household income for apartments without a mortgage: $63,781
Median monthly housing costs: $1,103
Compare current foreclosures near Hallsville, TX:
| Photo | Address | Area | Beds / Baths | Price | Details |
|---|---|---|---|---|---|

|
#1
Firetower Rd
Hallsville, TX 75650
|
- sq. feet
|
- baths - beds |
show details | |

|
#2
Old Highway 80
Hallsville, TX 75650
|
- sq. feet
|
- baths - beds |
show details | |

|
#3
Noonday Rd
Hallsville, TX 75650
|
- sq. feet
|
- baths - beds |
show details | |

|
#4
S Green St
Hallsville, TX 75650
|
- sq. feet
|
- baths - beds |
show details | |

|
#5
Galilee Rd
Hallsville, TX 75650
|
- sq. feet
|
- baths - beds |
show details | |

|
#6
E Pine St # D25
Hallsville, TX 75650
|
- sq. feet
|
- baths - beds |
show details | |

|
#7
Norris Dr
Hallsville, TX 75650
|
- sq. feet
|
- baths - beds |
show details | |

|
#8
Winifreds Way
Hallsville, TX 75650
|
- sq. feet
|
- baths - beds |
show details | |

|
#9
Fm 450 N
Hallsville, TX 75650
|
- sq. feet
|
- baths - beds |
show details | |

|
#10
Norris Dr
Hallsville, TX 75650
|
- sq. feet
|
- baths - beds |
show details |
| Photo | Address | Area | Beds / Baths | Price | Details |
|---|---|---|---|---|---|

|
#11
H G Moseley Pkwy
Longview, TX 75604
|
- sq. feet
|
3 baths 4 beds |
$309,900
|
show details |

|
#12
Tom Smith Rd
Harleton, TX 75651
|
- sq. feet
|
1 baths 2 beds |
$69,900
|
show details |

|
#13
Inwood Rd
Longview, TX 75601
|
3,332 sq. feet
|
4 baths 5 beds |
show details | |

|
#14
Tx-31
Longview, TX 75604
|
1,786 sq. feet
|
2 baths 3 beds |
show details | |

|
#15
State Highway 154
Marshall, TX 75670
|
- sq. feet
|
3 baths 5 beds |
show details | |

|
#16
Matt Dr
Longview, TX 75605
|
1,316 sq. feet
|
2 baths 3 beds |
show details | |

|
#17
W Garfield Dr
Longview, TX 75602
|
2,704 sq. feet
|
2 baths - beds |
show details | |

|
#18
Neal St
Longview, TX 75602
|
2,517 sq. feet
|
3 baths - beds |
show details | |

|
#19
Hugh St
Marshall, TX 75670
|
- sq. feet
|
- baths - beds |
$34,900
|
show details |

|
#20
Alpine Dr
Marshall, TX 75672
|
- sq. feet
|
3 baths 4 beds |
show details |
| Photo | Address | Area | Beds / Baths | Price | Details |
|---|---|---|---|---|---|

|
#21
Zinnia Rd
Diana, TX 75640
|
2,680 sq. feet
|
3 baths 3 beds |
show details | |

|
#22
W Wynns Creek Rd
Kilgore, TX 75662
|
1,619 sq. feet
|
2 baths - beds |
show details | |

|
#23
Ferndale St
Longview, TX 75604
|
2,278 sq. feet
|
2 baths - beds |
show details | |

|
#24
Spider Lily Rd
Diana, TX 75640
|
1,416 sq. feet
|
1 baths - beds |
show details | |

|
#25
Larkspur St
White Oak, TX 75693
|
1,842 sq. feet
|
2 baths - beds |
show details | |

|
#26
E George Richey Rd
Longview, TX 75604
|
1,152 sq. feet
|
1 baths - beds |
show details | |

|
#27
Crossroads Dr
Longview, TX 75605
|
1,827 sq. feet
|
2 baths - beds |
show details | |

|
#28
Shady Ln
Longview, TX 75604
|
2,130 sq. feet
|
2 baths - beds |
show details | |

|
#29
S Lake Harris Rd
White Oak, TX 75693
|
1,880 sq. feet
|
2 baths - beds |
show details | |

|
#30
Amberwood Dr
Longview, TX 75605
|
2,011 sq. feet
|
2 baths - beds |
show details |
| Photo | Address | Area | Beds / Baths | Price | Details |
|---|---|---|---|---|---|

|
#31
Gilmer Rd # 101
Longview, TX 75604
|
7,475 sq. feet
|
4 baths - beds |
show details | |

|
#32
Lonesome Pine Rd
Longview, TX 75605
|
2,546 sq. feet
|
2 baths - beds |
show details | |

|
#33
Camille Dr
Longview, TX 75605
|
1,841 sq. feet
|
2 baths - beds |
show details | |

|
#34
Canyon Ridge Ct
Longview, TX 75604
|
1,929 sq. feet
|
2 baths - beds |
show details | |

|
#35
Webster St
Longview, TX 75602
|
1,787 sq. feet
|
2 baths - beds |
show details | |

|
#36
Dowell Dr
Longview, TX 75604
|
1,783 sq. feet
|
2 baths - beds |
show details | |

|
#37
Fairview Dr
Longview, TX 75604
|
2,013 sq. feet
|
1 baths - beds |
show details | |

|
#38
S White Oak Rd
White Oak, TX 75693
|
1,577 sq. feet
|
2 baths - beds |
show details | |

|
#39
Walters St
Longview, TX 75603
|
1,144 sq. feet
|
1 baths - beds |
show details | |

|
#40
Mary Jane Dr
Longview, TX 75601
|
1,707 sq. feet
|
2 baths - beds |
show details |
| Photo | Address | Area | Beds / Baths | Price | Details |
|---|---|---|---|---|---|

|
#41
Sidney St
Longview, TX 75602
|
1,872 sq. feet
|
2 baths - beds |
show details | |

|
#42
Johnson St
Longview, TX 75602
|
1,300 sq. feet
|
2 baths - beds |
show details | |

|
#43
Le Duke Blvd
Longview, TX 75601
|
3,435 sq. feet
|
3 baths - beds |
show details | |

|
#44
Willow Oak Dr
Longview, TX 75601
|
1,968 sq. feet
|
2 baths - beds |
show details | |

|
#45
S 13th St
Longview, TX 75602
|
1,448 sq. feet
|
2 baths - beds |
show details | |

|
#46
Wood Pl
Longview, TX 75601
|
2,238 sq. feet
|
2 baths - beds |
show details | |

|
#47
259 N N, # 617
Longview, TX 75605
|
- sq. feet
|
- baths - beds |
show details | |

|
#48
Pleasant Green Rd
Longview, TX 75603
|
- sq. feet
|
- baths - beds |
show details | |

|
#49
Melinda Ln
Tatum, TX 75691
|
2,088 sq. feet
|
- baths - beds |
show details | |

|
Check over 1 million property listings on Foreclosure.com!
|
browse all offers | |||

Latest news about housing in Hallsville, TX collected exclusively by city-data.com from local newspapers, TV, and radio stations

 | Hallsville, Tx Apartments For Rent- Any Info? Need For July... (3 replies) |
| Any homes in Hallsville, TX area (1 reply) |
| Any homes in Hallsville, TX area (1 reply) |
| Hallsville tx info (5 replies) |
| Returning to East Texas with family (52 replies) |
| Longview TX (14 replies) |

Median year apartment built: 1997
Household type by relationship:
Households: 4,413- Male householders: 1,067 (155 living alone), Female householders: 581 (101 living alone)
1,073 spouses (1,073 opposite-sex spouses), 89 unmarried partners, (64 opposite-sex unmarried partners), 1,552 children (1,348 natural, 192 adopted, 11 stepchildren), 0 grandchildren, 41 brothers or sisters, 0 parents, 0 foster children, 0 other relatives, 9 non-relatives
Size of family households: 517 2-persons, 566 3-persons, 161 4-persons, 128 5-persons.
Size of nonfamily households: 274 1-person, 70 2-persons.
962 married couples with children.
316 single-parent households (274 men, 42 women).
91.8% of residents of Hallsville speak English at home.
7.5% of residents speak Spanish at home (13% speak English very well, 43% speak English well, 33% speak English not well, 11% don't speak English at all).
Foreign born population: 164 (3.7%)
(99.4% of them are naturalized citizens)
| Here: | 6.8 |
| State: | 6.3 |
| Here: | 5.2 |
| State: | 4.0 |

- Bedrooms in owner-occupied houses and condos in Hallsville, Texas
- 0no bedroom
- 01 bedroom
- 212 bedrooms
- 5963 bedrooms
- 3604 bedrooms
- 05+ bedrooms

- Bedrooms in renter-occupied apartments in Hallsville, Texas
- 28no bedroom
- 271 bedroom
- 3092 bedrooms
- 2533 bedrooms
- 1514 bedrooms
- 05+ bedrooms

- Cars and other vehicles available in Hallsville in owner-occupied houses/condos
- 21no vehicle
- 1511 vehicle
- 5512 vehicles
- 1523 vehicles
- 744 vehicles
- 285+ vehicles

- Cars and other vehicles available in Hallsville in renter-occupied apartments
- 0no vehicle
- 3081 vehicle
- 4312 vehicles
- 293 vehicles
- 04 vehicles
- 05+ vehicles

- Rooms in owner-occupied houses in Hallsville, Texas
- 01 room
- 02 rooms
- 03 rooms
- 534 rooms
- 2085 rooms
- 2156 rooms
- 3047 rooms
- 1478 rooms
- 509+ rooms

- Rooms in renter-occupied apartments in Hallsville, Texas
- 281 room
- 272 rooms
- 983 rooms
- 2114 rooms
- 1105 rooms
- 606 rooms
- 07 rooms
- 2348 rooms
- 09+ rooms


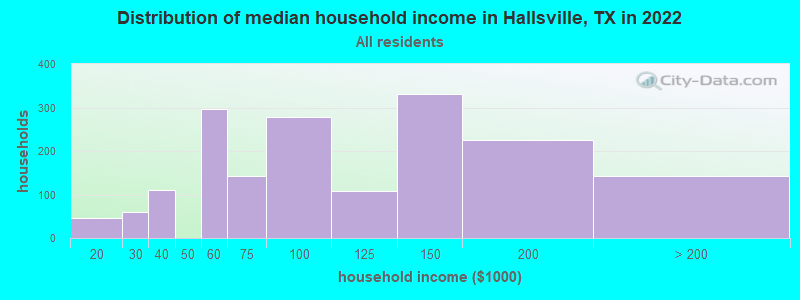
Hallsville, TX household income distribution

- 45$10,000 to $19,999
- 59$20,000 to $29,999
- 111$30,000 to $39,999
- 296$50,000 to $59,999
- 142$60,000 to $74,999
- 279$75,000 to $99,999
- 109$100,000 to $124,999
- 332$125,000 to $149,999
- 225$150,000 to $199,999
- 143$200,000 or more
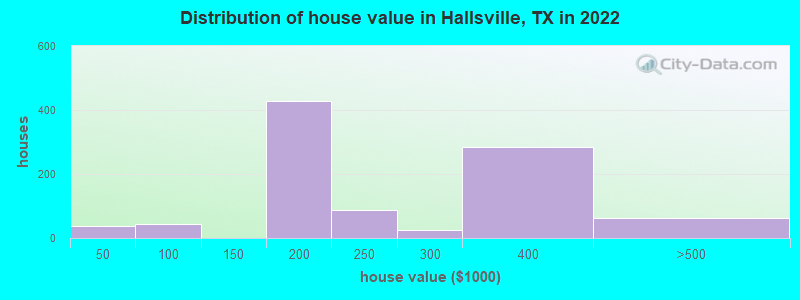
Home value of owner - occupied houses in 2022 in Hallsville, TX
-
- 36$15,000 to $19,999
- 19$50,000 to $59,999
- 11$70,000 to $79,999
- 14$90,000 to $99,999
- 382$150,000 to $174,999
- 46$175,000 to $199,999
- 88$200,000 to $249,999
- 26$250,000 to $299,999
- 284$300,000 to $399,999
- 60$400,000 to $499,999
Rent paid by renters in 2022 in Hallsville, TX
-
- 18$550 to $599
- 75$700 to $749
- 39$750 to $799
- 213$900 to $999
- 212$1,000 to $1,249
- 31$1,500 to $1,999
- 110No cash rent


Percentage of workers working in this county: 46.0%
Number of people working at home: 350 (13.3% of all workers)
Travel time to work (commute)
- Less than 5 minutes: 68
- 5 to 9 minutes: 283
- 10 to 14 minutes: 279
- 15 to 19 minutes: 932
- 20 to 24 minutes: 581
- 25 to 29 minutes: 197
- 30 to 34 minutes: 19
- 35 to 39 minutes: 0
- 40 to 44 minutes: 29
- 45 to 59 minutes: 20
- 60 to 89 minutes: 47
- 90 or more minutes: 128
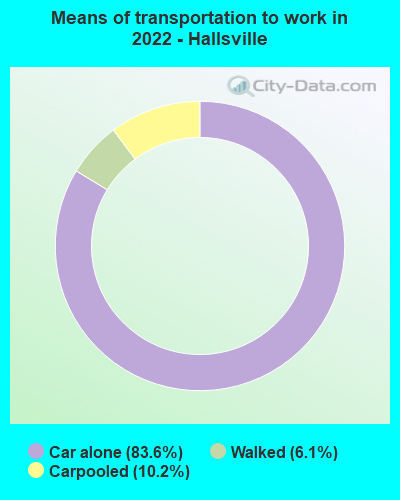
Means of transportation to work:
- Drove a car alone: 1,451 (69.3%)
- Carpooled: 192 (9.2%)
- Walked: 114 (5.4%)
- Worked at home: 350 (16.7%)

- Unemployment by race in 2022
- Unemployment rate for White non-Hispanic residents
- 1.6%Males

- Year of entry for the foreign-born population in Hallsville, Texas
- 02010 or later
- 432000 to 2009
- 01990 to 1999
- 61980 to 1989
- 41970 to 1979
- 5Before 1970

First ancestries reported:
- American: 799 (27.8%)
- English: 273 (9.5%)
- European: 234 (8.1%)
- Norwegian: 189 (6.6%)
- Irish: 161 (5.6%)
- German: 120 (4.2%)
- Italian: 63 (2.2%)
- Swedish: 54 (1.9%)
- Polish: 25 (0.9%)
Most common places of birth for foreign-born residents (%):
| Hallsville: | 36.2% (47) |
| Texas: | 1.2% (60,172) |
| Hallsville: | 34.6% (45) |
| Texas: | 3.0% (147,182) |
| Hallsville: | 34.6% (45) |
| Texas: | 48.4% (2,411,723) |
Place of birth for U.S.-born residents:
- This state: 3,071
- Other state: 1,057
- Northeast: 184
- Midwest: 228
- South: 312
- West: 148
82.0% of Hallsville residents lived in the same house 1 years ago.
Out of people who lived in different houses, 36.1% lived in this county.
Out of people who lived in different counties, 86.0% lived in Texas.
| Hallsville: | 82.0% |
| State average: | 85.7% |
Education attainment for males 25 years and older:
- No schooling: 0
- Nursery to 4th grade: 46
- 5th and 6th grade: 0
- 7th and 8th grade: 30
- 9th grade: 0
- 10th grade: 111
- 11th grade: 0
- 12th grade, no diploma: 0
- High school graduate (or equivalency): 163
- Less than 1 year of college: 109
- Some college more than 1 year, no degree: 579
- Associate degree: 55
- Bachelor's degree: 218
- Master's degree: 187
- Professional school degree: 0
- Doctorate degree: 54

Education attainment for females 25 years and older:
- No schooling: 0
- Nursery to 4th grade: 0
- 5th and 6th grade: 36
- 7th and 8th grade: 0
- 9th grade: 0
- 10th grade: 0
- 11th grade: 0
- 12th grade, no diploma: 0
- High school graduate (or equivalency): 139
- Less than 1 year of college: 160
- Some college more than 1 year, no degree: 74
- Associate degree: 194
- Bachelor's degree: 383
- Master's degree: 226
- Professional school degree: 0
- Doctorate degree: 0


Housing units in structures:
- One, detached: 1,262
- Two: 360
- 3 or 4: 26
- 5 to 9: 90
- Mobile homes: 245
House/condo owner moved in on average 4 years ago
Renter moved in on average 5 years ago

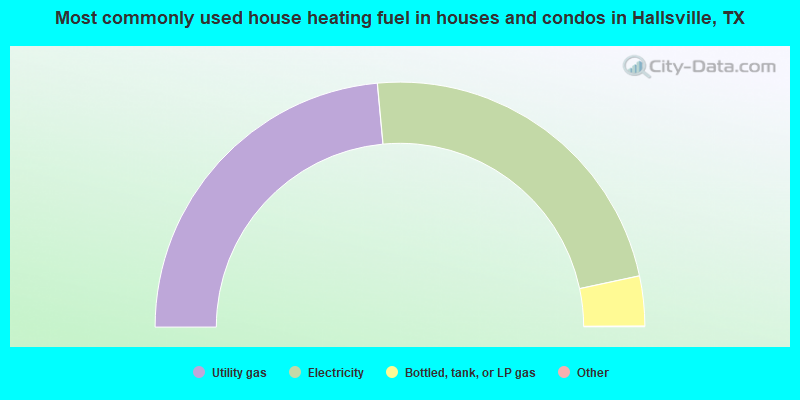
- 47.1%Utility gas
- 46.3%Electricity
- 6.6%Bottled, tank, or LP gas
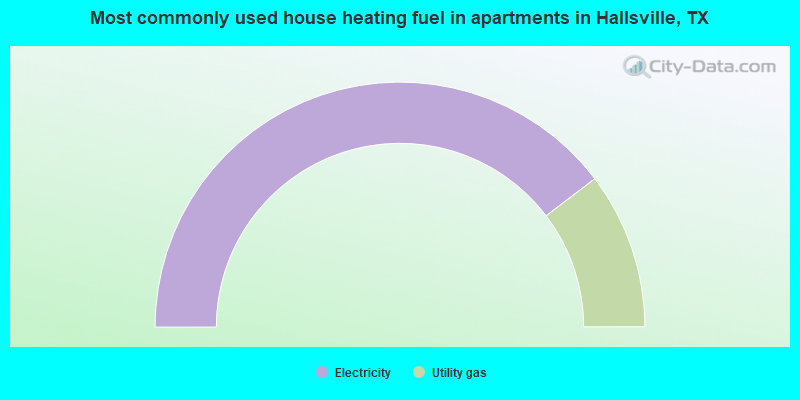
- 79.3%Electricity
- 20.7%Utility gas
Private vs. public school enrollment:
| Here: | 0.0% |
| Texas: | 8.8% |
| Here: | 6.4% |
| Texas: | 8.0% |
| Here: | 43.2% |
| Texas: | 16.2% |


