Haltom City, TX (Texas) Houses and Residents
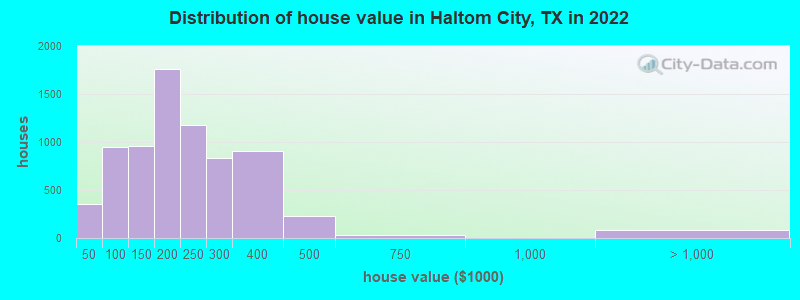
Estimated median house or condo value in 2022: $204,113 (it was $62,400 in 2000 )
Haltom City:
$204,113Texas:
$275,400
Lower value quartile - upper value quartile: $140,863 - $259,926Total population: 43,913 (Urban population: 39,229, Rural population: 0)
Houses: 18,449 (17,179 occupied: 9,010 owner occupied, 8,224 renter occupied )
% of renters here:
48%State:
38%
Housing density: 1,489 houses/condos per square mile
Median price asked for vacant for-sale houses and condos in 2022: $169,079.
Median contract rent in 2022: $1,098 (lower quartile is $879, upper quartile is $1,382)
Median rent asked for vacant for-rent units in 2022: $1,243
Median gross rent in Haltom City, TX in 2022: $1,272
Housing units in Haltom City with a mortgage: 4,009 (148 second mortgage, 0 home equity loan, 159 both second mortgage and home equity loan )Houses without a mortgage: 31
Median household income for houses/condos with a mortgage: $82,798
Median household income for apartments without a mortgage: $56,953
Median monthly housing costs: $1,120
Data:
Median house or condo value ($)
Median house or condo value ($ change since 2000)
Median house or condo value ($) - White
Median house or condo value ($) - Black or African American
Median house or condo value ($) - Asian
Median house or condo value ($) - Hispanic or Latino
Median house or condo value ($) - American Indian and Alaska Native
Median house or condo value ($) - Multirace
Median house or condo value ($) - Other Race
Median price asked for mobile homes ($)
Household density (households per square mile)
Mean house or condo value by units in structure - 1, detached ($)
Mean house or condo value by units in structure - 1, attached ($)
Mean house or condo value by units in structure - 2 ($)
Mean house or condo value by units in structure by units in structure - 3 or 4 ($)
Mean house or condo value by units in structure - 5 or more ($)
Mean house or condo value by units in structure - Boat, RV, van, etc. ($)
Mean house or condo value by units in structure - Mobile home ($)
Median contract rent ($)
Median contract rent - Lower quartile ($)
Median contract rent - Upper quartile ($)
Median gross rent ($)
Urban houses (%)
Rural houses (%)
Houses occupied (%)
Houses occupied (% change since 2000)
Houses owner occupied (%)
Houses owner occupied (% change since 2000)
Houses renter occupied (%)
Houses renter occupied (% change since 2000)
Vacant housing units - For rent (%)
Vacant housing units - For rent (% change since 2000)
Vacant housing units - For sale only (%)
Vacant housing units - For sale only (% change since 2000)
Vacant housing units - Rented or sold, not occupied (%)
Vacant housing units - Rented or sold, not occupied (% change since 2000)
Vacant housing units - For seasonal, recreational, or occasional use (%)
Vacant housing units - For seasonal, recreational, or occasional use (% change since 2000)
Vacant housing units - For migrant workers (%)
Vacant housing units - For migrant workers (% change since 2000)
Vacant housing units - Other vacant (%)
Vacant housing units - Other vacant (% change since 2000)
Median monthly housing costs ($)
Median household income for houses/condos with a mortgage ($)
Median household income for houses/condos without a mortgage ($)
Median household income ($)
Median household income ($) - White
Median household income ($) - Black or African American
Median household income ($) - Asian
Median household income ($) - Hispanic or Latino
Median household income ($) - American Indian and Alaska Native
Median household income ($) - Multirace
Median household income ($) - Other Race
Mortgage status - with mortgage (%)
Mortgage status - with second mortgage (%)
Mortgage status - with home equity loan (%)
Mortgage status - with both second mortgage and home equity loan (%)
Mortgage status - without a mortgage (%)
Median year house/condo built
Median year apartment built
Household type by relationship - Male householder living alone (%)
Household type by relationship - Male householder not living alone (%)
Household type by relationship - Female householder living alone (%)
Household type by relationship - Female householder not living alone (%)
Household type by relationship - Opposite-Sex spouse (%)
Household type by relationship - Same-Sex spouse (%)
Household type by relationship - Opposite-Sex unmarried partner (%)
Household type by relationship - Same-Sex unmarried partner (%)
Household type by relationship - In group quarters (%)
Size of family households - 2-person household (%)
Size of family households - 3-person household (%)
Size of family households - 4-person household (%)
Size of family households - 5-person household (%)
Size of family households - 6-person household (%)
Size of family households - 7-or-more-person household (%)
Size of nonfamily households - 1-person household (%)
Size of nonfamily households - 2-person household (%)
Size of nonfamily households - 3-person household (%)
Size of nonfamily households - 4-person household (%)
Size of nonfamily households - 5-person household (%)
Size of nonfamily households - 6-person household (%)
Size of nonfamily households - 7-or-moreperson household (%)
Year house built - Built 2010 or later (%)
Year house built - Built 2000 to 2009 (%)
Year house built - Built 1990 to 1999 (%)
Year house built - Built 1980 to 1989 (%)
Year house built - Built 1970 to 1979 (%)
Year house built - Built 1960 to 1969 (%)
Year house built - Built 1950 to 1959 (%)
Year house built - Built 1940 to 1949 (%)
Year house built - Built 1939 or earlier (%)
Median number of rooms in houses and condos
Median number of rooms in apartments
Median number of bedrooms in owner occupied houses
Mean number of bedrooms in owner occupied houses
Median number of bedrooms in renter occupied houses
Mean number of bedrooms in renter occupied houses
Median number of vehichles in owner occupied houses
Mean number of vehichles in owner occupied houses
Median number of vehichles in renter occupied houses
Mean number of vehichles in renter occupied houses
Rooms in owner-occupied houses - 1 room (%)
Rooms in owner-occupied houses - 2 rooms (%)
Rooms in owner-occupied houses - 3 rooms (%)
Rooms in owner-occupied houses - 4 rooms (%)
Rooms in owner-occupied houses - 5 rooms (%)
Rooms in owner-occupied houses - 6 rooms (%)
Rooms in owner-occupied houses - 7 rooms (%)
Rooms in owner-occupied houses - 8 rooms (%)
Rooms in owner-occupied houses - 9+ rooms (%)
Rooms in renter-occupied houses - 1 room (%)
Rooms in renter-occupied houses - 2 rooms (%)
Rooms in renter-occupied houses - 3 rooms (%)
Rooms in renter-occupied houses - 4 rooms (%)
Rooms in renter-occupied houses - 5 rooms (%)
Rooms in renter-occupied houses - 6 rooms (%)
Rooms in renter-occupied houses - 7 rooms (%)
Rooms in renter-occupied houses - 8 rooms (%)
Rooms in renter-occupied houses - 9+ rooms (%)
Bedrooms in owner-occupied houses - no bedrooms (%)
Bedrooms in owner-occupied houses - 1 bedroom (%)
Bedrooms in owner-occupied houses - 2 bedrooms (%)
Bedrooms in owner-occupied houses - 3 bedrooms (%)
Bedrooms in owner-occupied houses - 4 bedrooms (%)
Bedrooms in owner-occupied houses - 5+ bedrooms (%)
Bedrooms in renter-occupied houses - no bedrooms (%)
Bedrooms in renter-occupied houses - 1 bedroom (%)
Bedrooms in renter-occupied houses - 2 bedrooms (%)
Bedrooms in renter-occupied houses - 3 bedrooms (%)
Bedrooms in renter-occupied houses - 4 bedrooms (%)
Bedrooms in renter-occupied houses - 5+ bedrooms (%)
Vehicles available in owner-occupied houses - no vehicle available (%)
Vehicles available in owner-occupied houses - 1 vehicle available(%)
Vehicles available in owner-occupied houses - 2 Vehicles available (%)
Vehicles available in owner-occupied houses - 3 Vehicles available (%)
Vehicles available in owner-occupied houses - 4 Vehicles available (%)
Vehicles available in owner-occupied houses - 5+ Vehicles available (%)
Vehicles available in renter-occupied houses - no vehicle available (%)
Vehicles available in renter-occupied houses - 1 vehicle available (%)
Vehicles available in renter-occupied houses - 2 Vehicles available (%)
Vehicles available in renter-occupied houses - 3 Vehicles available (%)
Vehicles available in renter-occupied houses - 4 Vehicles available (%)
Vehicles available in renter-occupied houses - 5+ Vehicles available (%)
Housing units in structures - 1, detached (%)
Housing units in structures - 1, attached (%)
Housing units in structures - 2 (%)
Housing units in structures - 3 or 4 (%)
Housing units in structures - 5 to 9 (%)
Housing units in structures - 10 to 19 (%)
Housing units in structures - 20 to 49 (%)
Housing units in structures - 50 or more (%)
Housing units in structures - Mobile home (%)
Housing units in structures - Boat, RV, van, etc. (%)
Housing units in structures - Owners - 1, detached (%)
Housing units in structures - Owners - 1, attached (%)
Housing units in structures - Owners - 2 (%)
Housing units in structures - Owners - 3 or 4 (%)
Housing units in structures - Owners - 5 to 9 (%)
Housing units in structures - Owners - 10 to 19 (%)
Housing units in structures - Owners - 20 to 49 (%)
Housing units in structures - Owners - 50 or more (%)
Housing units in structures - Owners - Mobile home (%)
Housing units in structures - Owners - Boat, RV, van, etc. (%)
Housing units in structures - Renters - 1, detached (%)
Housing units in structures - Renters - 1, attached (%)
Housing units in structures - Renters - 2 (%)
Housing units in structures - Renters - 3 or 4 (%)
Housing units in structures - Renters - 5 to 9 (%)
Housing units in structures - Renters - 10 to 19 (%)
Housing units in structures - Renters - 20 to 49 (%)
Housing units in structures - Renters - 50 or more (%)
Housing units in structures - Renters - Mobile home (%)
Housing units in structures - Renters - Boat, RV, van, etc. (%)
House/condo owner moved in on average (years ago)
Renter moved in on average (years ago)
Year householder moved into unit - Moved in 1999 to March 2000 (%)
Year householder moved into unit - Moved in 1999 to March 2000 (%) - White
Year householder moved into unit - Moved in 1999 to March 2000 (%) - Black or African American
Year householder moved into unit - Moved in 1999 to March 2000 (%) - Asian
Year householder moved into unit - Moved in 1999 to March 2000 (%) - Hispanic or Latino
Year householder moved into unit - Moved in 1999 to March 2000 (%) - American Indian and Alaska Native
Year householder moved into unit - Moved in 1999 to March 2000 (%) - Multirace
Year householder moved into unit - Moved in 1999 to March 2000 (%) - Other Race
Year householder moved into unit - Moved in 1995 to 1998 (%)
Year householder moved into unit - Moved in 1995 to 1998 (%) - White
Year householder moved into unit - Moved in 1995 to 1998 (%) - Black or African American
Year householder moved into unit - Moved in 1995 to 1998 (%) - Asian
Year householder moved into unit - Moved in 1995 to 1998 (%) - Hispanic or Latino
Year householder moved into unit - Moved in 1995 to 1998 (%) - American Indian and Alaska Native
Year householder moved into unit - Moved in 1995 to 1998 (%) - Multirace
Year householder moved into unit - Moved in 1995 to 1998 (%) - Other Race
Year householder moved into unit - Moved in 1990 to 1994 (%)
Year householder moved into unit - Moved in 1990 to 1994 (%) - White
Year householder moved into unit - Moved in 1990 to 1994 (%) - Black or African American
Year householder moved into unit - Moved in 1990 to 1994 (%) - Asian
Year householder moved into unit - Moved in 1990 to 1994 (%) - Hispanic or Latino
Year householder moved into unit - Moved in 1990 to 1994 (%) - American Indian and Alaska Native
Year householder moved into unit - Moved in 1990 to 1994 (%) - Multirace
Year householder moved into unit - Moved in 1990 to 1994 (%) - Other Race
Year householder moved into unit - Moved in 1980 to 1989 (%)
Year householder moved into unit - Moved in 1980 to 1989 (%) - White
Year householder moved into unit - Moved in 1980 to 1989 (%) - Black or African American
Year householder moved into unit - Moved in 1980 to 1989 (%) - Asian
Year householder moved into unit - Moved in 1980 to 1989 (%) - Hispanic or Latino
Year householder moved into unit - Moved in 1980 to 1989 (%) - American Indian and Alaska Native
Year householder moved into unit - Moved in 1980 to 1989 (%) - Multirace
Year householder moved into unit - Moved in 1980 to 1989 (%) - Other Race
Year householder moved into unit - Moved in 1970 to 1979 (%)
Year householder moved into unit - Moved in 1970 to 1979 (%) - White
Year householder moved into unit - Moved in 1970 to 1979 (%) - Black or African American
Year householder moved into unit - Moved in 1970 to 1979 (%) - Asian
Year householder moved into unit - Moved in 1970 to 1979 (%) - Hispanic or Latino
Year householder moved into unit - Moved in 1970 to 1979 (%) - American Indian and Alaska Native
Year householder moved into unit - Moved in 1970 to 1979 (%) - Multirace
Year householder moved into unit - Moved in 1970 to 1979 (%) - Other Race
Year householder moved into unit - Moved in 1969 or earlier (%)
Year householder moved into unit - Moved in 1969 or earlier (%) - White
Year householder moved into unit - Moved in 1969 or earlier (%) - Black or African American
Year householder moved into unit - Moved in 1969 or earlier (%) - Asian
Year householder moved into unit - Moved in 1969 or earlier (%) - Hispanic or Latino
Year householder moved into unit - Moved in 1969 or earlier (%) - American Indian and Alaska Native
Year householder moved into unit - Moved in 1969 or earlier (%) - Multirace
Year householder moved into unit - Moved in 1969 or earlier (%) - Other Race
Housing units lacking complete plumbing facilities (%)
Housing units lacking complete kitchen facilities (%)
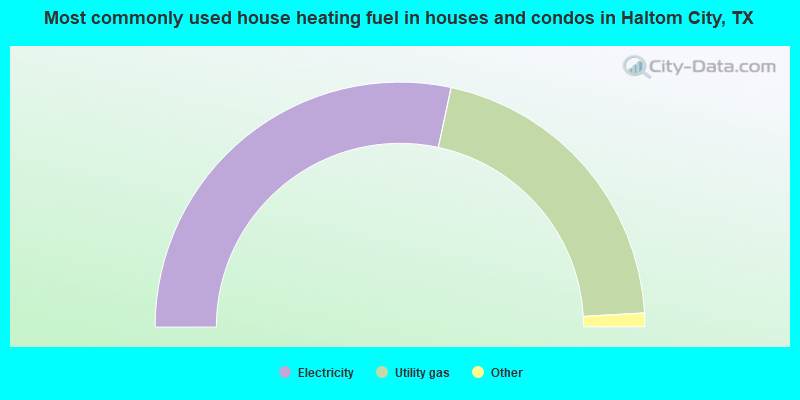
House heating fuel used in houses and condos - Utility gas (%)
House heating fuel used in houses and condos - Bottled, tank, or LP gas (%)
House heating fuel used in houses and condos - Electricity (%)
House heating fuel used in houses and condos - Fuel oil, kerosene, etc. (%)
House heating fuel used in houses and condos - Coal or coke (%)
House heating fuel used in houses and condos - Wood (%)
House heating fuel used in houses and condos - Solar energy (%)
House heating fuel used in houses and condos - Other fuel (%)
House heating fuel used in houses and condos - No fuel used (%)
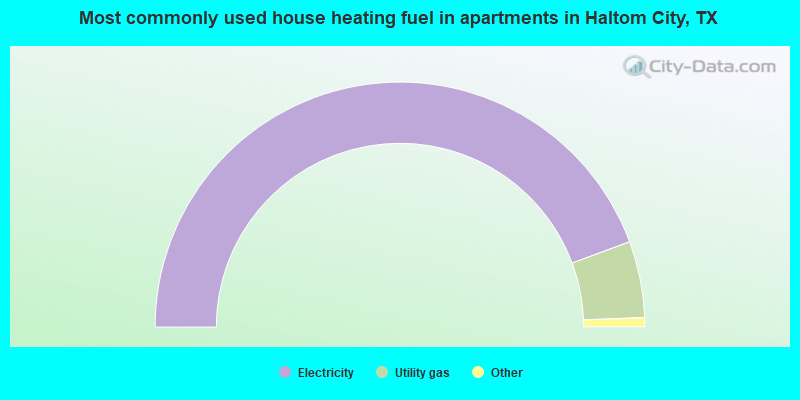
House heating fuel used in apartments - Utility gas (%)
House heating fuel used in apartments - Bottled, tank, or LP gas (%)
House heating fuel used in apartments - Electricity (%)
House heating fuel used in apartments - Fuel oil, kerosene, etc. (%)
House heating fuel used in apartments - Coal or coke (%)
House heating fuel used in apartments - Wood (%)
House heating fuel used in apartments - Solar energy (%)
House heating fuel used in apartments - Other fuel (%)
House heating fuel used in apartments - No fuel used (%)
Median year house/condo built: 1969Median year apartment built: 1983Household type by relationship:
Households: 46,653
Male householders: 8,919 (2,345 living alone ), Female householders: 7,930 (2,049 living alone )7,190 spouses (7,167 opposite-sex spouses ), 952 unmarried partners , (844 opposite-sex unmarried partners ), 15,426 children (14,539 natural , 64 adopted , 822 stepchildren ), 2,085 grandchildren , 710 brothers or sisters , 822 parents , 39 foster children , 998 other relatives , 1,465 non-relatives In group quarters: 110
Size of family households: 4,488 2-persons , 2,630 3-persons , 1,958 4-persons , 1,361 5-persons , 656 6-persons , 234 7-or-more-persons .
Size of nonfamily households: 4,758 1-person , 1,020 2-persons , 81 3-persons , 27 4-persons .
6,088 married couples with children. single-parent households (844 men , 3,154 women ).
52.7% of residents of Haltom City speak English at home. of residents speak Spanish at home (67% speak English very well , 14% speak English well , 14% speak English not well , 4% don't speak English at all ).of residents speak other Indo-European language at home (30% speak English very well , 57% speak English well , 13% speak English not well ).of residents speak Asian or Pacific Island language at home (39% speak English very well , 29% speak English well , 29% speak English not well , 3% don't speak English at all ).of residents speak other language at home (84% speak English very well , 16% speak English well ).
Foreign born population: 11,187 (24.0%)of them are naturalized citizens )
Median number of rooms in houses and condos:
Median number of rooms in apartments
Owner-occupied Renter-occupied
Rooms in owner-occupied houses in Haltom City, Texas
16 1 room 95 2 rooms 215 3 rooms 1,022 4 rooms 2,671 5 rooms 2,624 6 rooms 1,396 7 rooms 620 8 rooms 352 9+ rooms
Rooms in renter-occupied apartments in Haltom City, Texas
834 1 room 253 2 rooms 1,831 3 rooms 2,193 4 rooms 1,154 5 rooms 1,413 6 rooms 503 7 rooms 44 8 rooms 0 9+ rooms
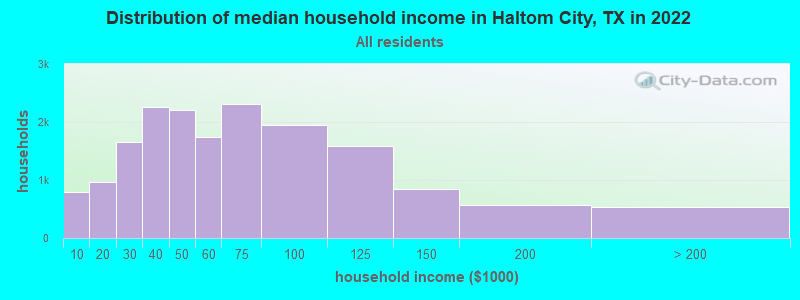
Haltom City, TX household income distribution 797 Less than $10,000961 $10,000 to $19,9991,659 $20,000 to $29,9992,267 $30,000 to $39,9992,209 $40,000 to $49,9991,738 $50,000 to $59,9992,306 $60,000 to $74,9991,956 $75,000 to $99,9991,584 $100,000 to $124,999837 $125,000 to $149,999571 $150,000 to $199,999535 $200,000 or more
Home value of owner - occupied houses in 2022 in Haltom City, TX 62 Less than $10,000143 $10,000 to $14,99927 $15,000 to $19,99957 $20,000 to $24,99941 $35,000 to $39,99915 $40,000 to $49,999253 $50,000 to $59,99961 $60,000 to $69,999151 $70,000 to $79,999192 $80,000 to $89,999278 $90,000 to $99,999541 $100,000 to $124,999419 $125,000 to $149,999879 $150,000 to $174,999876 $175,000 to $199,9991,181 $200,000 to $249,999833 $250,000 to $299,999906 $300,000 to $399,999231 $400,000 to $499,99932 $500,000 to $749,99959 $1,000,000 to $1,499,99923 $2,000,000 or moreRent paid by renters in 2022 in Haltom City, TX 20 Less than $10025 $200 to $2494 $250 to $29932 $350 to $39935 $400 to $44941 $450 to $499227 $500 to $54963 $550 to $599334 $600 to $649169 $650 to $699156 $700 to $749210 $750 to $799806 $800 to $899779 $900 to $9992,211 $1,000 to $1,2491,576 $1,250 to $1,499681 $1,500 to $1,999176 $2,000 to $2,499262 No cash rent
Percentage of workers working in this county: 84.4%Number of people working at home: 2,094 (9.1% of all workers )
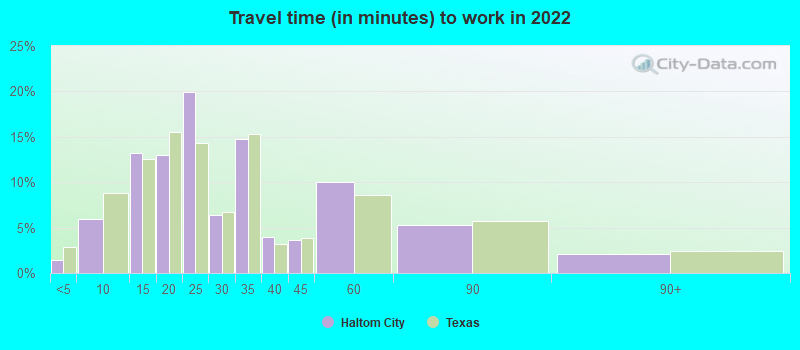
Travel time to work (commute)
Less than 5 minutes: 1725 to 9 minutes: 1,40910 to 14 minutes: 3,07215 to 19 minutes: 3,18020 to 24 minutes: 3,63925 to 29 minutes: 1,72330 to 34 minutes: 3,29335 to 39 minutes: 75740 to 44 minutes: 56345 to 59 minutes: 1,38260 to 89 minutes: 81990 or more minutes: 283
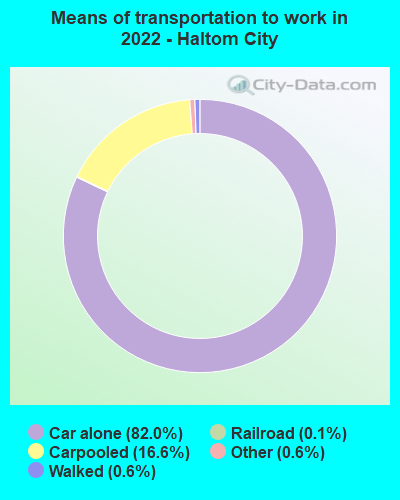
Means of transportation to work:
Drove a car alone: 13,720 (71.5%)Carpooled: 2,875 (15.0%)Bus : 6 (0.0%)Light rail, streetcar or trolley : 27 (0.1%)Taxi: 117 (0.6%)Walked: 103 (0.5%)Worked at home: 2,094 (10.9%)
Unemployment by race in 2022
Unemployment rate for White non-Hispanic residents 4.3% Males2.4% FemalesUnemployment rate for Black residents 6.1% Males1.5% FemalesUnemployment rate for Asian residents 2.3% Males1.5% FemalesUnemployment rate for other race residents 0.8% Males8.4% FemalesUnemployment rate for two or more race residents 1.7% FemalesUnemployment rate for Hispanic or Latino residents 1.3% Males5.0% Females
Year of entry for the foreign-born population in Haltom City, Texas
3,487 2010 or later 2,998 2000 to 2009 2,560 1990 to 1999 1,743 1980 to 1989 878 1970 to 1979 164 Before 1970
First ancestries reported:
English: 1,502 (5.4%)
American: 1,469 (5.3%)
German: 825 (3.0%)
Irish: 718 (2.6%)
African: 423 (1.5%)
European: 261 (0.9%)
Ugandan: 213 (0.8%)
Haitian: 192 (0.7%)
Italian: 166 (0.6%)
Slavic: 147 (0.5%)
Scotch-Irish: 116 (0.4%)
Kenyan: 95 (0.3%)
Egyptian: 84 (0.3%)
Serbian: 83 (0.3%)
Polish: 78 (0.3%)
Welsh: 52 (0.2%)
Arab: 50 (0.2%)
Czechoslovakian: 48 (0.2%)
Scottish: 44 (0.2%)
Austrian: 41 (0.1%)
Czech: 35 (0.1%)
Moroccan: 29 (0.1%)
French: 27 (0.10%)
Liberian: 24 (0.09%)
Scandinavian: 21 (0.08%)
Russian: 19 (0.07%)
Greek: 15 (0.05%)
Norwegian: 15 (0.05%)
Swedish: 15 (0.05%)
British: 11 (0.04%)
French Canadian: 9 (0.03%)
Hungarian: 7 (0.03%) Most common places of birth for foreign-born residents (%): Mexico Haltom City:
48.0% (5,455)Texas:
48.4% (2,411,723)
Vietnam Haltom City:
14.6% (1,659)Texas:
3.7% (184,770)
Laos Haltom City:
4.9% (559)Texas:
0.2% (9,141)
Democratic Republic of Congo (Zaire) Haltom City:
3.0% (345)Texas:
0.1% (5,522)
El Salvador Haltom City:
2.9% (329)Texas:
4.5% (224,455)
Congo Haltom City:
2.6% (295)Texas:
0.1% (6,376)
Uganda Haltom City:
2.3% (264)Texas:
0.1% (3,573)
Nepal Haltom City:
2.3% (264)Texas:
0.6% (27,480)
Micronesia Haltom City:
2.2% (250)Texas:
0.0% (1,934)
Place of birth for U.S.-born residents:
This state: 25,984Other state: 8,648Northeast: 971Midwest: 2,319South: 2,550West: 2,843 91.3% of Haltom City residents lived in the same house 1 years ago.
Out of people who lived in different houses, 39.2% lived in this county.
Out of people who lived in different counties, 69.1% lived in Texas.
Haltom City:
91.3%State average:
85.7%
Education attainment for males 25 years and older:
No schooling: 520Nursery to 4th grade: 815th and 6th grade: 6367th and 8th grade: 7569th grade: 52910th grade: 50211th grade: 25712th grade, no diploma: 430High school graduate (or equivalency): 6,708Less than 1 year of college: 807Some college more than 1 year, no degree: 1,638Associate degree: 958Bachelor's degree: 1,377Master's degree: 359Professional school degree: 16Doctorate degree: 0
Education attainment for females 25 years and older:
No schooling: 529Nursery to 4th grade: 1505th and 6th grade: 5937th and 8th grade: 3929th grade: 56510th grade: 53111th grade: 36012th grade, no diploma: 387High school graduate (or equivalency): 4,820Less than 1 year of college: 910Some college more than 1 year, no degree: 1,980Associate degree: 1,098Bachelor's degree: 1,416Master's degree: 407Professional school degree: 78Doctorate degree: 72
Housing units in structures:
One, detached: 11,228One, attached: 232Two: 2943 or 4: 8965 to 9: 1,18010 to 19: 1,96420 to 49: 1,23450 or more: 531Mobile homes: 887Median worth of mobile homes: $70,566
Housing units lacking complete plumbing facilities in 2022: 1.4%Housing units lacking complete kitchen facilities in 2022: 3.1%House/condo owner moved in on average 17 years ago
Renter moved in on average 3 years ago
Private vs. public school enrollment:
Students in private schools in grades 1 to 8 (elementary and middle school): 571 Students in private schools in grades 9 to 12 (high school): 152 Students in private undergraduate colleges: 313