Hamilton, OH (Ohio) Houses and Residents
| Hamilton: | $168,577 |
| Ohio: | $204,100 |
Mean price in 2022:
Detached houses: $171,515
Here: $171,515 State: $254,366 Townhouses or other attached units: $195,522
Here: $195,522 State: $225,733 In 2-unit structures: $361,422
Here: $361,422 State: $144,384 In 3-to-4-unit structures: $195,422
Here: $195,422 State: $203,002 In 5-or-more-unit structures: $911,761
Here: $911,761 State: $211,593 Mobile homes: $8,608
Here: $8,608 State: $62,719
Total population: 62,486 (Urban population: 60,338, Rural population: 324 (all nonfarm))
Houses: 27,310 (24,955 occupied: 13,833 owner occupied, 11,502 renter occupied)
| % of renters here: | 45% |
| State: | 33% |
Housing density: 1,264 houses/condos per square mile
Median price asked for vacant for-sale houses and condos in 2022: $83,377.
Median contract rent in 2022: $654 (lower quartile is $561, upper quartile is $896)
Median rent asked for vacant for-rent units in 2022: $728
Median gross rent in Hamilton, OH in 2022: $884
Housing units in Hamilton with a mortgage: 7,929 (530 second mortgage, 0 home equity loan, 419 both second mortgage and home equity loan)
Houses without a mortgage: 193
Median household income for houses/condos with a mortgage: $72,563
Median household income for apartments without a mortgage: $57,663
Median monthly housing costs: $890
Compare current foreclosures in Hamilton, OH:
| Photo | Address | Area | Beds / Baths | Price | Details |
|---|---|---|---|---|---|

|
#1
Seven Mile Ave
Hamilton, OH 45011
|
720 sq. feet
|
1 baths 2 beds |
show details | |

|
#2
S 13th St
Hamilton, OH 45011
|
1,216 sq. feet
|
1 baths 3 beds |
show details | |

|
#3
Clark St
Hamilton, OH 45011
|
1,052 sq. feet
|
1 baths 2 beds |
show details | |

|
#4
Oakmont Ave
Hamilton, OH 45013
|
1,092 sq. feet
|
1 baths 3 beds |
show details | |

|
#5
Pleasant Ave
Hamilton, OH 45015
|
1,988 sq. feet
|
1 baths 3 beds |
show details | |

|
#6
Symmes Ave
Hamilton, OH 45015
|
884 sq. feet
|
2 baths 3 beds |
show details | |

|
#7
Harrison Ave
Hamilton, OH 45013
|
806 sq. feet
|
1 baths 1 beds |
show details | |

|
#8
Autumn Walk
Hamilton, OH 45013
|
1,658 sq. feet
|
2 baths 3 beds |
show details | |

|
#9
Hilda Ave
Hamilton, OH 45015
|
960 sq. feet
|
1 baths 2 beds |
show details | |

|
#10
Parrish Ave
Hamilton, OH 45011
|
1,664 sq. feet
|
2 baths 3 beds |
show details |
| Photo | Address | Area | Beds / Baths | Price | Details |
|---|---|---|---|---|---|

|
#11
Andrew Ave
Hamilton, OH 45015
|
836 sq. feet
|
1 baths 2 beds |
show details | |

|
#12
Campbell Ave
Hamilton, OH 45011
|
680 sq. feet
|
1 baths 2 beds |
show details | |

|
#13
Wayside Cir
Hamilton, OH 45013
|
2,163 sq. feet
|
1 baths 2 beds |
show details | |

|
#14
Campbell Dr
Hamilton, OH 45011
|
1,176 sq. feet
|
1 baths 3 beds |
show details | |

|
#15
Sheila Ct
Hamilton, OH 45013
|
2,502 sq. feet
|
3 baths 4 beds |
show details | |

|
#16
Bell Rd
Hamilton, OH 45013
|
1,632 sq. feet
|
2 baths 3 beds |
show details | |

|
#17
Thornhill Dr
Hamilton, OH 45013
|
1,440 sq. feet
|
2 baths 3 beds |
show details | |

|
#18
Arbor Springs Dr
Hamilton, OH 45013
|
2,000 sq. feet
|
2 baths 3 beds |
show details | |

|
#19
Fayetta Dr
Hamilton, OH 45011
|
1,646 sq. feet
|
2 baths 4 beds |
show details | |

|
#20
Stillington Dr
Hamilton, OH 45011
|
2,302 sq. feet
|
2 baths 4 beds |
show details |
| Photo | Address | Area | Beds / Baths | Price | Details |
|---|---|---|---|---|---|

|
#21
Sanders Dr
Hamilton, OH 45013
|
1,498 sq. feet
|
2 baths 3 beds |
show details | |

|
#22
Parrish Ave
Hamilton, OH 45015
|
1,680 sq. feet
|
2 baths 3 beds |
show details | |

|
#23
Ravena Dr
Hamilton, OH 45011
|
2,293 sq. feet
|
2 baths 3 beds |
show details | |

|
#24
Jacksonburg Rd
Hamilton, OH 45011
|
1,288 sq. feet
|
2 baths 3 beds |
show details | |

|
#25
Haven Ave
Hamilton, OH 45013
|
1,344 sq. feet
|
1 baths 3 beds |
show details | |

|
#26
Columbia Cir
Hamilton, OH 45011
|
1,294 sq. feet
|
3 baths 2 beds |
show details | |

|
#27
Gordon Smith Blvd Apt 11
Hamilton, OH 45013
|
932 sq. feet
|
1 baths 2 beds |
show details | |

|
#28
Carlisle Ave
Hamilton, OH 45013
|
1,008 sq. feet
|
1 baths 2 beds |
show details | |

|
#29
Elk Green Ct
Hamilton, OH 45011
|
2,055 sq. feet
|
2 baths 4 beds |
show details | |

|
#30
Silax Dr
Hamilton, OH 45013
|
2,268 sq. feet
|
2 baths 3 beds |
show details |
| Photo | Address | Area | Beds / Baths | Price | Details |
|---|---|---|---|---|---|

|
#31
Benninghofen Ave
Hamilton, OH 45015
|
1,726 sq. feet
|
2 baths 3 beds |
show details | |

|
#32
Ridgewood Ave
Hamilton, OH 45013
|
836 sq. feet
|
2 baths 2 beds |
show details | |

|
#33
Creekside Way
Hamilton, OH 45011
|
3,630 sq. feet
|
3 baths 3 beds |
show details | |

|
#34
Brough Ave
Hamilton, OH 45015
|
1,152 sq. feet
|
1 baths 2 beds |
show details | |

|
#35
Central Ave Apt 2
Hamilton, OH 45011
|
2,567 sq. feet
|
2 baths 4 beds |
show details | |

|
#36
Sipple Ave
Hamilton, OH 45011
|
828 sq. feet
|
1 baths 2 beds |
show details | |

|
#37
Laurel Ave
Hamilton, OH 45015
|
1,344 sq. feet
|
1 baths 2 beds |
show details | |

|
#38
Lockwood Ave
Hamilton, OH 45011
|
810 sq. feet
|
1 baths 2 beds |
show details | |

|
#39
Lawn Ave
Hamilton, OH 45013
|
1,612 sq. feet
|
1 baths 3 beds |
show details | |

|
#40
Central Ave
Hamilton, OH 45011
|
1,754 sq. feet
|
1 baths 4 beds |
show details |
| Photo | Address | Area | Beds / Baths | Price | Details |
|---|---|---|---|---|---|

|
#41
N F St
Hamilton, OH 45013
|
1,092 sq. feet
|
1 baths 2 beds |
show details | |

|
#42
Maple Ave
Hamilton, OH 45011
|
1,379 sq. feet
|
1 baths 3 beds |
show details | |

|
#43
Mark Ave
Hamilton, OH 45013
|
852 sq. feet
|
1 baths 2 beds |
show details | |

|
#44
Pleasant Ave
Hamilton, OH 45015
|
1,960 sq. feet
|
1 baths 3 beds |
show details | |

|
#45
Reservoir St
Hamilton, OH 45011
|
1,280 sq. feet
|
1 baths 4 beds |
show details | |

|
#46
Green Crest Dr
Hamilton, OH 45011
|
1,500 sq. feet
|
2 baths 3 beds |
show details | |

|
#47
Chestnut St
Hamilton, OH 45011
|
1,368 sq. feet
|
1 baths 2 beds |
show details | |

|
#48
Kelly Marie Ct
Hamilton, OH 45011
|
3,918 sq. feet
|
2 baths 4 beds |
show details | |

|
#49
Garner Rd
Hamilton, OH 45013
|
2,058 sq. feet
|
1 baths 3 beds |
show details | |

|
Check over 1 million property listings on Foreclosure.com!
|
browse all offers | |||

Latest news about housing in Hamilton, OH collected exclusively by city-data.com from local newspapers, TV, and radio stations

 | Moving from a rented condo to our own home. (16 replies) |
| Blendon Woods condos (2 replies) |
| Blendon Woods/Gahanna/Blacklick area condos? (2 replies) |
| Looking for Condo Recommendations (1 reply) |
| Relocating - suggestions on kid-friendly apartments in Columbus area? (5 replies) |
| Seeking apartment info about Fairfield and Hamilton (6 replies) |

Median year apartment built: 1959
Household type by relationship:
Households: 63,164- Male householders: 10,879 (3,704 living alone), Female householders: 13,826 (4,437 living alone)
9,245 spouses (9,042 opposite-sex spouses), 2,643 unmarried partners, (2,590 opposite-sex unmarried partners), 17,751 children (16,379 natural, 139 adopted, 1,232 stepchildren), 2,293 grandchildren, 619 brothers or sisters, 533 parents, 65 foster children, 1,181 other relatives, 2,363 non-relatives
- In group quarters: 1,762
Size of family households: 6,702 2-persons, 3,921 3-persons, 2,693 4-persons, 1,245 5-persons, 450 6-persons, 334 7-or-more-persons.
Size of nonfamily households: 7,739 1-person, 1,872 2-persons, 99 3-persons, 75 4-persons, 32 5-persons, 38 6-persons.
6,903 married couples with children.
6,282 single-parent households (1,363 men, 4,919 women).
91.3% of residents of Hamilton speak English at home.
7.3% of residents speak Spanish at home (44% speak English very well, 12% speak English well, 15% speak English not well, 29% don't speak English at all).
0.5% of residents speak other Indo-European language at home (74% speak English very well, 9% speak English well, 5% speak English not well, 12% don't speak English at all).
0.5% of residents speak Asian or Pacific Island language at home (60% speak English very well, 22% speak English well, 18% don't speak English at all).
0.2% of residents speak other language at home (76% speak English very well, 24% speak English well).
Foreign born population: 3,236 (5.1%)
(30.2% of them are naturalized citizens)
| Here: | 6.2 |
| State: | 6.7 |
| Here: | 4.5 |
| State: | 4.4 |

- Bedrooms in owner-occupied houses and condos in Hamilton, Ohio
- 40no bedroom
- 3021 bedroom
- 3,9102 bedrooms
- 6,6893 bedrooms
- 2,5664 bedrooms
- 3265+ bedrooms

- Bedrooms in renter-occupied apartments in Hamilton, Ohio
- 342no bedroom
- 2,5511 bedroom
- 4,9922 bedrooms
- 2,9313 bedrooms
- 6224 bedrooms
- 665+ bedrooms

- Cars and other vehicles available in Hamilton in owner-occupied houses/condos
- 419no vehicle
- 4,2101 vehicle
- 6,2742 vehicles
- 1,9813 vehicles
- 5424 vehicles
- 4095+ vehicles

- Cars and other vehicles available in Hamilton in renter-occupied apartments
- 1,806no vehicle
- 5,3411 vehicle
- 3,2442 vehicles
- 7813 vehicles
- 1594 vehicles
- 1715+ vehicles

- Rooms in owner-occupied houses in Hamilton, Ohio
- 401 room
- 242 rooms
- 543 rooms
- 1,1874 rooms
- 3,4715 rooms
- 3,7556 rooms
- 2,1837 rooms
- 1,3648 rooms
- 1,7559+ rooms

- Rooms in renter-occupied apartments in Hamilton, Ohio
- 3181 room
- 3892 rooms
- 1,5213 rooms
- 3,0914 rooms
- 3,0305 rooms
- 1,8796 rooms
- 7287 rooms
- 1988 rooms
- 3499+ rooms


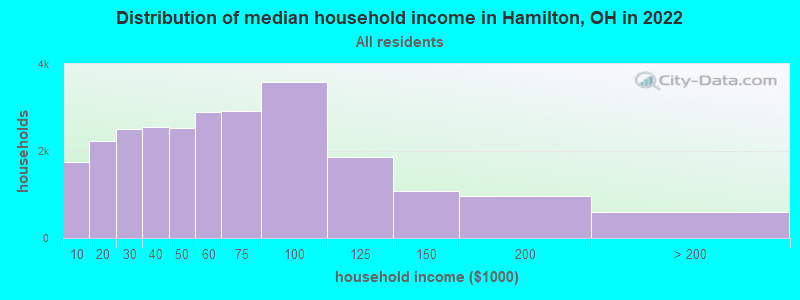
Hamilton, OH household income distribution

- 1,752Less than $10,000
- 2,237$10,000 to $19,999
- 2,515$20,000 to $29,999
- 2,561$30,000 to $39,999
- 2,518$40,000 to $49,999
- 2,896$50,000 to $59,999
- 2,914$60,000 to $74,999
- 3,578$75,000 to $99,999
- 1,869$100,000 to $124,999
- 1,090$125,000 to $149,999
- 967$150,000 to $199,999
- 594$200,000 or more
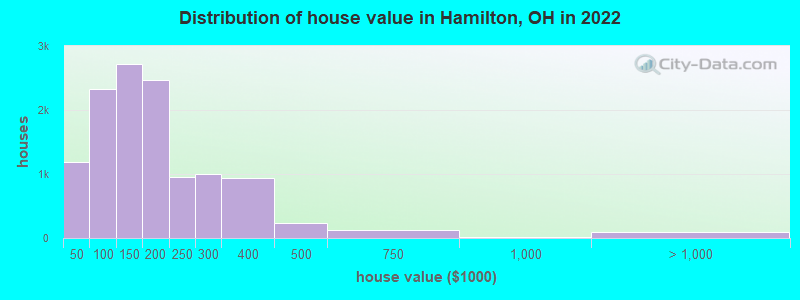
Home value of owner - occupied houses in 2022 in Hamilton, OH
-
- 122Less than $10,000
- 247$10,000 to $14,999
- 113$15,000 to $19,999
- 196$20,000 to $24,999
- 95$25,000 to $29,999
- 106$30,000 to $34,999
- 63$35,000 to $39,999
- 249$40,000 to $49,999
- 219$50,000 to $59,999
- 216$60,000 to $69,999
- 660$70,000 to $79,999
- 353$80,000 to $89,999
- 621$90,000 to $99,999
- 1,535$100,000 to $124,999
- 1,183$125,000 to $149,999
- 1,367$150,000 to $174,999
- 1,104$175,000 to $199,999
- 952$200,000 to $249,999
- 1,003$250,000 to $299,999
- 930$300,000 to $399,999
- 241$400,000 to $499,999
- 123$500,000 to $749,999
- 16$750,000 to $999,999
- 70$1,000,000 to $1,499,999
- 19$2,000,000 or more
Rent paid by renters in 2022 in Hamilton, OH
-
- 128Less than $100
- 15$100 to $149
- 9$150 to $199
- 68$200 to $249
- 157$250 to $299
- 342$300 to $349
- 79$350 to $399
- 494$400 to $449
- 332$450 to $499
- 796$500 to $549
- 1,289$550 to $599
- 1,206$600 to $649
- 1,044$650 to $699
- 1,413$700 to $749
- 1,132$750 to $799
- 727$800 to $899
- 931$900 to $999
- 972$1,000 to $1,249
- 261$1,250 to $1,499
- 121$1,500 to $1,999
- 8$2,000 to $2,499
- 108$2,500 to $2,999
- 407No cash rent


Percentage of workers working in this county: 77.4%
Number of people working at home: 2,151 (7.8% of all workers)
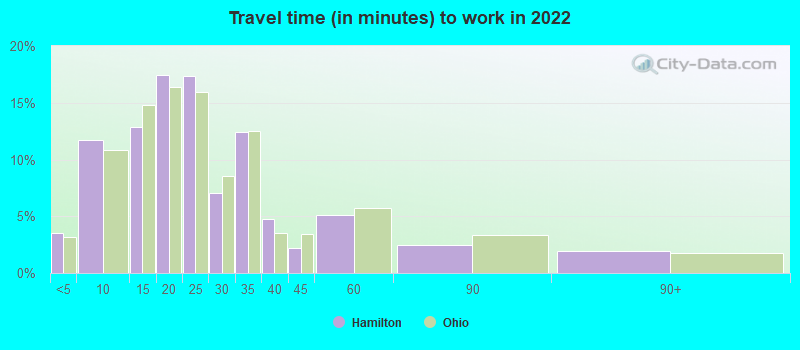
Travel time to work (commute)
- Less than 5 minutes: 827
- 5 to 9 minutes: 2,850
- 10 to 14 minutes: 2,950
- 15 to 19 minutes: 3,276
- 20 to 24 minutes: 4,019
- 25 to 29 minutes: 2,342
- 30 to 34 minutes: 3,522
- 35 to 39 minutes: 1,064
- 40 to 44 minutes: 947
- 45 to 59 minutes: 1,851
- 60 to 89 minutes: 871
- 90 or more minutes: 242
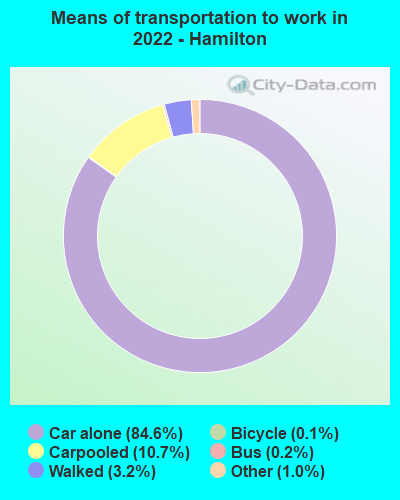
Means of transportation to work:
- Drove a car alone: 19,368 (74.9%)
- Carpooled: 2,688 (10.4%)
- Bus: 44 (0.2%)
- Taxi: 491 (1.9%)
- Bicycle: 33 (0.1%)
- Walked: 738 (2.9%)
- Worked at home: 2,151 (8.3%)

- Unemployment by race in 2022
- Unemployment rate for White non-Hispanic residents
- 3.0%Males
- 5.6%Females
- Unemployment rate for Black residents
- 10.8%Males
- 7.9%Females
- Unemployment rate for other race residents
- 3.4%Males
- 5.4%Females
- Unemployment rate for two or more race residents
- 2.7%Males
- 1.4%Females
- Unemployment rate for Hispanic or Latino residents
- 16.4%Males
- 3.4%Females

- Year of entry for the foreign-born population in Hamilton, Ohio
- 1,0822010 or later
- 8702000 to 2009
- 7901990 to 1999
- 3101980 to 1989
- 531970 to 1979
- 230Before 1970

First ancestries reported:
- German: 6,440 (21.4%)
- American: 3,051 (10.1%)
- English: 2,448 (8.1%)
- Irish: 1,791 (6.0%)
- Italian: 520 (1.7%)
- European: 410 (1.4%)
- French: 408 (1.4%)
- Scottish: 347 (1.2%)
- Polish: 243 (0.8%)
- African: 219 (0.7%)
- Scotch-Irish: 157 (0.5%)
- Northern European: 108 (0.4%)
- Welsh: 99 (0.3%)
- Jamaican: 96 (0.3%)
- Dutch: 84 (0.3%)
- Hungarian: 77 (0.3%)
- Armenian: 70 (0.2%)
- British: 66 (0.2%)
- Swedish: 57 (0.2%)
- Ghanaian: 50 (0.2%)
- Haitian: 40 (0.1%)
- Finnish: 35 (0.1%)
- Danish: 33 (0.1%)
- Swiss: 32 (0.1%)
- Canadian: 25 (0.08%)
- Slovak: 22 (0.07%)
- Czech: 20 (0.07%)
- Russian: 18 (0.06%)
- Greek: 17 (0.06%)
- French Canadian: 17 (0.06%)
- Nigerian: 12 (0.04%)
- Icelander: 12 (0.04%)
- Czechoslovakian: 8 (0.03%)
- Brazilian: 6 (0.02%)
- Portuguese: 6 (0.02%)
- Slavic: 6 (0.02%)
- Croatian: 5 (0.02%)
Most common places of birth for foreign-born residents (%):
| Hamilton: | 50.5% (1,553) |
| Ohio: | 7.8% (44,796) |
| Hamilton: | 8.6% (264) |
| Ohio: | 1.1% (6,549) |
| Hamilton: | 4.4% (135) |
| Ohio: | 0.1% (488) |
| Hamilton: | 4.2% (128) |
| Ohio: | 3.1% (17,818) |
| Hamilton: | 4.0% (123) |
| Ohio: | 1.4% (7,947) |
| Hamilton: | 4.0% (123) |
| Ohio: | 1.0% (5,553) |
| Hamilton: | 3.1% (96) |
| Ohio: | 1.6% (9,312) |
| Hamilton: | 2.4% (73) |
| Ohio: | 1.8% (10,561) |
| Hamilton: | 2.2% (68) |
| Ohio: | 0.4% (2,031) |
| Hamilton: | 2.0% (62) |
| Ohio: | 1.4% (8,101) |
Place of birth for U.S.-born residents:
- This state: 49,131
- Other state: 10,491
- Northeast: 1,303
- Midwest: 2,371
- South: 5,787
- West: 940
86.2% of Hamilton residents lived in the same house 1 years ago.
Out of people who lived in different houses, 37.5% lived in this county.
Out of people who lived in different counties, 75.8% lived in Ohio.
| Hamilton: | 86.2% |
| State average: | 87.8% |
Education attainment for males 25 years and older:
- No schooling: 358
- Nursery to 4th grade: 120
- 5th and 6th grade: 703
- 7th and 8th grade: 242
- 9th grade: 459
- 10th grade: 422
- 11th grade: 334
- 12th grade, no diploma: 691
- High school graduate (or equivalency): 8,201
- Less than 1 year of college: 1,719
- Some college more than 1 year, no degree: 1,910
- Associate degree: 1,599
- Bachelor's degree: 2,203
- Master's degree: 428
- Professional school degree: 189
- Doctorate degree: 82

Education attainment for females 25 years and older:
- No schooling: 299
- Nursery to 4th grade: 44
- 5th and 6th grade: 210
- 7th and 8th grade: 290
- 9th grade: 315
- 10th grade: 380
- 11th grade: 459
- 12th grade, no diploma: 755
- High school graduate (or equivalency): 8,963
- Less than 1 year of college: 2,070
- Some college more than 1 year, no degree: 2,374
- Associate degree: 1,932
- Bachelor's degree: 2,430
- Master's degree: 932
- Professional school degree: 73
- Doctorate degree: 78


Housing units in structures:
- One, detached: 19,395
- One, attached: 1,032
- Two: 1,315
- 3 or 4: 1,605
- 5 to 9: 715
- 10 to 19: 1,496
- 20 to 49: 731
- 50 or more: 787
- Mobile homes: 231
Median worth of mobile homes: $8,254
Housing units lacking complete kitchen facilities in 2022: 2.6%
House/condo owner moved in on average 11 years ago
Renter moved in on average 4 years ago

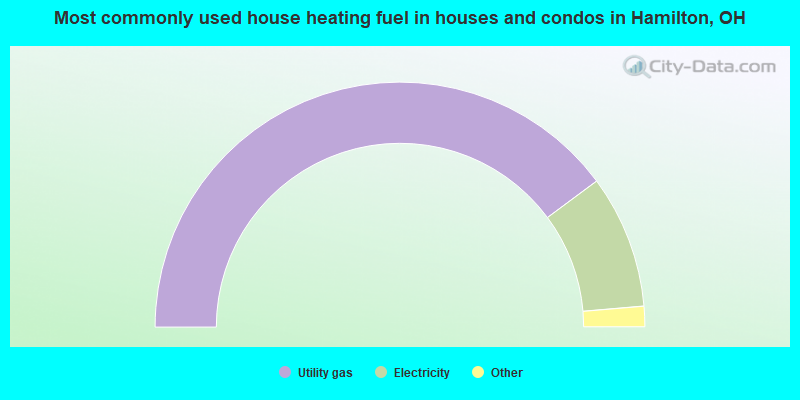
- 79.7%Utility gas
- 17.6%Electricity
- 1.2%Fuel oil, kerosene, etc.
- 0.6%Bottled, tank, or LP gas
- 0.4%No fuel used
- 0.3%Wood
- 0.2%Other fuel
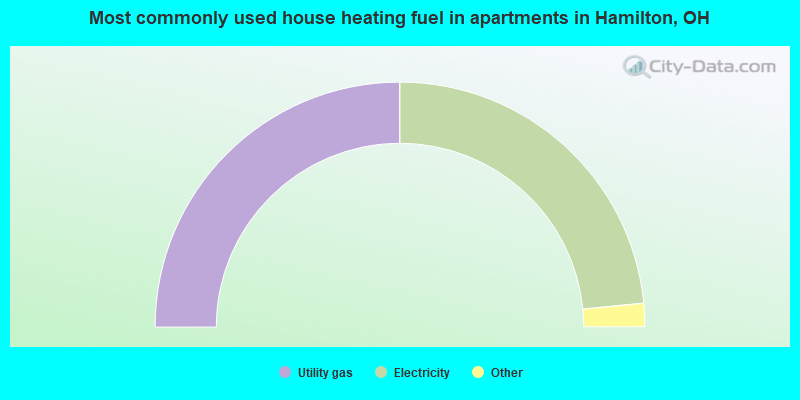
- 50.0%Utility gas
- 46.9%Electricity
- 1.0%Other fuel
- 1.0%Bottled, tank, or LP gas
- 0.7%Fuel oil, kerosene, etc.
- 0.3%No fuel used
Private vs. public school enrollment:
| Here: | 10.9% |
| Ohio: | 16.0% |
| Here: | 6.8% |
| Ohio: | 13.1% |
| Here: | 12.2% |
| Ohio: | 22.3% |


