Hampton Bays, NY (New York) Houses and Residents
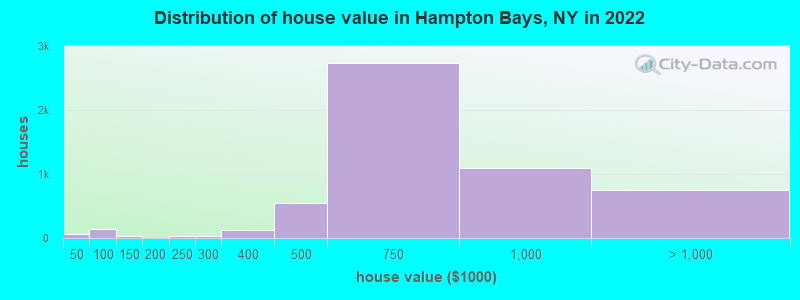
Estimated median house or condo value in 2022: $722,597 (it was $177,600 in 2000 )
Hampton Bays:
$722,597New York:
$400,400
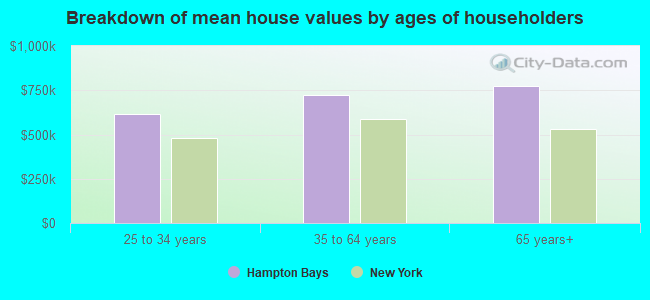
Lower value quartile - upper value quartile: $560,401 - $874,636Mean price in 2022: Detached houses: $743,169 Here:
$743,169State:
$476,719
Townhouses or other attached units: $244,894 Here:
$244,894State:
$699,270
In 2-unit structures: $700,757 Here:
$700,757State:
$713,077
In 5-or-more-unit structures: $452,800 Here:
$452,800State:
$912,009
Mobile homes: $161,715 Here:
$161,715State:
$88,925
Total population: 13,603 (Urban population: 11,895, Rural population: 316 (all nonfarm) )
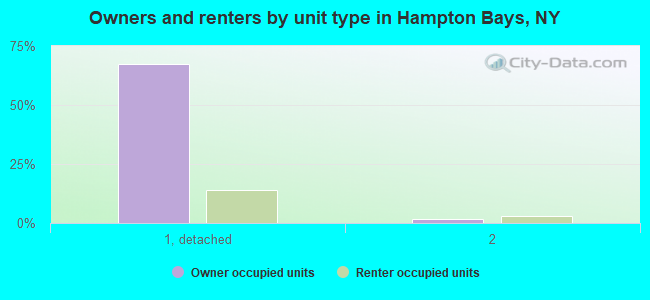
Houses: 9,006 (6,344 occupied: 4,945 owner occupied, 1,396 renter occupied )
% of renters here:
22%State:
46%
Housing density: 748 houses/condos per square mile
Median price asked for vacant for-sale houses and condos in 2022: $733,553.
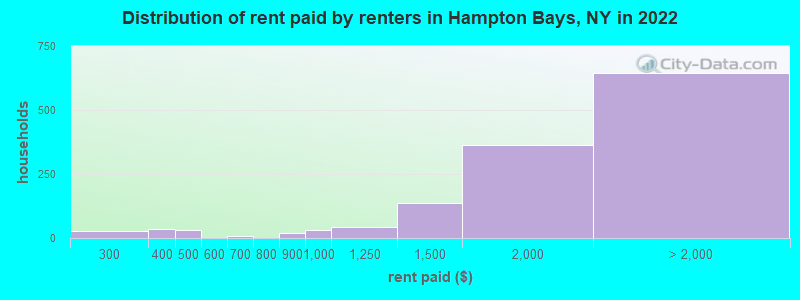
Median contract rent in 2022: $1,920 (lower quartile is $1,401, upper quartile is over $2,000)
Median rent asked for vacant for-rent units in 2022: $1,861
Median gross rent in Hampton Bays, NY in 2022: over $2,000
Housing units in Hampton Bays with a mortgage: 2,838 (330 second mortgage, 12 home equity loan, 309 both second mortgage and home equity loan )Houses without a mortgage: 92
Median household income for houses/condos with a mortgage: $140,380
Median household income for apartments without a mortgage: $98,944
Median monthly housing costs: $2,210
Data:
Median house or condo value ($)
Median house or condo value ($ change since 2000)
Median house or condo value ($) - White
Median house or condo value ($) - Black or African American
Median house or condo value ($) - Asian
Median house or condo value ($) - Hispanic or Latino
Median house or condo value ($) - American Indian and Alaska Native
Median house or condo value ($) - Multirace
Median house or condo value ($) - Other Race
Median price asked for mobile homes ($)
Household density (households per square mile)
Mean house or condo value by units in structure - 1, detached ($)
Mean house or condo value by units in structure - 1, attached ($)
Mean house or condo value by units in structure - 2 ($)
Mean house or condo value by units in structure by units in structure - 3 or 4 ($)
Mean house or condo value by units in structure - 5 or more ($)
Mean house or condo value by units in structure - Boat, RV, van, etc. ($)
Mean house or condo value by units in structure - Mobile home ($)
Median contract rent ($)
Median contract rent - Lower quartile ($)
Median contract rent - Upper quartile ($)
Median gross rent ($)
Urban houses (%)
Rural houses (%)
Houses occupied (%)
Houses occupied (% change since 2000)
Houses owner occupied (%)
Houses owner occupied (% change since 2000)
Houses renter occupied (%)
Houses renter occupied (% change since 2000)
Vacant housing units - For rent (%)
Vacant housing units - For rent (% change since 2000)
Vacant housing units - For sale only (%)
Vacant housing units - For sale only (% change since 2000)
Vacant housing units - Rented or sold, not occupied (%)
Vacant housing units - Rented or sold, not occupied (% change since 2000)
Vacant housing units - For seasonal, recreational, or occasional use (%)
Vacant housing units - For seasonal, recreational, or occasional use (% change since 2000)
Vacant housing units - For migrant workers (%)
Vacant housing units - For migrant workers (% change since 2000)
Vacant housing units - Other vacant (%)
Vacant housing units - Other vacant (% change since 2000)
Median monthly housing costs ($)
Median household income for houses/condos with a mortgage ($)
Median household income for houses/condos without a mortgage ($)
Median household income ($)
Median household income ($) - White
Median household income ($) - Black or African American
Median household income ($) - Asian
Median household income ($) - Hispanic or Latino
Median household income ($) - American Indian and Alaska Native
Median household income ($) - Multirace
Median household income ($) - Other Race
Mortgage status - with mortgage (%)
Mortgage status - with second mortgage (%)
Mortgage status - with home equity loan (%)
Mortgage status - with both second mortgage and home equity loan (%)
Mortgage status - without a mortgage (%)
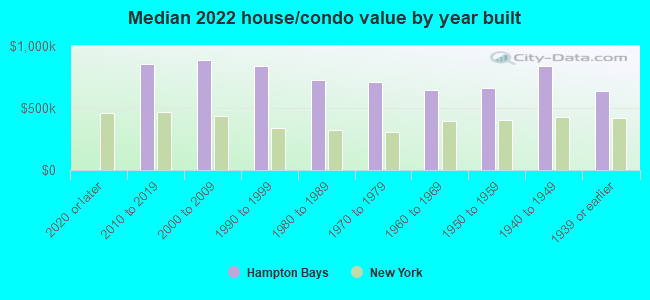
Median year house/condo built
Median year apartment built
Household type by relationship - Male householder living alone (%)
Household type by relationship - Male householder not living alone (%)
Household type by relationship - Female householder living alone (%)
Household type by relationship - Female householder not living alone (%)
Household type by relationship - Opposite-Sex spouse (%)
Household type by relationship - Same-Sex spouse (%)
Household type by relationship - Opposite-Sex unmarried partner (%)
Household type by relationship - Same-Sex unmarried partner (%)
Household type by relationship - In group quarters (%)
Size of family households - 2-person household (%)
Size of family households - 3-person household (%)
Size of family households - 4-person household (%)
Size of family households - 5-person household (%)
Size of family households - 6-person household (%)
Size of family households - 7-or-more-person household (%)
Size of nonfamily households - 1-person household (%)
Size of nonfamily households - 2-person household (%)
Size of nonfamily households - 3-person household (%)
Size of nonfamily households - 4-person household (%)
Size of nonfamily households - 5-person household (%)
Size of nonfamily households - 6-person household (%)
Size of nonfamily households - 7-or-moreperson household (%)
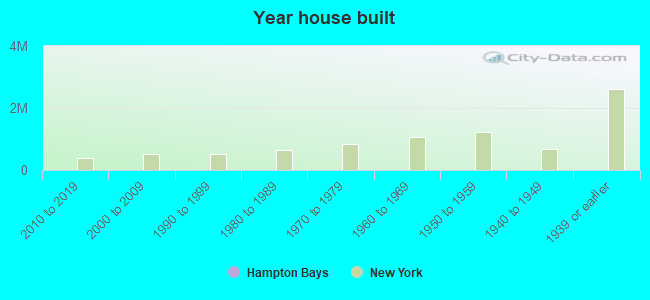
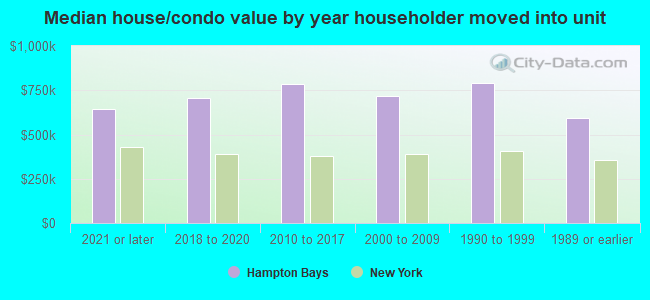
Year house built - Built 2010 or later (%)
Year house built - Built 2000 to 2009 (%)
Year house built - Built 1990 to 1999 (%)
Year house built - Built 1980 to 1989 (%)
Year house built - Built 1970 to 1979 (%)
Year house built - Built 1960 to 1969 (%)
Year house built - Built 1950 to 1959 (%)
Year house built - Built 1940 to 1949 (%)
Year house built - Built 1939 or earlier (%)
Median number of rooms in houses and condos
Median number of rooms in apartments
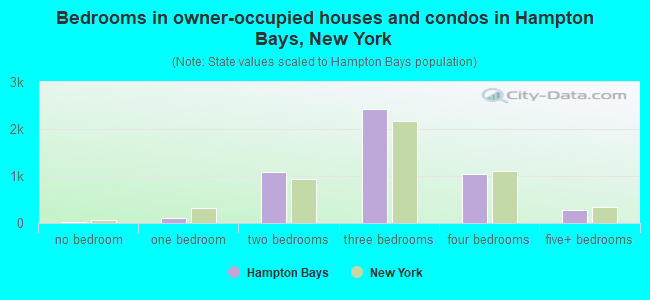
Median number of bedrooms in owner occupied houses
Mean number of bedrooms in owner occupied houses
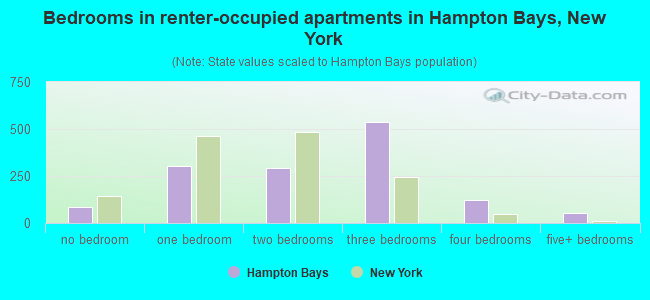
Median number of bedrooms in renter occupied houses
Mean number of bedrooms in renter occupied houses
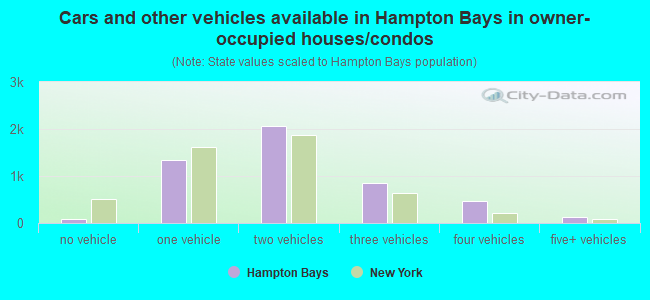
Median number of vehichles in owner occupied houses
Mean number of vehichles in owner occupied houses
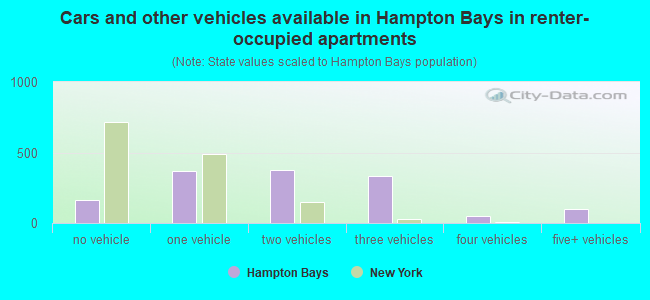
Median number of vehichles in renter occupied houses
Mean number of vehichles in renter occupied houses
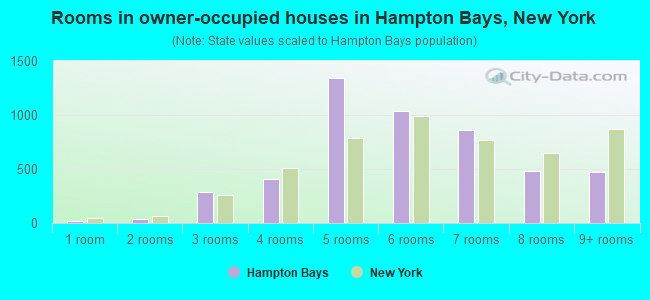
Rooms in owner-occupied houses - 1 room (%)
Rooms in owner-occupied houses - 2 rooms (%)
Rooms in owner-occupied houses - 3 rooms (%)
Rooms in owner-occupied houses - 4 rooms (%)
Rooms in owner-occupied houses - 5 rooms (%)
Rooms in owner-occupied houses - 6 rooms (%)
Rooms in owner-occupied houses - 7 rooms (%)
Rooms in owner-occupied houses - 8 rooms (%)
Rooms in owner-occupied houses - 9+ rooms (%)
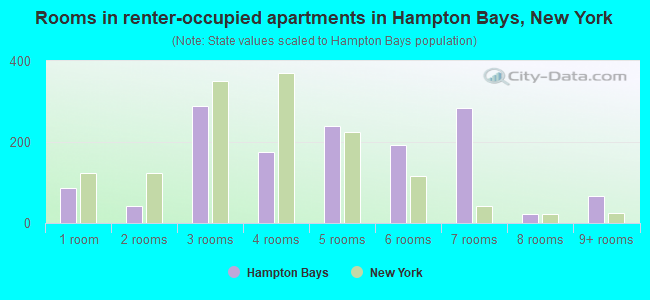
Rooms in renter-occupied houses - 1 room (%)
Rooms in renter-occupied houses - 2 rooms (%)
Rooms in renter-occupied houses - 3 rooms (%)
Rooms in renter-occupied houses - 4 rooms (%)
Rooms in renter-occupied houses - 5 rooms (%)
Rooms in renter-occupied houses - 6 rooms (%)
Rooms in renter-occupied houses - 7 rooms (%)
Rooms in renter-occupied houses - 8 rooms (%)
Rooms in renter-occupied houses - 9+ rooms (%)
Bedrooms in owner-occupied houses - no bedrooms (%)
Bedrooms in owner-occupied houses - 1 bedroom (%)
Bedrooms in owner-occupied houses - 2 bedrooms (%)
Bedrooms in owner-occupied houses - 3 bedrooms (%)
Bedrooms in owner-occupied houses - 4 bedrooms (%)
Bedrooms in owner-occupied houses - 5+ bedrooms (%)
Bedrooms in renter-occupied houses - no bedrooms (%)
Bedrooms in renter-occupied houses - 1 bedroom (%)
Bedrooms in renter-occupied houses - 2 bedrooms (%)
Bedrooms in renter-occupied houses - 3 bedrooms (%)
Bedrooms in renter-occupied houses - 4 bedrooms (%)
Bedrooms in renter-occupied houses - 5+ bedrooms (%)
Vehicles available in owner-occupied houses - no vehicle available (%)
Vehicles available in owner-occupied houses - 1 vehicle available(%)
Vehicles available in owner-occupied houses - 2 Vehicles available (%)
Vehicles available in owner-occupied houses - 3 Vehicles available (%)
Vehicles available in owner-occupied houses - 4 Vehicles available (%)
Vehicles available in owner-occupied houses - 5+ Vehicles available (%)
Vehicles available in renter-occupied houses - no vehicle available (%)
Vehicles available in renter-occupied houses - 1 vehicle available (%)
Vehicles available in renter-occupied houses - 2 Vehicles available (%)
Vehicles available in renter-occupied houses - 3 Vehicles available (%)
Vehicles available in renter-occupied houses - 4 Vehicles available (%)
Vehicles available in renter-occupied houses - 5+ Vehicles available (%)
Housing units in structures - 1, detached (%)
Housing units in structures - 1, attached (%)
Housing units in structures - 2 (%)
Housing units in structures - 3 or 4 (%)
Housing units in structures - 5 to 9 (%)
Housing units in structures - 10 to 19 (%)
Housing units in structures - 20 to 49 (%)
Housing units in structures - 50 or more (%)
Housing units in structures - Mobile home (%)
Housing units in structures - Boat, RV, van, etc. (%)
Housing units in structures - Owners - 1, detached (%)
Housing units in structures - Owners - 1, attached (%)
Housing units in structures - Owners - 2 (%)
Housing units in structures - Owners - 3 or 4 (%)
Housing units in structures - Owners - 5 to 9 (%)
Housing units in structures - Owners - 10 to 19 (%)
Housing units in structures - Owners - 20 to 49 (%)
Housing units in structures - Owners - 50 or more (%)
Housing units in structures - Owners - Mobile home (%)
Housing units in structures - Owners - Boat, RV, van, etc. (%)
Housing units in structures - Renters - 1, detached (%)
Housing units in structures - Renters - 1, attached (%)
Housing units in structures - Renters - 2 (%)
Housing units in structures - Renters - 3 or 4 (%)
Housing units in structures - Renters - 5 to 9 (%)
Housing units in structures - Renters - 10 to 19 (%)
Housing units in structures - Renters - 20 to 49 (%)
Housing units in structures - Renters - 50 or more (%)
Housing units in structures - Renters - Mobile home (%)
Housing units in structures - Renters - Boat, RV, van, etc. (%)
House/condo owner moved in on average (years ago)
Renter moved in on average (years ago)
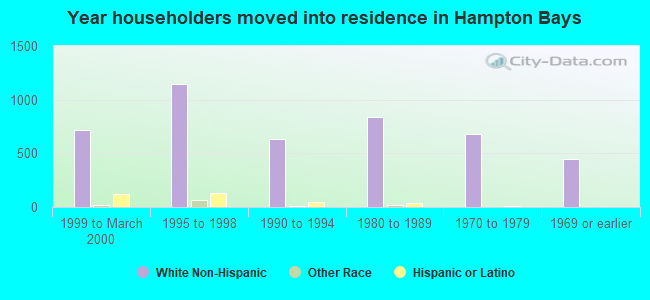
Year householder moved into unit - Moved in 1999 to March 2000 (%)
Year householder moved into unit - Moved in 1999 to March 2000 (%) - White
Year householder moved into unit - Moved in 1999 to March 2000 (%) - Black or African American
Year householder moved into unit - Moved in 1999 to March 2000 (%) - Asian
Year householder moved into unit - Moved in 1999 to March 2000 (%) - Hispanic or Latino
Year householder moved into unit - Moved in 1999 to March 2000 (%) - American Indian and Alaska Native
Year householder moved into unit - Moved in 1999 to March 2000 (%) - Multirace
Year householder moved into unit - Moved in 1999 to March 2000 (%) - Other Race
Year householder moved into unit - Moved in 1995 to 1998 (%)
Year householder moved into unit - Moved in 1995 to 1998 (%) - White
Year householder moved into unit - Moved in 1995 to 1998 (%) - Black or African American
Year householder moved into unit - Moved in 1995 to 1998 (%) - Asian
Year householder moved into unit - Moved in 1995 to 1998 (%) - Hispanic or Latino
Year householder moved into unit - Moved in 1995 to 1998 (%) - American Indian and Alaska Native
Year householder moved into unit - Moved in 1995 to 1998 (%) - Multirace
Year householder moved into unit - Moved in 1995 to 1998 (%) - Other Race
Year householder moved into unit - Moved in 1990 to 1994 (%)
Year householder moved into unit - Moved in 1990 to 1994 (%) - White
Year householder moved into unit - Moved in 1990 to 1994 (%) - Black or African American
Year householder moved into unit - Moved in 1990 to 1994 (%) - Asian
Year householder moved into unit - Moved in 1990 to 1994 (%) - Hispanic or Latino
Year householder moved into unit - Moved in 1990 to 1994 (%) - American Indian and Alaska Native
Year householder moved into unit - Moved in 1990 to 1994 (%) - Multirace
Year householder moved into unit - Moved in 1990 to 1994 (%) - Other Race
Year householder moved into unit - Moved in 1980 to 1989 (%)
Year householder moved into unit - Moved in 1980 to 1989 (%) - White
Year householder moved into unit - Moved in 1980 to 1989 (%) - Black or African American
Year householder moved into unit - Moved in 1980 to 1989 (%) - Asian
Year householder moved into unit - Moved in 1980 to 1989 (%) - Hispanic or Latino
Year householder moved into unit - Moved in 1980 to 1989 (%) - American Indian and Alaska Native
Year householder moved into unit - Moved in 1980 to 1989 (%) - Multirace
Year householder moved into unit - Moved in 1980 to 1989 (%) - Other Race
Year householder moved into unit - Moved in 1970 to 1979 (%)
Year householder moved into unit - Moved in 1970 to 1979 (%) - White
Year householder moved into unit - Moved in 1970 to 1979 (%) - Black or African American
Year householder moved into unit - Moved in 1970 to 1979 (%) - Asian
Year householder moved into unit - Moved in 1970 to 1979 (%) - Hispanic or Latino
Year householder moved into unit - Moved in 1970 to 1979 (%) - American Indian and Alaska Native
Year householder moved into unit - Moved in 1970 to 1979 (%) - Multirace
Year householder moved into unit - Moved in 1970 to 1979 (%) - Other Race
Year householder moved into unit - Moved in 1969 or earlier (%)
Year householder moved into unit - Moved in 1969 or earlier (%) - White
Year householder moved into unit - Moved in 1969 or earlier (%) - Black or African American
Year householder moved into unit - Moved in 1969 or earlier (%) - Asian
Year householder moved into unit - Moved in 1969 or earlier (%) - Hispanic or Latino
Year householder moved into unit - Moved in 1969 or earlier (%) - American Indian and Alaska Native
Year householder moved into unit - Moved in 1969 or earlier (%) - Multirace
Year householder moved into unit - Moved in 1969 or earlier (%) - Other Race
Housing units lacking complete plumbing facilities (%)
Housing units lacking complete kitchen facilities (%)
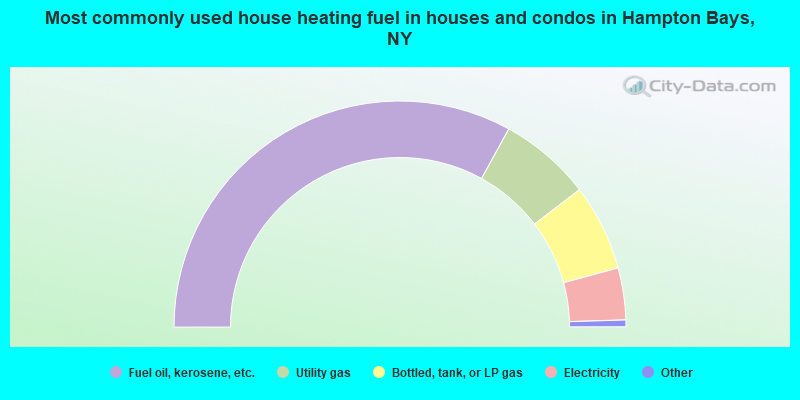
House heating fuel used in houses and condos - Utility gas (%)
House heating fuel used in houses and condos - Bottled, tank, or LP gas (%)
House heating fuel used in houses and condos - Electricity (%)
House heating fuel used in houses and condos - Fuel oil, kerosene, etc. (%)
House heating fuel used in houses and condos - Coal or coke (%)
House heating fuel used in houses and condos - Wood (%)
House heating fuel used in houses and condos - Solar energy (%)
House heating fuel used in houses and condos - Other fuel (%)
House heating fuel used in houses and condos - No fuel used (%)
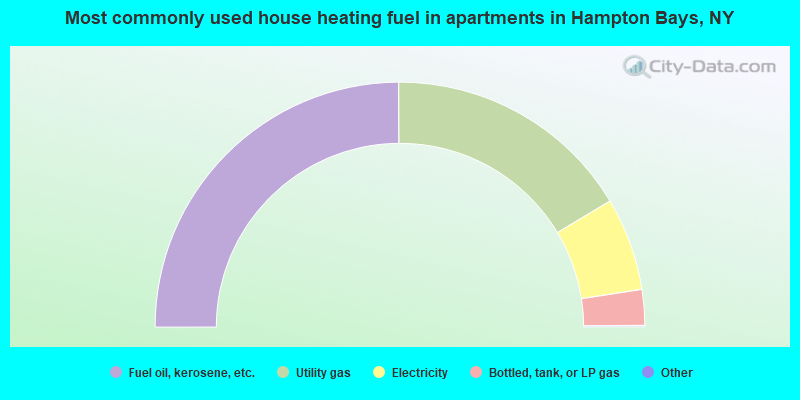
House heating fuel used in apartments - Utility gas (%)
House heating fuel used in apartments - Bottled, tank, or LP gas (%)
House heating fuel used in apartments - Electricity (%)
House heating fuel used in apartments - Fuel oil, kerosene, etc. (%)
House heating fuel used in apartments - Coal or coke (%)
House heating fuel used in apartments - Wood (%)
House heating fuel used in apartments - Solar energy (%)
House heating fuel used in apartments - Other fuel (%)
House heating fuel used in apartments - No fuel used (%)
Median year house/condo built: 1973Median year apartment built: 1970Household type by relationship:
Households: 16,949
Male householders: 3,309 (614 living alone ), Female householders: 3,020 (1,012 living alone )3,357 spouses (3,290 opposite-sex spouses ), 458 unmarried partners , (458 opposite-sex unmarried partners ), 5,015 children (4,531 natural , 13 adopted , 470 stepchildren ), 198 grandchildren , 178 brothers or sisters , 390 parents , 0 foster children , 241 other relatives , 658 non-relatives In group quarters: 123
Size of family households: 1,820 2-persons , 1,130 3-persons , 965 4-persons , 333 5-persons , 124 6-persons , 73 7-or-more-persons .
Size of nonfamily households: 1,639 1-person , 242 2-persons , 32 4-persons .
1,992 married couples with children. single-parent households (364 men , 588 women ).
63.5% of residents of Hampton Bays speak English at home. of residents speak Spanish at home (35% speak English very well , 37% speak English well , 14% speak English not well , 14% don't speak English at all ).of residents speak other Indo-European language at home (76% speak English very well , 16% speak English well , 3% speak English not well , 5% don't speak English at all ).of residents speak Asian or Pacific Island language at home (41% speak English very well , 10% speak English well , 49% speak English not well ).of residents speak other language at home (100% speak English very well ).
Foreign born population: 5,093 (30.0%)of them are naturalized citizens )
Median number of rooms in houses and condos:
Median number of rooms in apartments
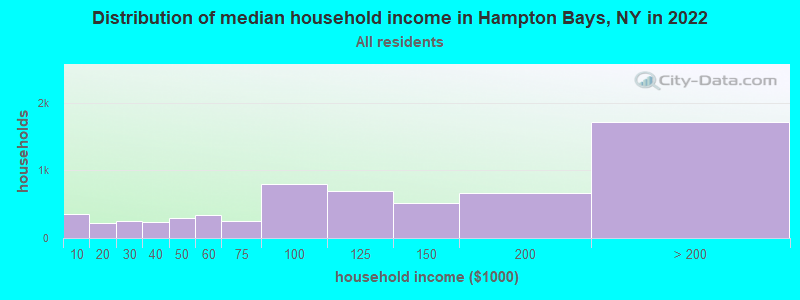
Hampton Bays, NY household income distribution 355 Less than $10,000217 $10,000 to $19,999258 $20,000 to $29,999233 $30,000 to $39,999292 $40,000 to $49,999341 $50,000 to $59,999250 $60,000 to $74,999796 $75,000 to $99,999697 $100,000 to $124,999515 $125,000 to $149,999667 $150,000 to $199,9991,713 $200,000 or more
Home value of owner - occupied houses in 2022 in Hampton Bays, NY 67 Less than $10,00066 $50,000 to $59,99915 $60,000 to $69,99936 $70,000 to $79,99925 $80,000 to $89,99923 $100,000 to $124,99913 $125,000 to $149,99929 $200,000 to $249,99935 $250,000 to $299,999123 $300,000 to $399,999546 $400,000 to $499,9992,741 $500,000 to $749,9991,085 $750,000 to $999,999442 $1,000,000 to $1,499,999131 $1,500,000 to $1,999,999173 $2,000,000 or moreRent paid by renters in 2022 in Hampton Bays, NY 28 $200 to $24916 $300 to $34919 $350 to $39933 $400 to $4497 $650 to $69920 $800 to $89930 $900 to $99942 $1,000 to $1,249136 $1,250 to $1,499361 $1,500 to $1,999282 $2,000 to $2,499261 $2,500 to $2,99943 $3,000 to $3,49910 $3,500 or more46 No cash rent
Percentage of workers working in this county: 88.1%Number of people working at home: 849 (10.2% of all workers )
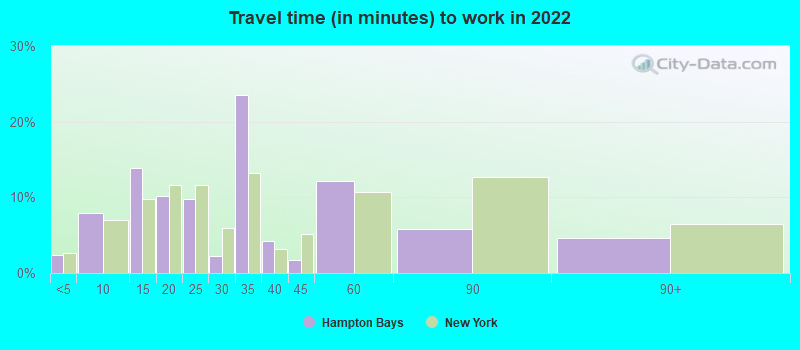
Travel time to work (commute)
Less than 5 minutes: 2695 to 9 minutes: 46810 to 14 minutes: 55215 to 19 minutes: 40620 to 24 minutes: 1,24725 to 29 minutes: 33330 to 34 minutes: 69335 to 39 minutes: 35740 to 44 minutes: 41545 to 59 minutes: 1,14060 to 89 minutes: 1,05990 or more minutes: 502
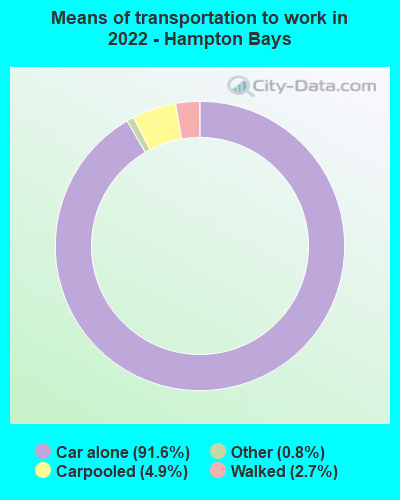
Means of transportation to work:
Drove a car alone: 3,634 (75.2%)Carpooled: 222 (4.6%)Taxi: 38 (0.8%)Walked: 113 (2.3%)Worked at home: 849 (17.6%)
Unemployment by race in 2022
Unemployment rate for White non-Hispanic residents 2.8% Males1.6% FemalesUnemployment rate for Black residents 40.8% MalesUnemployment rate for Asian residents 13.6% FemalesUnemployment rate for other race residents 3.7% Males9.2% FemalesUnemployment rate for two or more race residents 6.2% MalesUnemployment rate for Hispanic or Latino residents 3.2% Males3.2% Females
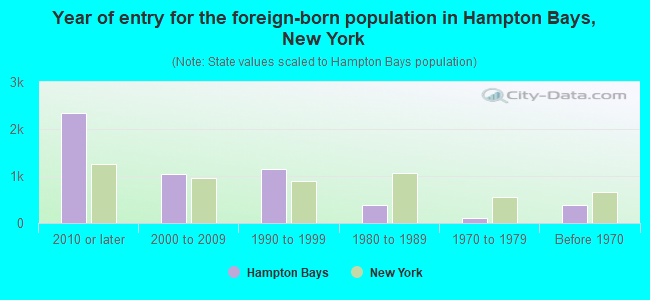
Year of entry for the foreign-born population in Hampton Bays, New York
2,345 2010 or later 1,035 2000 to 2009 1,142 1990 to 1999 373 1980 to 1989 97 1970 to 1979 387 Before 1970
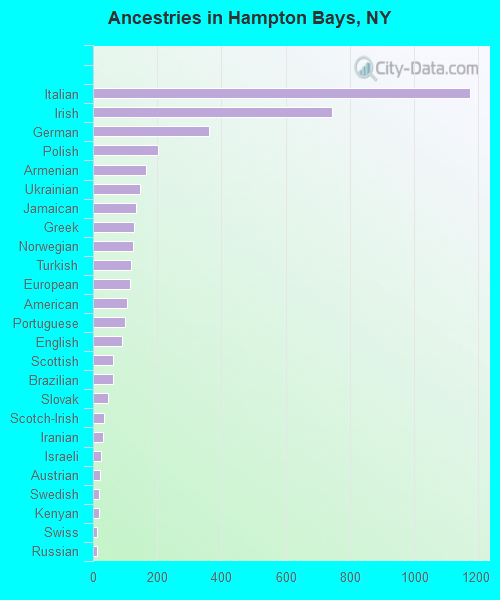
First ancestries reported:
Italian: 1,174 (16.1%)
Irish: 744 (10.2%)
German: 360 (4.9%)
Polish: 203 (2.8%)
Armenian: 164 (2.2%)
Ukrainian: 146 (2.0%)
Jamaican: 135 (1.8%)
Greek: 128 (1.8%)
Norwegian: 123 (1.7%)
Turkish: 118 (1.6%)
European: 115 (1.6%)
American: 106 (1.5%)
Portuguese: 101 (1.4%)
English: 91 (1.2%)
Scottish: 63 (0.9%)
Brazilian: 61 (0.8%)
Slovak: 48 (0.7%)
Scotch-Irish: 34 (0.5%)
Iranian: 30 (0.4%)
Israeli: 24 (0.3%)
Austrian: 22 (0.3%)
Swedish: 20 (0.3%)
Kenyan: 18 (0.2%)
Swiss: 14 (0.2%)
Russian: 13 (0.2%)
Celtic: 12 (0.2%)
Icelander: 10 (0.1%)
Eastern European: 9 (0.1%)
Romanian: 9 (0.1%)
Croatian: 8 (0.1%)
Danish: 7 (0.10%)
Haitian: 1 (0.01%) Most common places of birth for foreign-born residents (%): Colombia Hampton Bays:
37.9% (1,783)New York:
2.5% (111,920)
Mexico Hampton Bays:
12.9% (607)New York:
4.8% (214,559)
Ecuador Hampton Bays:
9.9% (467)New York:
3.9% (177,448)
Costa Rica Hampton Bays:
9.6% (451)New York:
0.2% (7,345)
Guatemala Hampton Bays:
5.5% (260)New York:
1.4% (61,245)
Honduras Hampton Bays:
5.4% (253)New York:
1.2% (55,571)
Brazil Hampton Bays:
2.4% (114)New York:
0.7% (30,658)
China, excluding Hong Kong and Taiwan Hampton Bays:
2.1% (97)New York:
9.1% (410,910)
El Salvador Hampton Bays:
1.8% (85)New York:
2.4% (108,067)
Italy Hampton Bays:
1.8% (83)New York:
1.8% (81,374)
Venezuela Hampton Bays:
1.7% (80)New York:
0.4% (19,652)
Place of birth for U.S.-born residents:
This state: 10,428Other state: 1,455Northeast: 592Midwest: 261South: 306West: 319 89.1% of Hampton Bays residents lived in the same house 1 years ago.
Out of people who lived in different houses, 40.0% lived in this county.
Out of people who lived in different counties, 58.8% lived in New York.
Hampton Bays:
89.1%State average:
89.6%
Education attainment for males 25 years and older:
No schooling: 172Nursery to 4th grade: 165th and 6th grade: 3407th and 8th grade: 299th grade: 10910th grade: 2311th grade: 2612th grade, no diploma: 109High school graduate (or equivalency): 1,373Less than 1 year of college: 307Some college more than 1 year, no degree: 822Associate degree: 378Bachelor's degree: 1,359Master's degree: 679Professional school degree: 195Doctorate degree: 44
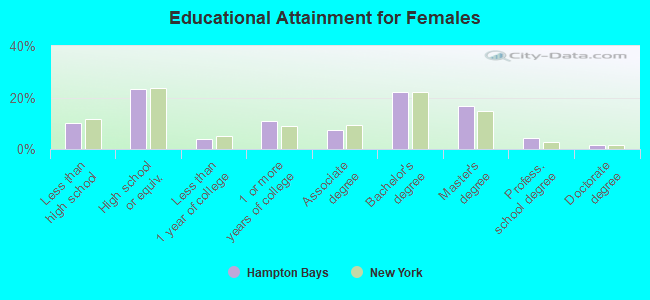
Education attainment for females 25 years and older:
No schooling: 94Nursery to 4th grade: 655th and 6th grade: 1547th and 8th grade: 09th grade: 5110th grade: 011th grade: 14412th grade, no diploma: 117High school graduate (or equivalency): 1,418Less than 1 year of college: 248Some college more than 1 year, no degree: 659Associate degree: 449Bachelor's degree: 1,344Master's degree: 1,020Professional school degree: 249Doctorate degree: 86
Housing units in structures:
One, detached: 8,063One, attached: 16Two: 1783 or 4: 935 to 9: 10010 to 19: 31820 to 49: 2250 or more: 78Mobile homes: 135Housing units lacking complete plumbing facilities in 2022: 0.2%Housing units lacking complete kitchen facilities in 2022: 0.3%House/condo owner moved in on average 14 years ago
Renter moved in on average 6 years ago
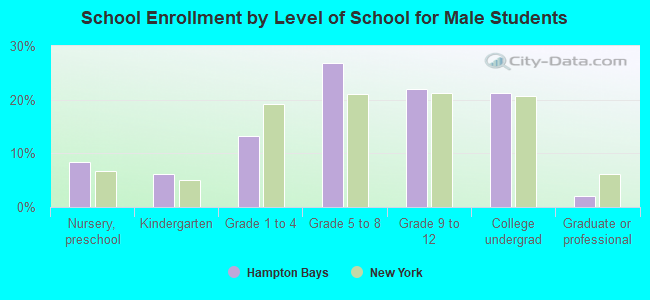
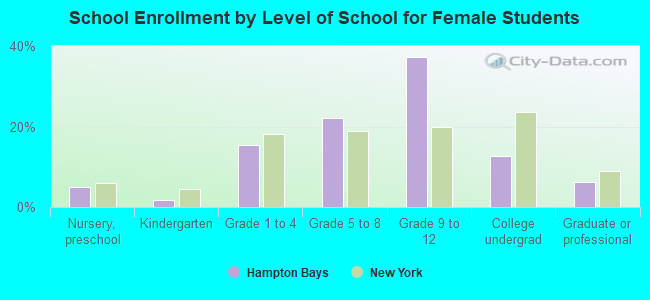
Private vs. public school enrollment:
Students in private schools in grades 1 to 8 (elementary and middle school): 165 Students in private schools in grades 9 to 12 (high school): 109 Students in private undergraduate colleges: 105