Hampton Falls, NH (New Hampshire) Houses and Residents
| Hampton Falls: | $832,037 |
| New Hampshire: | $384,700 |
Total population: 2,236 (Urban population: 259, Rural population: 1,621 (29 farm, 1,592 nonfarm))
Houses: 729 (704 occupied: 629 owner occupied, 75 renter occupied)
| % of renters here: | 11% |
| State: | 28% |
Housing density: 60 houses/condos per square mile
Median price asked for vacant for-sale houses and condos in 2022 in this county: $227,726.
Median contract rent in 2022: $1,607 (lower quartile is $1,290, upper quartile is over $2,000)
Median gross rent in Hampton Falls, NH in 2022: $1,798
Housing units in Hampton Falls with a mortgage: 395 (28 second mortgage, 51 home equity loan, 0 both second mortgage and home equity loan)
Houses without a mortgage: 121
Compare current foreclosures near Hampton Falls, NH:
| Photo | Address | Area | Beds / Baths | Price | Details |
|---|---|---|---|---|---|

|
#1
Lafayette Rd # 11
Hampton Falls, NH 03844
|
- sq. feet
|
- baths - beds |
show details | |

|
#2
Brentwood Rd
Exeter, NH 03833
|
2,756 sq. feet
|
2 baths 3 beds |
$419,900
|
show details |

|
#3
Main St
Fremont, NH 03044
|
1,470 sq. feet
|
2 baths 4 beds |
$306,800
|
show details |

|
#4
Cedar St # A
Haverhill, MA 01830
|
1,134 sq. feet
|
2 baths 2 beds |
$209,300
|
show details |

|
#5
Main St # 2
Haverhill, MA 01830
|
772 sq. feet
|
1 baths 1 beds |
show details | |

|
#6
Ccc Rd
Salisbury, MA 01952
|
2,016 sq. feet
|
3 baths 3 beds |
show details | |

|
#7
Sanborn Rd
East Kingston, NH 03827
|
3,002 sq. feet
|
2 baths 3 beds |
show details | |

|
#8
Main St
Plaistow, NH 03865
|
1,177 sq. feet
|
1 baths 3 beds |
show details | |

|
#9
Louise Ln
Fremont, NH 03044
|
1,960 sq. feet
|
2 baths 3 beds |
show details | |

|
#10
Golden Hill Ave
Haverhill, MA 01830
|
2,016 sq. feet
|
1 baths 2 beds |
show details |
| Photo | Address | Area | Beds / Baths | Price | Details |
|---|---|---|---|---|---|

|
#11
Rosemary Ln
Eliot, ME 03903
|
1,173 sq. feet
|
1 baths 4 beds |
show details | |

|
#12
Brook Meadow Ln
Georgetown, MA 01833
|
2,147 sq. feet
|
3 baths 3 beds |
show details | |

|
#13
Water St
Haverhill, MA 01830
|
1,516 sq. feet
|
3 baths 3 beds |
show details | |

|
#14
Mount Vernon St
Haverhill, MA 01830
|
4,046 sq. feet
|
4 baths 6 beds |
show details | |

|
#15
N End Blvd
Salisbury, MA 01952
|
2,816 sq. feet
|
4 baths 10 beds |
show details | |

|
#16
Boush St
Kittery, ME 03904
|
1,448 sq. feet
|
2 baths 4 beds |
show details | |

|
#17
Acorn St
Haverhill, MA 01832
|
896 sq. feet
|
2 baths 2 beds |
show details | |

|
#18
S Lincoln St
Haverhill, MA 01835
|
2,700 sq. feet
|
2 baths 8 beds |
show details | |

|
#19
River St
Haverhill, MA 01832
|
2,876 sq. feet
|
4 baths 8 beds |
show details | |

|
#20
Silver St
Haverhill, MA 01832
|
2,248 sq. feet
|
1 baths 2 beds |
show details |
| Photo | Address | Area | Beds / Baths | Price | Details |
|---|---|---|---|---|---|

|
#21
Steeplechase Ct
Haverhill, MA 01832
|
1,442 sq. feet
|
2 baths 2 beds |
show details | |

|
#22
Lawrence Rd Apt 22
Rowley, MA 01969
|
720 sq. feet
|
1 baths 1 beds |
show details | |

|
#23
State Rd
Eliot, ME 03903
|
1,694 sq. feet
|
2 baths 4 beds |
show details | |

|
#24
Glen Ridge Rd
Raymond, NH 03077
|
1,828 sq. feet
|
2 baths 3 beds |
show details | |

|
#25
Lincoln Ave
Salisbury, MA 01952
|
1,120 sq. feet
|
1 baths 2 beds |
show details | |

|
#26
Mill River Ln
Rowley, MA 01969
|
2,705 sq. feet
|
2 baths 4 beds |
show details | |

|
#27
Brown Ave # 2-52
Amesbury, MA 01913
|
638 sq. feet
|
1 baths 1 beds |
show details | |

|
#28
Pike St
Salisbury, MA 01952
|
1,808 sq. feet
|
1 baths 3 beds |
show details | |

|
#29
Millyard Unit 204
Amesbury, MA 01913
|
715 sq. feet
|
1 baths 1 beds |
show details | |

|
#30
Elm St
Amesbury, MA 01913
|
1,608 sq. feet
|
2 baths 4 beds |
show details |
| Photo | Address | Area | Beds / Baths | Price | Details |
|---|---|---|---|---|---|

|
#31
Upland Ave
Haverhill, MA 01835
|
1,753 sq. feet
|
2 baths 3 beds |
show details | |

|
#32
Dearborn Rd
Epping, NH 03042
|
1,768 sq. feet
|
2 baths 3 beds |
show details | |

|
#33
15th Ave
Haverhill, MA 01830
|
1,320 sq. feet
|
1 baths 3 beds |
show details | |

|
#34
Center St
Groveland, MA 01834
|
1,923 sq. feet
|
2 baths 2 beds |
show details | |

|
#35
Sheridan St
Haverhill, MA 01830
|
1,365 sq. feet
|
1 baths 4 beds |
show details | |

|
#36
Lake St
Amesbury, MA 01913
|
2,650 sq. feet
|
2 baths 4 beds |
show details | |

|
#37
Old Ferry Rd
Haverhill, MA 01830
|
2,099 sq. feet
|
2 baths 4 beds |
show details | |

|
#38
Byron St
Haverhill, MA 01835
|
2,446 sq. feet
|
1 baths 4 beds |
show details | |

|
#39
Byfield Rd
Groveland, MA 01834
|
1,488 sq. feet
|
2 baths 3 beds |
show details | |

|
#40
Webster St
Haverhill, MA 01830
|
1,887 sq. feet
|
2 baths 3 beds |
show details |
| Photo | Address | Area | Beds / Baths | Price | Details |
|---|---|---|---|---|---|

|
#41
Washington St
Haverhill, MA 01832
|
3,162 sq. feet
|
5 baths 5 beds |
show details | |

|
#42
Regent Ave
Haverhill, MA 01835
|
1,232 sq. feet
|
1 baths 3 beds |
show details | |

|
#43
Alder St
Exeter, NH 03833
|
952 sq. feet
|
2 baths 2 beds |
show details | |

|
#44
Overlook Cir
Haverhill, MA 01835
|
2,744 sq. feet
|
2 baths 4 beds |
show details | |

|
#45
Plum St
Exeter, NH 03833
|
924 sq. feet
|
1 baths 3 beds |
show details | |

|
#46
Coates Ln
Haverhill, MA 01835
|
1,969 sq. feet
|
2 baths 3 beds |
show details | |

|
#47
Baldwin St
Haverhill, MA 01832
|
2,504 sq. feet
|
2 baths 6 beds |
show details | |

|
#48
Bailey Ln
Georgetown, MA 01833
|
2,743 sq. feet
|
2 baths 4 beds |
show details | |

|
#49
Main St
Haverhill, MA 01830
|
707 sq. feet
|
1 baths 2 beds |
show details | |

|
Check over 1 million property listings on Foreclosure.com!
|
browse all offers | |||

 | Tiny house living - legally difficult in New Hampshire (12 replies) |
| Move to NH - Suggested Areas & Towns? (108 replies) |
| Around 95 up to Portsmouth - Looking to buy a house in good school district 475k (11 replies) |
| Moving to southeast NH, looking for suggestions (22 replies) |
| Seacoast- In Depth (26 replies) |
| Coastal area living (27 replies) |

Household type by relationship:
Households: 292,725- In family households: 247,693 (57,848 male householders, 21,984 female householders)
64,858 spouses, 85,601 children (80,134 natural, 2,077 adopted, 3,390 stepchildren), 3,954 grandchildren, 1,562 brothers or sisters, 2,352 parents, foster children, 1,664 other relatives, 5,842 non-relatives
- In nonfamily households: 45,032 (17,024 male householders (12,402 living alone)), 18,177 female householders (14,574 living alone)), 9,831 nonrelatives
- In group quarters: 2,498 (1,438 institutionalized population)
57,723 married couples with children.
11,266 single-parent households (3,032 men, 8,234 women).
95.3% of residents of Hampton Falls speak English at home.
1.2% of residents speak Spanish at home (90% speak English very well, 10% speak English not well).
2.9% of residents speak other Indo-European language at home (66% speak English very well, 14% speak English well, 20% speak English not well).
0.6% of residents speak Asian or Pacific Island language at home (40% speak English very well, 60% speak English well).
0.1% of residents speak other language at home (100% speak English very well).
Foreign born population: 75 (3.5%)
(62.7% of them are naturalized citizens)
| Here: | 7.6 |
| State: | 6.4 |
| Here: | 3.8 |
| State: | 4.0 |

- Bedrooms in owner-occupied houses and condos in Hampton Falls, New Hampshire
- 0no bedroom
- 121 bedroom
- 862 bedrooms
- 2473 bedrooms
- 2244 bedrooms
- 605+ bedrooms

- Bedrooms in renter-occupied apartments in Hampton Falls, New Hampshire
- 2no bedroom
- 151 bedroom
- 272 bedrooms
- 103 bedrooms
- 124 bedrooms
- 95+ bedrooms

- Cars and other vehicles available in Hampton Falls in owner-occupied houses/condos
- 10no vehicle
- 791 vehicle
- 3672 vehicles
- 1353 vehicles
- 294 vehicles
- 95+ vehicles

- Cars and other vehicles available in Hampton Falls in renter-occupied apartments
- 2no vehicle
- 331 vehicle
- 332 vehicles
- 33 vehicles
- 24 vehicles
- 25+ vehicles

- Rooms in owner-occupied houses in Hampton Falls, New Hampshire
- 01 room
- 02 rooms
- 103 rooms
- 144 rooms
- 405 rooms
- 1146 rooms
- 1437 rooms
- 1208 rooms
- 1889+ rooms

- Rooms in renter-occupied apartments in Hampton Falls, New Hampshire
- 21 room
- 92 rooms
- 53 rooms
- 204 rooms
- 85 rooms
- 66 rooms
- 47 rooms
- 118 rooms
- 109+ rooms


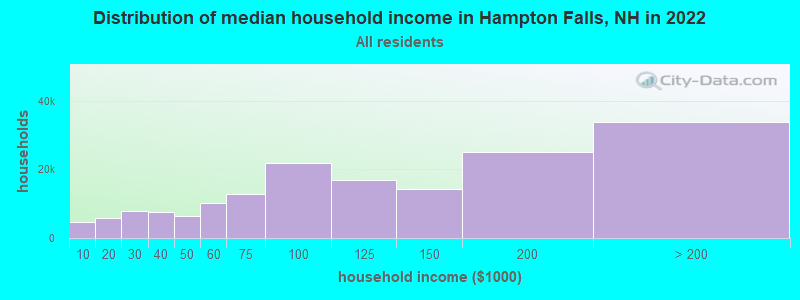
Hampton Falls, NH household income distribution

- 4,658Less than $10,000
- 5,730$10,000 to $19,999
- 7,989$20,000 to $29,999
- 7,515$30,000 to $39,999
- 6,398$40,000 to $49,999
- 10,287$50,000 to $59,999
- 12,891$60,000 to $74,999
- 21,717$75,000 to $99,999
- 16,772$100,000 to $124,999
- 14,257$125,000 to $149,999
- 25,101$150,000 to $199,999
- 33,810$200,000 or more
Percentage of workers working in this county: 75.4%
Number of people working at home: 236 (20.6% of all workers)
Travel time to work (commute)
- Less than 5 minutes: 19
- 5 to 9 minutes: 120
- 10 to 14 minutes: 162
- 15 to 19 minutes: 127
- 20 to 24 minutes: 91
- 25 to 29 minutes: 28
- 30 to 34 minutes: 74
- 35 to 39 minutes: 22
- 40 to 44 minutes: 45
- 45 to 59 minutes: 84
- 60 to 89 minutes: 62
- 90 or more minutes: 53
Means of transportation to work:
- Drove a car alone: 816 (83.4%)
- Carpooled: 48 (4.9%)
- Bus or trolley bus: 7 (0.7%)
- Railroad: 2 (0.2%)
- Walked: 9 (0.9%)
- Other means: 5 (0.5%)
- Worked at home: 92 (9.4%)


- Year of entry for the foreign-born population in Hampton Falls, New Hampshire
- 141995 to March 2000
- 61990 to 1994
- 61985 to 1989
- 81980 to 1984
- 21975 to 1979
- 11970 to 1974
- 41965 to 1969
- 5Before 1965
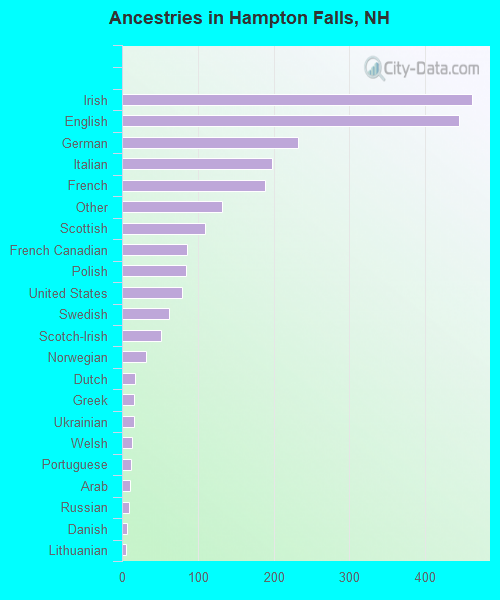
First ancestries reported:
- Irish: 461 (20.3%)
- English: 444 (19.5%)
- German: 232 (10.2%)
- Italian: 198 (8.7%)
- French: 188 (8.3%)
- Other: 132 (5.8%)
- Scottish: 109 (4.8%)
- French Canadian: 86 (3.8%)
- Polish: 85 (3.7%)
- United States: 79 (3.5%)
- Swedish: 62 (2.7%)
- Scotch-Irish: 51 (2.2%)
- Norwegian: 32 (1.4%)
- Dutch: 17 (0.7%)
- Greek: 16 (0.7%)
- Ukrainian: 16 (0.7%)
- Welsh: 13 (0.6%)
- Portuguese: 12 (0.5%)
- Arab: 10 (0.4%)
- Russian: 9 (0.4%)
- Danish: 6 (0.3%)
- Lithuanian: 5 (0.2%)
- Czech: 4 (0.2%)
- Hungarian: 2 (0.09%)
- Subsaharan African: 2 (0.09%)
- West Indian: 2 (0.09%)
Most common places of birth for foreign-born residents (%):
| Hampton Falls: | 21.7% (10) |
| New Hampshire: | 1.5% (813) |
| Hampton Falls: | 21.7% (10) |
| New Hampshire: | 2.7% (1,440) |
| Hampton Falls: | 19.6% (9) |
| New Hampshire: | 22.9% (12,397) |
| Hampton Falls: | 8.7% (4) |
| New Hampshire: | 0.7% (401) |
| Hampton Falls: | 8.7% (4) |
| New Hampshire: | 4.7% (2,530) |
| Hampton Falls: | 4.3% (2) |
| New Hampshire: | 2.9% (1,582) |
| Hampton Falls: | 4.3% (2) |
| New Hampshire: | 2.3% (1,227) |
| Hampton Falls: | 4.3% (2) |
| New Hampshire: | 0.1% (74) |
| Hampton Falls: | 4.3% (2) |
| New Hampshire: | 0.3% (160) |
Place of birth for U.S.-born residents:
- This state: 557
- Other state: 1,258
- Northeast: 1,052
- Midwest: 85
- South: 99
- West: 22
68% of Hampton Falls residents lived in the same house 5 years ago.
Out of people who lived in different houses, 51% lived in this county.
Out of people who lived in different counties, 15% lived in New Hampshire.
Education attainment for males 25 years and older:
- No schooling: 0
- Nursery to 4th grade: 0
- 5th and 6th grade: 0
- 7th and 8th grade: 6
- 9th grade: 3
- 10th grade: 14
- 11th grade: 2
- 12th grade, no diploma: 13
- High school graduate (or equivalency): 108
- Less than 1 year of college: 31
- Some college more than 1 year, no degree: 73
- Associate degree: 50
- Bachelor's degree: 230
- Master's degree: 73
- Professional school degree: 37
- Doctorate degree: 9

Education attainment for females 25 years and older:
- No schooling: 0
- Nursery to 4th grade: 0
- 5th and 6th grade: 0
- 7th and 8th grade: 3
- 9th grade: 0
- 10th grade: 3
- 11th grade: 5
- 12th grade, no diploma: 11
- High school graduate (or equivalency): 130
- Less than 1 year of college: 60
- Some college more than 1 year, no degree: 70
- Associate degree: 80
- Bachelor's degree: 220
- Master's degree: 76
- Professional school degree: 11
- Doctorate degree: 2


Housing units in structures:
- One, detached: 665
- One, attached: 32
- Two: 14
- 3 or 4: 4
- 5 to 9: 4
- Mobile homes: 10
Median worth of mobile homes: $213,920

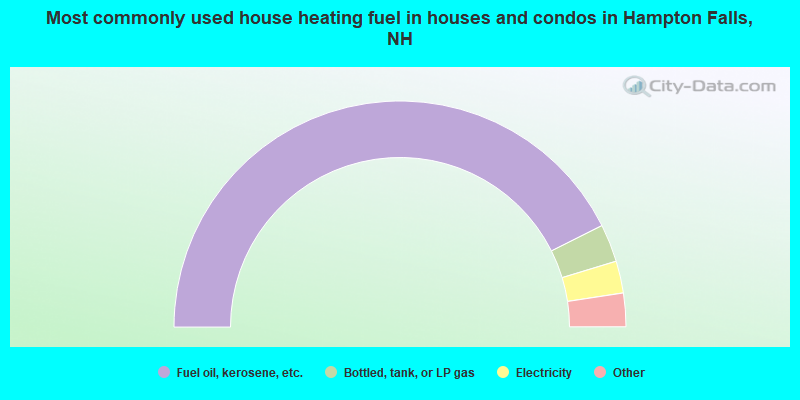
- 85.2%Fuel oil, kerosene, etc.
- 5.4%Bottled, tank, or LP gas
- 4.6%Electricity
- 3.0%Wood
- 0.8%Utility gas
- 0.6%Other fuel
- 0.3%Coal or coke
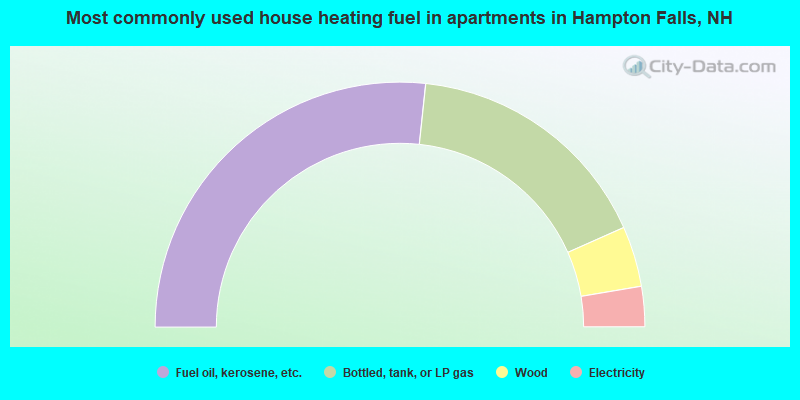
- 53.3%Fuel oil, kerosene, etc.
- 33.3%Bottled, tank, or LP gas
- 8.0%Wood
- 5.3%Electricity
Private vs. public school enrollment:
| Here: | 5.7% |
| New Hampshire: | 8.9% |
| Here: | 15.3% |
| New Hampshire: | 10.7% |
| Here: | 28.6% |
| New Hampshire: | 36.4% |


