Hampton, NH (New Hampshire) Houses and Residents
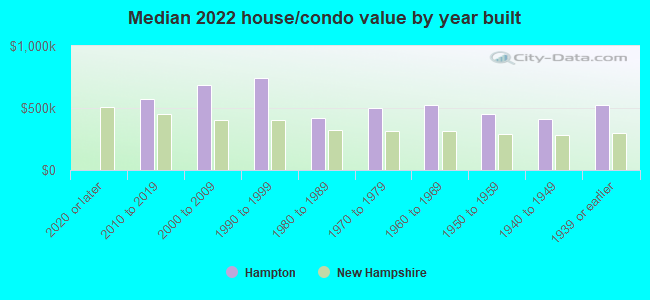
| Hampton: | $518,486 |
| New Hampshire: | $384,700 |
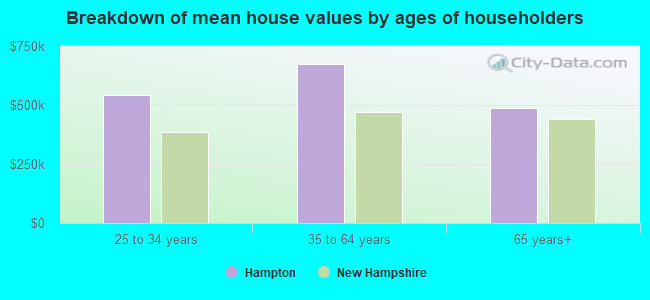
Mean price in 2022:
Detached houses: $572,194
Here: $572,194 State: $491,479 Townhouses or other attached units: $353,961
Here: $353,961 State: $361,001 In 2-unit structures: $436,198
Here: $436,198 State: $368,847 In 3-to-4-unit structures: $427,839
Here: $427,839 State: $575,942 In 5-or-more-unit structures: $357,590
Here: $357,590 State: $274,068
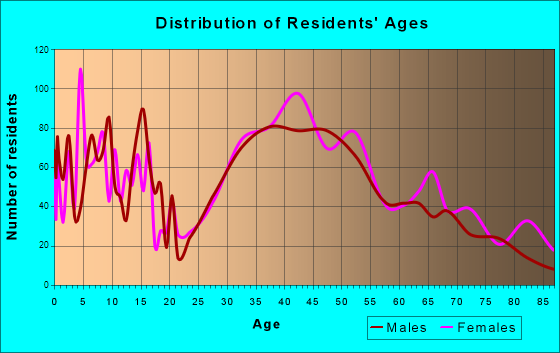
Total population: 9,656 (Urban population: 9,064, Rural population: 0)
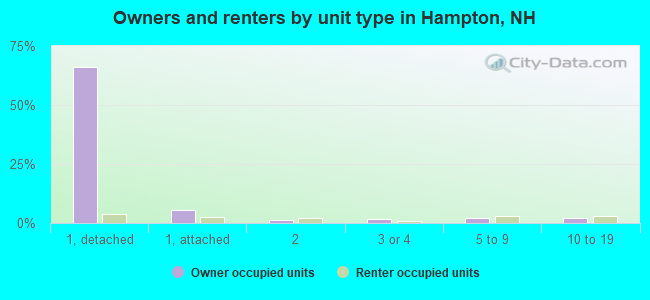
Houses: 4,463 (4,315 occupied: 3,323 owner occupied, 984 renter occupied)
| % of renters here: | 23% |
| State: | 28% |
Housing density: 832 houses/condos per square mile
Median price asked for vacant for-sale houses and condos in 2022 in this county: $227,726.
Median contract rent in 2022: $1,555 (lower quartile is $1,178, upper quartile is $1,964)
Median rent asked for vacant for-rent units in 2022: $1,840
Median gross rent in Hampton, NH in 2022: $1,649
Housing units in Hampton with a mortgage: 2,189 (454 second mortgage, 0 home equity loan, 438 both second mortgage and home equity loan)
Houses without a mortgage: 196
Median household income for houses/condos with a mortgage: $116,575
Median household income for apartments without a mortgage: $91,312
Median monthly housing costs: $1,746
Compare current foreclosures near Hampton, NH:
| Photo | Address | Area | Beds / Baths | Price | Details |
|---|---|---|---|---|---|

|
#1
High St Apt 302
Hampton, NH 03842
|
- sq. feet
|
- baths - beds |
show details | |

|
#2
I St Apt 3
Hampton, NH 03842
|
- sq. feet
|
- baths - beds |
show details | |

|
#3
Drakeside Rd Unit 1302
Hampton, NH 03842
|
- sq. feet
|
- baths - beds |
show details | |

|
#4
Lafayette Rd
Hampton, NH 03842
|
- sq. feet
|
- baths - beds |
show details | |

|
#5
Brentwood Rd
Exeter, NH 03833
|
2,756 sq. feet
|
2 baths 3 beds |
$419,900
|
show details |

|
#6
Woodlawn Cir
Portsmouth, NH 03801
|
1,306 sq. feet
|
2 baths 4 beds |
show details | |

|
#7
Mill River Ln
Rowley, MA 01969
|
2,705 sq. feet
|
2 baths 4 beds |
show details | |

|
#8
High St
Exeter, NH 03833
|
3,075 sq. feet
|
3 baths 4 beds |
show details | |

|
#9
Mechanic St Apt 1
Merrimac, MA 01860
|
1,452 sq. feet
|
1 baths 2 beds |
show details | |

|
#10
Frost Hill Rd, C O Gregory Jackman
Eliot, ME 03903
|
3,472 sq. feet
|
3 baths 4 beds |
show details |
| Photo | Address | Area | Beds / Baths | Price | Details |
|---|---|---|---|---|---|

|
#11
Main St
West Newbury, MA 01985
|
2,934 sq. feet
|
2 baths 5 beds |
show details | |

|
#12
Cedar Point Rd
Durham, NH 03824
|
4,052 sq. feet
|
3 baths 3 beds |
show details | |

|
#13
Wentworth Ter
Dover, NH 03820
|
2,404 sq. feet
|
3 baths 6 beds |
show details | |

|
#14
Langs Ln
Newmarket, NH 03857
|
2,466 sq. feet
|
2 baths 3 beds |
show details | |

|
#15
Piscassic St
Newmarket, NH 03857
|
1,608 sq. feet
|
2 baths 4 beds |
show details | |

|
#16
64th St
Newburyport, MA 01950
|
1,517 sq. feet
|
2 baths 2 beds |
show details | |

|
#17
Kimball Rd
Amesbury, MA 01913
|
1,792 sq. feet
|
1 baths 3 beds |
show details | |

|
#18
Market St
Newburyport, MA 01950
|
1,732 sq. feet
|
2 baths 3 beds |
show details | |

|
#19
Storey Ave Apt 2
Newburyport, MA 01950
|
708 sq. feet
|
1 baths 2 beds |
show details | |

|
#20
Munroe St
Newburyport, MA 01950
|
1,815 sq. feet
|
2 baths 3 beds |
show details |
| Photo | Address | Area | Beds / Baths | Price | Details |
|---|---|---|---|---|---|

|
#21
W Whitehall Rd
Amesbury, MA 01913
|
1,593 sq. feet
|
1 baths 3 beds |
show details | |

|
#22
Windbrook Dr
Epping, NH 03042
|
1,680 sq. feet
|
1 baths 2 beds |
show details | |

|
#23
Middle Rd
Dover, NH 03820
|
1,120 sq. feet
|
1 baths 3 beds |
show details | |

|
#24
Louise Ln
Fremont, NH 03044
|
1,960 sq. feet
|
2 baths 3 beds |
show details | |

|
#25
15th Ave
Haverhill, MA 01830
|
1,320 sq. feet
|
1 baths 3 beds |
show details | |

|
#26
Bunker Hill Rd
Ipswich, MA 01938
|
2,896 sq. feet
|
2 baths 3 beds |
show details | |

|
#27
Came Ave
Haverhill, MA 01830
|
1,890 sq. feet
|
1 baths 3 beds |
show details | |

|
#28
Hazen Ave
Haverhill, MA 01830
|
2,594 sq. feet
|
2 baths 7 beds |
show details | |

|
#29
Primrose St
Haverhill, MA 01830
|
2,680 sq. feet
|
2 baths 4 beds |
show details | |

|
#30
King St
Groveland, MA 01834
|
2,713 sq. feet
|
3 baths 4 beds |
show details |
| Photo | Address | Area | Beds / Baths | Price | Details |
|---|---|---|---|---|---|

|
#31
Kenoza Ave Apt 1
Haverhill, MA 01830
|
750 sq. feet
|
1 baths 2 beds |
show details | |

|
#32
Webster St
Haverhill, MA 01830
|
1,887 sq. feet
|
2 baths 3 beds |
show details | |

|
#33
Back River Rd
Dover, NH 03820
|
1,193 sq. feet
|
1 baths 3 beds |
show details | |

|
#34
Boardman St
Haverhill, MA 01830
|
1,092 sq. feet
|
2 baths 3 beds |
show details | |

|
#35
Blake Rd
Epping, NH 03042
|
3,113 sq. feet
|
2 baths 2 beds |
show details | |

|
#36
Old Ferry Rd
Haverhill, MA 01830
|
2,099 sq. feet
|
2 baths 4 beds |
show details | |

|
#37
Fazio Farm Rd
Georgetown, MA 01833
|
2,420 sq. feet
|
2 baths 4 beds |
show details | |

|
#38
Dearborn Rd
Epping, NH 03042
|
1,768 sq. feet
|
2 baths 3 beds |
show details | |

|
#39
Farnham Rd
Rowley, MA 01969
|
1,106 sq. feet
|
2 baths 3 beds |
show details | |

|
#40
Byfield Rd
Groveland, MA 01834
|
1,488 sq. feet
|
2 baths 3 beds |
show details |
| Photo | Address | Area | Beds / Baths | Price | Details |
|---|---|---|---|---|---|

|
#41
Merrill Ave
Amesbury, MA 01913
|
1,467 sq. feet
|
1 baths 3 beds |
show details | |

|
#42
Knights Ct
Newbury, MA 01951
|
4,057 sq. feet
|
3 baths 5 beds |
show details | |

|
#43
Gove Dr
Newburyport, MA 01950
|
3,044 sq. feet
|
3 baths 3 beds |
show details | |

|
#44
Lake St
Amesbury, MA 01913
|
2,650 sq. feet
|
2 baths 4 beds |
show details | |

|
#45
Adams Park
Rye, NH 03870
|
1,008 sq. feet
|
2 baths 3 beds |
show details | |

|
#46
Del Logan Dr
Salisbury, MA 01952
|
1,986 sq. feet
|
1 baths 3 beds |
show details | |

|
#47
Brown Ave # 52
Amesbury, MA 01913
|
741 sq. feet
|
1 baths 2 beds |
show details | |

|
#48
Elm St
Salisbury, MA 01952
|
1,800 sq. feet
|
2 baths 4 beds |
show details | |

|
#49
Dock Ln
Salisbury, MA 01952
|
1,667 sq. feet
|
2 baths 3 beds |
show details | |

|
Check over 1 million property listings on Foreclosure.com!
|
browse all offers | |||

Latest news about housing in Hampton, NH collected exclusively by city-data.com from local newspapers, TV, and radio stations


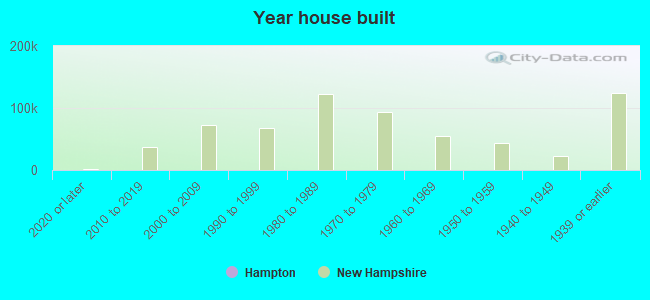
Median year apartment built: 1975
Household type by relationship:
Households: 10,185- Male householders: 1,997 (503 living alone), Female householders: 2,305 (705 living alone)
2,213 spouses (2,162 opposite-sex spouses), 350 unmarried partners, (345 opposite-sex unmarried partners), 2,636 children (2,475 natural, 35 adopted, 124 stepchildren), 53 grandchildren, 26 brothers or sisters, 59 parents, 0 foster children, 128 other relatives, 226 non-relatives
- In group quarters: 187
Size of family households: 1,207 2-persons, 601 3-persons, 679 4-persons, 95 5-persons, 29 6-persons.
Size of nonfamily households: 1,370 1-person, 371 2-persons, 24 4-persons.
1,320 married couples with children.
285 single-parent households (85 men, 200 women).
96.2% of residents of Hampton speak English at home.
0.9% of residents speak Spanish at home (64% speak English very well, 36% speak English well).
1.7% of residents speak other Indo-European language at home (100% speak English very well).
1.1% of residents speak Asian or Pacific Island language at home (73% speak English very well, 27% speak English well).
0.4% of residents speak other language at home (42% speak English very well, 58% speak English well).
Foreign born population: 374 (3.7%)
(82.4% of them are naturalized citizens)
| Here: | 6.5 |
| State: | 6.4 |
| Here: | 3.6 |
| State: | 4.0 |
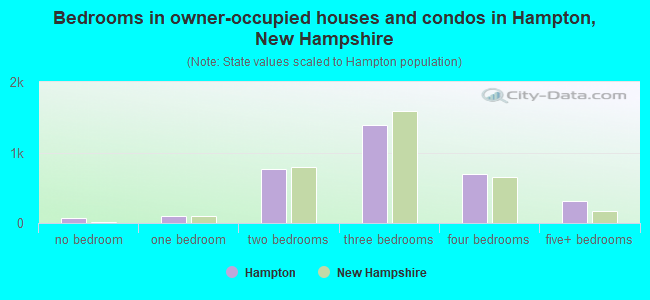
- Bedrooms in owner-occupied houses and condos in Hampton, New Hampshire
- 68no bedroom
- 1011 bedroom
- 7702 bedrooms
- 1,3863 bedrooms
- 6894 bedrooms
- 3095+ bedrooms
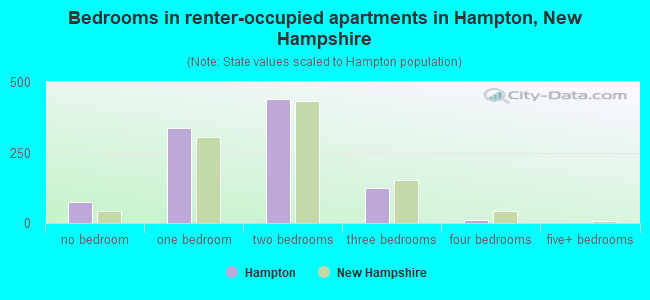
- Bedrooms in renter-occupied apartments in Hampton, New Hampshire
- 73no bedroom
- 3381 bedroom
- 4402 bedrooms
- 1243 bedrooms
- 94 bedrooms
- 05+ bedrooms
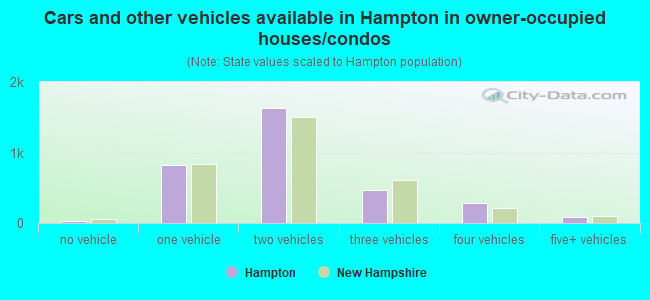
- Cars and other vehicles available in Hampton in owner-occupied houses/condos
- 29no vehicle
- 8261 vehicle
- 1,6372 vehicles
- 4683 vehicles
- 2804 vehicles
- 835+ vehicles
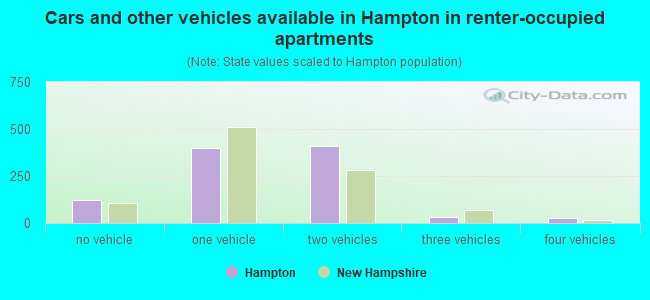
- Cars and other vehicles available in Hampton in renter-occupied apartments
- 122no vehicle
- 3971 vehicle
- 4112 vehicles
- 303 vehicles
- 244 vehicles
- 05+ vehicles
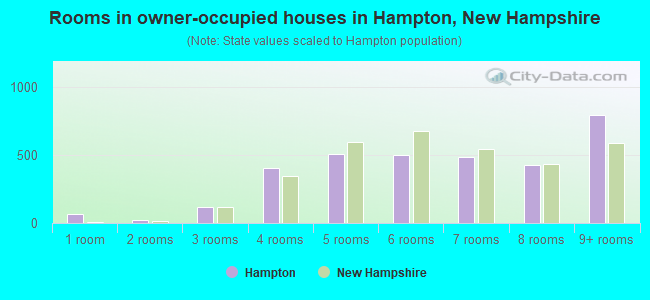
- Rooms in owner-occupied houses in Hampton, New Hampshire
- 681 room
- 212 rooms
- 1203 rooms
- 4074 rooms
- 5075 rooms
- 4996 rooms
- 4827 rooms
- 4268 rooms
- 7939+ rooms
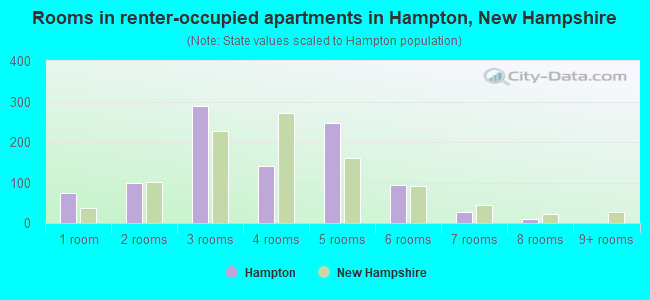
- Rooms in renter-occupied apartments in Hampton, New Hampshire
- 731 room
- 1002 rooms
- 2903 rooms
- 1414 rooms
- 2485 rooms
- 956 rooms
- 277 rooms
- 98 rooms
- 09+ rooms
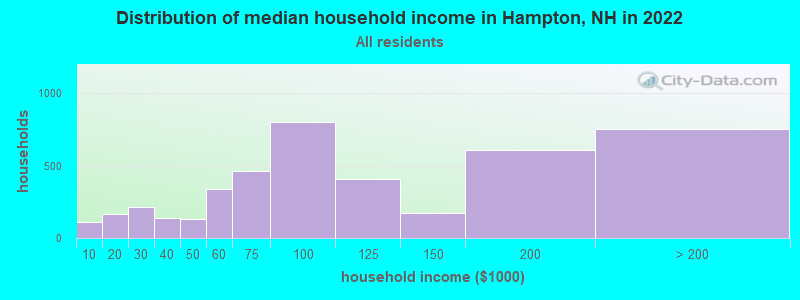
Hampton, NH household income distribution

- 113Less than $10,000
- 164$10,000 to $19,999
- 217$20,000 to $29,999
- 140$30,000 to $39,999
- 134$40,000 to $49,999
- 337$50,000 to $59,999
- 465$60,000 to $74,999
- 802$75,000 to $99,999
- 408$100,000 to $124,999
- 174$125,000 to $149,999
- 607$150,000 to $199,999
- 754$200,000 or more
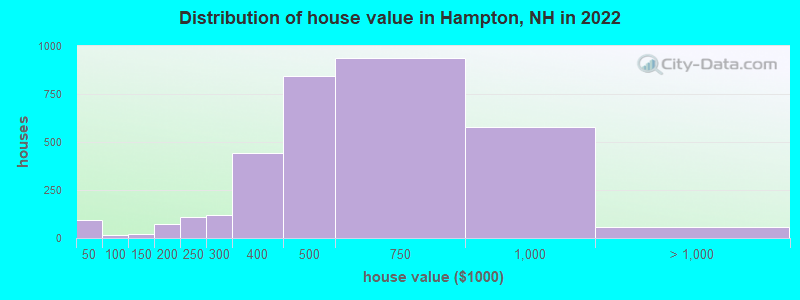
Home value of owner - occupied houses in 2022 in Hampton, NH
-
- 25Less than $10,000
- 35$10,000 to $14,999
- 10$20,000 to $24,999
- 16$25,000 to $29,999
- 5$30,000 to $34,999
- 6$60,000 to $69,999
- 8$80,000 to $89,999
- 12$100,000 to $124,999
- 7$125,000 to $149,999
- 44$150,000 to $174,999
- 30$175,000 to $199,999
- 108$200,000 to $249,999
- 121$250,000 to $299,999
- 444$300,000 to $399,999
- 844$400,000 to $499,999
- 940$500,000 to $749,999
- 579$750,000 to $999,999
- 31$1,000,000 to $1,499,999
- 25$2,000,000 or more
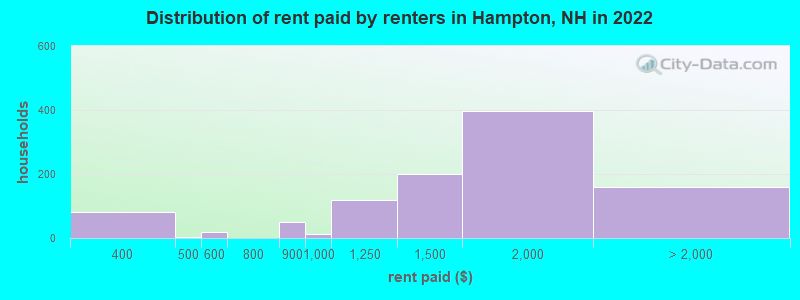
Rent paid by renters in 2022 in Hampton, NH
-
- 59$300 to $349
- 21$350 to $399
- 2$450 to $499
- 18$500 to $549
- 50$800 to $899
- 13$900 to $999
- 118$1,000 to $1,249
- 198$1,250 to $1,499
- 398$1,500 to $1,999
- 110$2,000 to $2,499
- 25$2,500 to $2,999
- 14$3,500 or more
- 7No cash rent
Percentage of workers working in this county: 75.1%
Number of people working at home: 1,319 (24.6% of all workers)
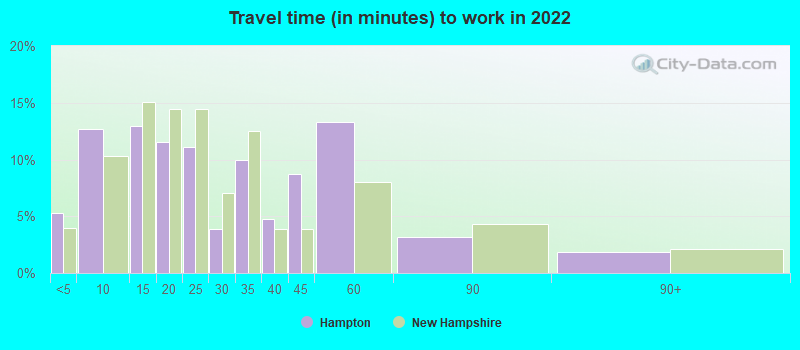
Travel time to work (commute)
- Less than 5 minutes: 257
- 5 to 9 minutes: 488
- 10 to 14 minutes: 498
- 15 to 19 minutes: 604
- 20 to 24 minutes: 638
- 25 to 29 minutes: 370
- 30 to 34 minutes: 480
- 35 to 39 minutes: 236
- 40 to 44 minutes: 41
- 45 to 59 minutes: 203
- 60 to 89 minutes: 195
- 90 or more minutes: 78
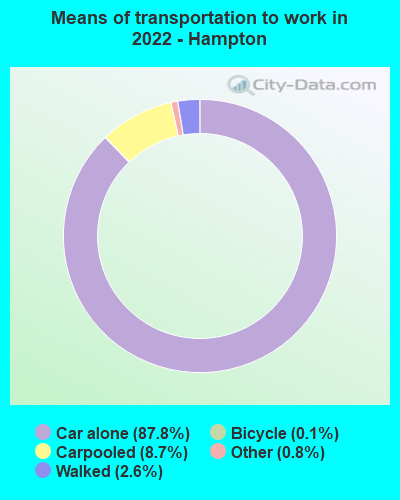
Means of transportation to work:
- Drove a car alone: 3,889 (67.7%)
- Carpooled: 411 (7.2%)
- Taxi: 53 (0.9%)
- Bicycle: 13 (0.2%)
- Walked: 88 (1.5%)
- Worked at home: 1,319 (22.9%)
- Unemployment by race in 2022
- Unemployment rate for White non-Hispanic residents
- 2.1%Males
- 0.3%Females
- Unemployment rate for Asian residents
- 52.1%Females
- Unemployment rate for two or more race residents
- 2.8%Males
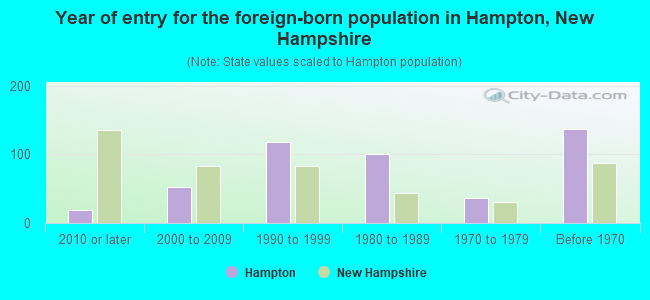
- Year of entry for the foreign-born population in Hampton, New Hampshire
- 192010 or later
- 532000 to 2009
- 1181990 to 1999
- 1001980 to 1989
- 361970 to 1979
- 137Before 1970
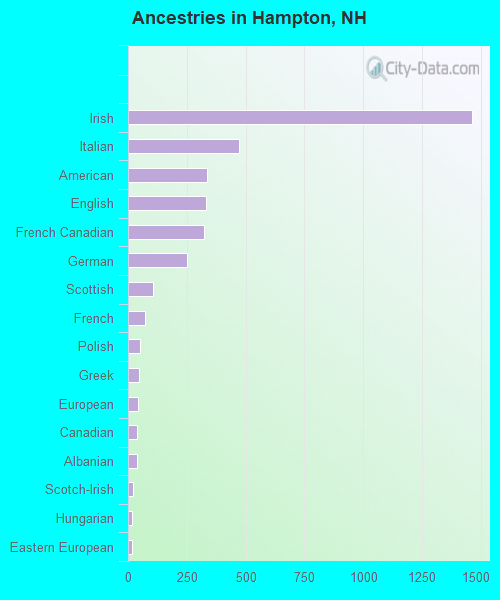
First ancestries reported:
- Irish: 1,463 (34.9%)
- Italian: 471 (11.2%)
- American: 338 (8.1%)
- English: 332 (7.9%)
- French Canadian: 324 (7.7%)
- German: 249 (5.9%)
- Scottish: 105 (2.5%)
- French: 71 (1.7%)
- Polish: 52 (1.2%)
- Greek: 46 (1.1%)
- European: 44 (1.0%)
- Canadian: 40 (1.0%)
- Albanian: 37 (0.9%)
- Scotch-Irish: 20 (0.5%)
- Hungarian: 18 (0.4%)
- Eastern European: 16 (0.4%)
- Lebanese: 13 (0.3%)
- Swedish: 12 (0.3%)
- Finnish: 11 (0.3%)
- Armenian: 10 (0.2%)
- Welsh: 9 (0.2%)
- Czech: 7 (0.2%)
- Norwegian: 7 (0.2%)
- British: 6 (0.1%)
- Russian: 2 (0.05%)
- Nigerian: 1 (0.02%)
Most common places of birth for foreign-born residents (%):
| Hampton: | 20.4% (71) |
| New Hampshire: | 3.3% (2,768) |
| Hampton: | 15.8% (55) |
| New Hampshire: | 0.9% (728) |
| Hampton: | 10.6% (37) |
| New Hampshire: | 2.0% (1,650) |
| Hampton: | 7.5% (26) |
| New Hampshire: | 2.7% (2,211) |
| Hampton: | 6.3% (22) |
| New Hampshire: | 0.8% (661) |
| Hampton: | 6.3% (22) |
| New Hampshire: | 1.0% (861) |
| Hampton: | 5.7% (20) |
| New Hampshire: | 0.4% (332) |
| Hampton: | 3.2% (11) |
| New Hampshire: | 0.6% (527) |
| Hampton: | 3.2% (11) |
| New Hampshire: | 0.9% (729) |
| Hampton: | 2.9% (10) |
| New Hampshire: | 0.9% (743) |
| Hampton: | 2.9% (10) |
| New Hampshire: | 1.3% (1,066) |
| Hampton: | 1.7% (6) |
| New Hampshire: | 0.2% (139) |
| Hampton: | 1.7% (6) |
| New Hampshire: | 0.3% (283) |
Place of birth for U.S.-born residents:
- This state: 3,190
- Other state: 6,572
- Northeast: 5,489
- Midwest: 231
- South: 382
- West: 452
95.4% of Hampton residents lived in the same house 1 years ago.
Out of people who lived in different houses, 22.5% lived in this county.
Out of people who lived in different counties, 28.3% lived in New Hampshire.
| Hampton: | 95.4% |
| State average: | 89.8% |
Education attainment for males 25 years and older:
- No schooling: 0
- Nursery to 4th grade: 0
- 5th and 6th grade: 0
- 7th and 8th grade: 22
- 9th grade: 17
- 10th grade: 145
- 11th grade: 55
- 12th grade, no diploma: 0
- High school graduate (or equivalency): 868
- Less than 1 year of college: 191
- Some college more than 1 year, no degree: 586
- Associate degree: 457
- Bachelor's degree: 1,029
- Master's degree: 475
- Professional school degree: 61
- Doctorate degree: 24

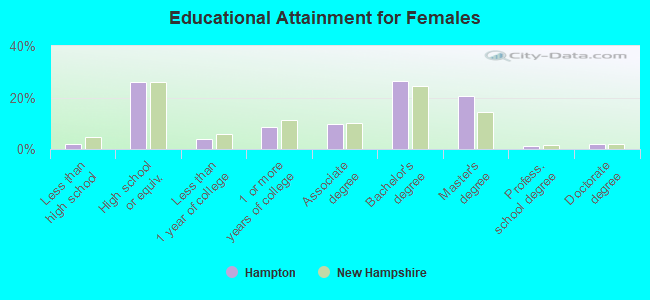
Education attainment for females 25 years and older:
- No schooling: 0
- Nursery to 4th grade: 0
- 5th and 6th grade: 0
- 7th and 8th grade: 0
- 9th grade: 7
- 10th grade: 73
- 11th grade: 7
- 12th grade, no diploma: 0
- High school graduate (or equivalency): 1,071
- Less than 1 year of college: 166
- Some college more than 1 year, no degree: 349
- Associate degree: 394
- Bachelor's degree: 1,097
- Master's degree: 845
- Professional school degree: 42
- Doctorate degree: 76
Housing units in structures:
- One, detached: 2,760
- One, attached: 414
- Two: 244
- 3 or 4: 258
- 5 to 9: 170
- 10 to 19: 300
- 20 to 49: 243
- 50 or more: 24
- Mobile homes: 45
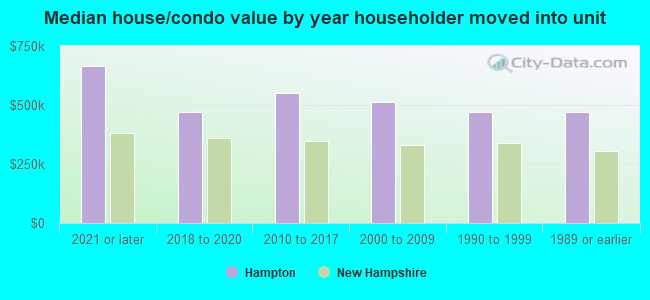
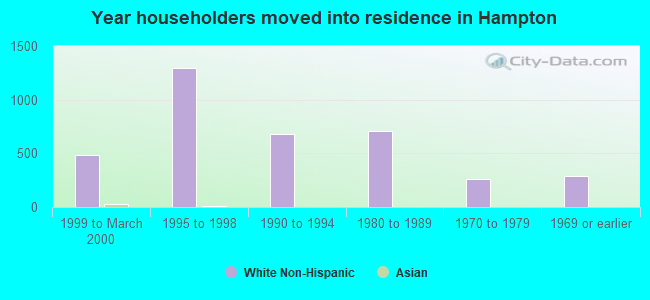
House/condo owner moved in on average 15 years ago
Renter moved in on average 2 years ago
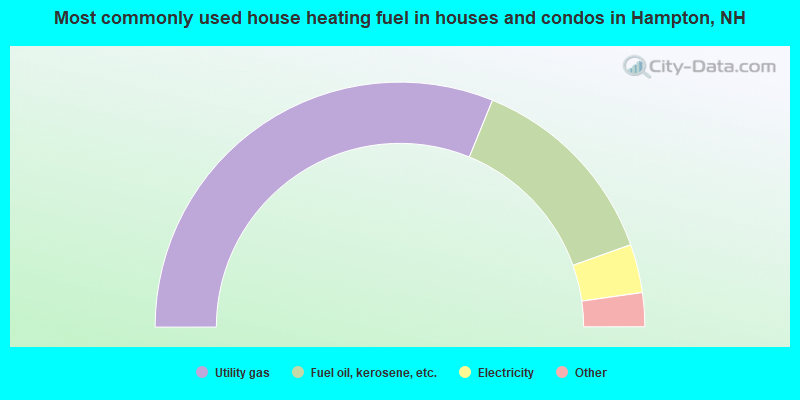
- 62.4%Utility gas
- 26.8%Fuel oil, kerosene, etc.
- 6.4%Electricity
- 3.3%Bottled, tank, or LP gas
- 1.2%Other fuel
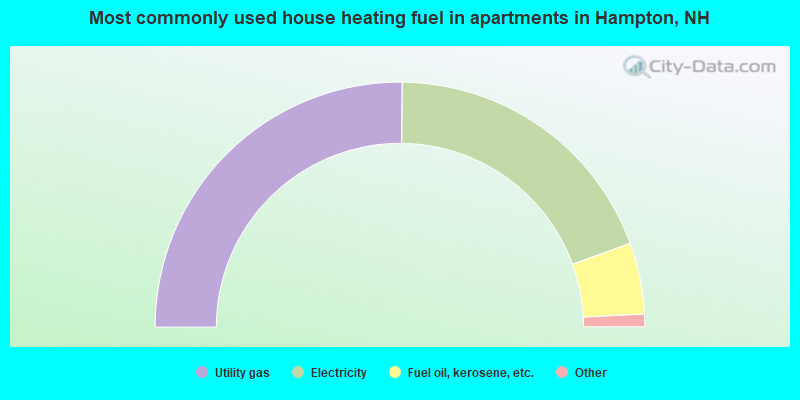
- 50.4%Utility gas
- 38.7%Electricity
- 9.4%Fuel oil, kerosene, etc.
- 0.8%No fuel used
- 0.7%Other fuel
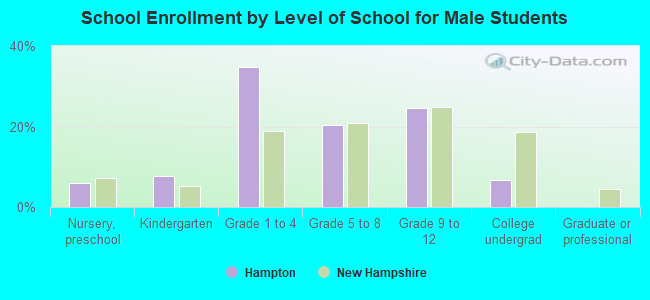
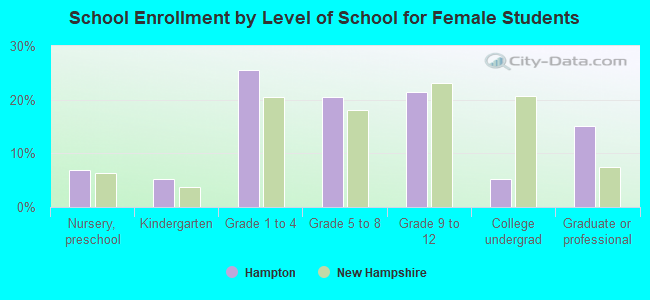
Private vs. public school enrollment:
| Here: | 3.8% |
| New Hampshire: | 11.4% |
| Here: | 0.3% |
| New Hampshire: | 14.0% |
| Here: | 12.4% |
| New Hampshire: | 38.0% |