Hampton, SC (South Carolina) Houses and Residents
| Hampton: | $227,515 |
| South Carolina: | $254,600 |
Mean price in 2022:
Detached houses: $188,948
Here: $188,948 State: $368,255 Mobile homes: $31,449
Here: $31,449 State: $102,531
Total population: 2,702 (Urban population: 2,321 (all inside urban clusters), Rural population: 421 (all nonfarm))
Houses: 1,472 (1,255 occupied: 892 owner occupied, 387 renter occupied)
| % of renters here: | 30% |
| State: | 28% |
Housing density: 325 houses/condos per square mile
Median price asked for vacant for-sale houses and condos in 2022: $1,298,496.
Median contract rent in 2022: $571 (lower quartile is $528, upper quartile is $672)
Median rent asked for vacant for-rent units in 2022: $483
Median gross rent in Hampton, SC in 2022: $825
Housing units in Hampton with a mortgage: 376 (39 second mortgage, 0 home equity loan, 13 both second mortgage and home equity loan)
Houses without a mortgage: 0
Median household income for houses/condos with a mortgage: $70,261
Median household income for apartments without a mortgage: $49,358
Median monthly housing costs: $819
Compare current foreclosures near Hampton, SC:
| Photo | Address | Area | Beds / Baths | Price | Details |
|---|---|---|---|---|---|

|
#1
Wagon Wheel Rd
Hampton, SC 29924
|
- sq. feet
|
- baths - beds |
show details | |

|
#2
Schley St
Hampton, SC 29924
|
- sq. feet
|
- baths - beds |
show details | |

|
#3
Glendale St
Hampton, SC 29924
|
- sq. feet
|
- baths - beds |
show details | |

|
#4
Wade Hampton Rd
Hampton, SC 29924
|
- sq. feet
|
- baths - beds |
show details | |

|
#5
Nix St W
Hampton, SC 29924
|
- sq. feet
|
- baths - beds |
show details | |

|
#6
Gum St E
Allendale, SC 29810
|
1,337 sq. feet
|
1 baths 3 beds |
show details | |

|
#7
Mill Springs Rd
Ehrhardt, SC 29081
|
2,109 sq. feet
|
1 baths 3 beds |
show details | |

|
#8
Dunbar St
Allendale, SC 29810
|
2,012 sq. feet
|
2 baths 3 beds |
show details | |

|
#9
Mail Carriage Rd
Estill, SC 29918
|
- sq. feet
|
- baths - beds |
show details | |

|
#10
Liberty Ave N
Estill, SC 29918
|
- sq. feet
|
- baths - beds |
show details |
| Photo | Address | Area | Beds / Baths | Price | Details |
|---|---|---|---|---|---|

|
#11
Firetower Rd
Ridgeland, SC 29936
|
980 sq. feet
|
- baths - beds |
show details | |

|
#12
Hudson Mill Rd
Ruffin, SC 29475
|
- sq. feet
|
- baths - beds |
show details | |

|
#13
Hacklous Rd
Yemassee, SC 29945
|
- sq. feet
|
- baths - beds |
show details | |

|
#14
St Johns Church Rd
Ehrhardt, SC 29081
|
- sq. feet
|
- baths - beds |
show details | |

|
#15
Honey Hill Rd
Estill, SC 29918
|
- sq. feet
|
- baths - beds |
show details | |

|
#16
Rivers Hill Rd
Pineland, SC 29934
|
- sq. feet
|
- baths - beds |
show details | |

|
#17
Walterboro Hwy
Varnville, SC 29944
|
- sq. feet
|
- baths - beds |
show details | |

|
#18
Porter Rd
Early Branch, SC 29916
|
- sq. feet
|
- baths - beds |
show details | |

|
#19
Chocolate City Rd
Estill, SC 29918
|
- sq. feet
|
- baths - beds |
show details | |

|
#20
Folk St E
Fairfax, SC 29827
|
- sq. feet
|
- baths - beds |
show details |
| Photo | Address | Area | Beds / Baths | Price | Details |
|---|---|---|---|---|---|

|
#21
Isiah Loop
Brunson, SC 29911
|
- sq. feet
|
- baths - beds |
show details | |

|
#22
7th St E
Fairfax, SC 29827
|
- sq. feet
|
- baths - beds |
show details | |

|
#23
Washington Ln
Estill, SC 29918
|
- sq. feet
|
- baths - beds |
show details | |

|
#24
Swan Rd
Varnville, SC 29944
|
- sq. feet
|
- baths - beds |
show details | |

|
#25
Sandy Run Rd
Varnville, SC 29944
|
- sq. feet
|
- baths - beds |
show details | |

|
#26
Folk St E
Fairfax, SC 29827
|
- sq. feet
|
- baths - beds |
show details | |

|
#27
Broxton Bridge Rd
Ehrhardt, SC 29081
|
- sq. feet
|
- baths - beds |
show details | |

|
#28
Lowcountry Hwy
Ruffin, SC 29475
|
- sq. feet
|
- baths - beds |
show details | |

|
#29
Davidson Tower Rd
Early Branch, SC 29916
|
- sq. feet
|
- baths - beds |
show details | |

|
#30
Speed Limit Rd
Varnville, SC 29944
|
- sq. feet
|
- baths - beds |
show details |
| Photo | Address | Area | Beds / Baths | Price | Details |
|---|---|---|---|---|---|

|
#31
Memory Dr
Ruffin, SC 29475
|
- sq. feet
|
- baths - beds |
show details | |

|
#32
Rainbow Bnd
Varnville, SC 29944
|
- sq. feet
|
- baths - beds |
show details | |

|
Check over 1 million property listings on Foreclosure.com!
|
browse all offers | |||

Latest news about housing in Hampton, SC collected exclusively by city-data.com from local newspapers, TV, and radio stations

 | Why derelict homes on Hampton Avenue? (8 replies) |
| Where to market furnished house rental to retirees or remote couples (9 replies) |
| Rental homes? (3 replies) |
| Does South Carolina Have Alot of Mobile Homes Like North Carolina do?? (14 replies) |
| Boeing lay-offs and sky-rocketing housing prices (71 replies) |
| Change the name of Wade Hampton High School (79 replies) |

Median year apartment built: 1994
Household type by relationship:
Households: 2,799- Male householders: 646 (261 living alone), Female householders: 598 (180 living alone)
590 spouses (590 opposite-sex spouses), 60 unmarried partners, (60 opposite-sex unmarried partners), 774 children (639 natural, 105 adopted, 28 stepchildren), 90 grandchildren, 0 brothers or sisters, 0 parents, 0 foster children, 0 other relatives, 14 non-relatives
- In group quarters: 23
Size of family households: 516 2-persons, 85 3-persons, 81 4-persons, 59 5-persons, 38 6-persons.
Size of nonfamily households: 449 1-person, 57 2-persons.
194 married couples with children.
117 single-parent households (27 men, 90 women).
97.5% of residents of Hampton speak English at home.
2.4% of residents speak Asian or Pacific Island language at home (76% speak English very well, 24% speak English well).
Foreign born population: 101 (3.6%)
(7.9% of them are naturalized citizens)
| Here: | 6.4 |
| State: | 6.4 |
| Here: | 4.1 |
| State: | 4.5 |

- Bedrooms in owner-occupied houses and condos in Hampton, South Carolina
- 0no bedroom
- 01 bedroom
- 602 bedrooms
- 5563 bedrooms
- 2074 bedrooms
- 695+ bedrooms

- Bedrooms in renter-occupied apartments in Hampton, South Carolina
- 24no bedroom
- 1321 bedroom
- 1062 bedrooms
- 1263 bedrooms
- 04 bedrooms
- 05+ bedrooms

- Cars and other vehicles available in Hampton in owner-occupied houses/condos
- 36no vehicle
- 871 vehicle
- 4492 vehicles
- 2053 vehicles
- 164 vehicles
- 1005+ vehicles

- Cars and other vehicles available in Hampton in renter-occupied apartments
- 111no vehicle
- 2271 vehicle
- 242 vehicles
- 03 vehicles
- 254 vehicles
- 05+ vehicles

- Rooms in owner-occupied houses in Hampton, South Carolina
- 01 room
- 02 rooms
- 03 rooms
- 54 rooms
- 1535 rooms
- 3116 rooms
- 1547 rooms
- 498 rooms
- 2209+ rooms

- Rooms in renter-occupied apartments in Hampton, South Carolina
- 241 room
- 02 rooms
- 833 rooms
- 1544 rooms
- 705 rooms
- 386 rooms
- 187 rooms
- 08 rooms
- 09+ rooms


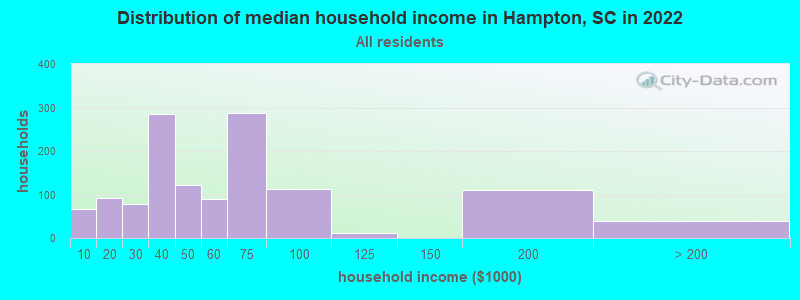
Hampton, SC household income distribution

- 67Less than $10,000
- 92$10,000 to $19,999
- 79$20,000 to $29,999
- 285$30,000 to $39,999
- 121$40,000 to $49,999
- 89$50,000 to $59,999
- 287$60,000 to $74,999
- 112$75,000 to $99,999
- 12$100,000 to $124,999
- 111$150,000 to $199,999
- 38$200,000 or more
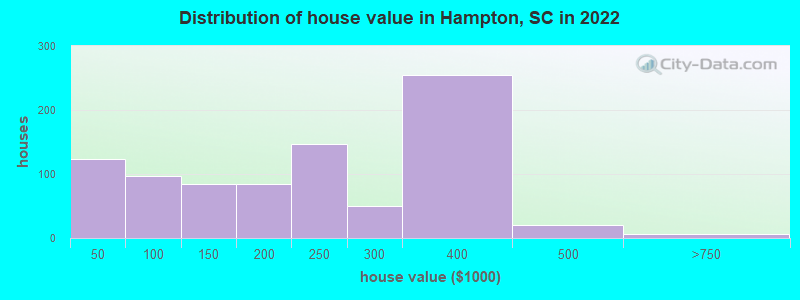
Home value of owner - occupied houses in 2022 in Hampton, SC
-
- 6Less than $10,000
- 116$15,000 to $19,999
- 5$50,000 to $59,999
- 15$60,000 to $69,999
- 25$70,000 to $79,999
- 26$80,000 to $89,999
- 24$90,000 to $99,999
- 31$100,000 to $124,999
- 53$125,000 to $149,999
- 27$150,000 to $174,999
- 57$175,000 to $199,999
- 147$200,000 to $249,999
- 50$250,000 to $299,999
- 254$300,000 to $399,999
- 19$400,000 to $499,999
- 5$500,000 to $749,999
Rent paid by renters in 2022 in Hampton, SC
-
- 14Less than $100
- 48$200 to $249
- 102$500 to $549
- 26$550 to $599
- 32$600 to $649
- 17$650 to $699
- 38$700 to $749
- 15$1,000 to $1,249
- 60No cash rent


Percentage of workers working in this county: 62.7%
Number of people working at home: 56 (5.1% of all workers)
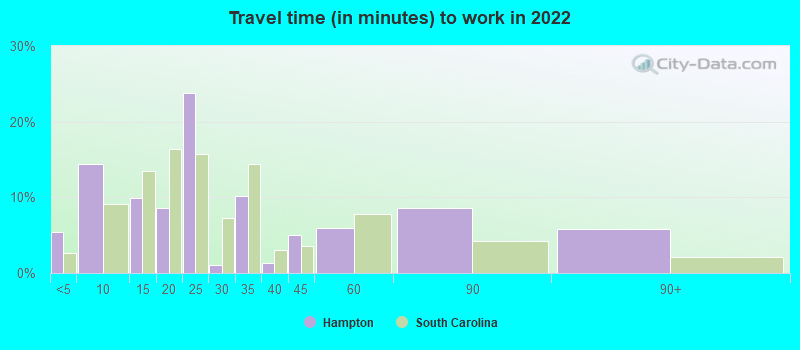
Travel time to work (commute)
- Less than 5 minutes: 112
- 5 to 9 minutes: 198
- 10 to 14 minutes: 76
- 15 to 19 minutes: 104
- 20 to 24 minutes: 101
- 25 to 29 minutes: 16
- 30 to 34 minutes: 112
- 35 to 39 minutes: 41
- 40 to 44 minutes: 9
- 45 to 59 minutes: 125
- 60 to 89 minutes: 61
- 90 or more minutes: 55
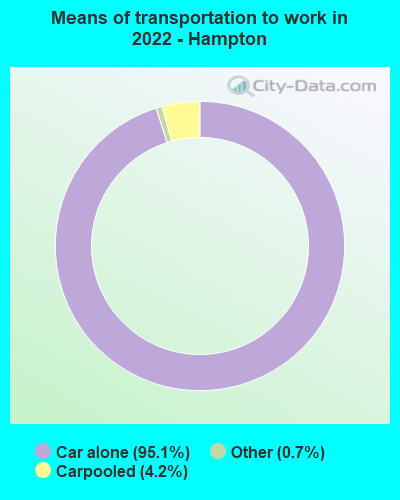
Means of transportation to work:
- Drove a car alone: 1,528 (89.3%)
- Carpooled: 71 (4.1%)
- Taxi: 12 (0.7%)
- Worked at home: 56 (3.3%)

- Unemployment by race in 2022
- Unemployment rate for Black residents
- 33.2%Males
- 3.4%Females
- Unemployment rate for two or more race residents
- 100.0%Females

- Year of entry for the foreign-born population in Hampton, South Carolina
- 1032010 or later
- 02000 to 2009
- 01990 to 1999
- 01980 to 1989
- 01970 to 1979
- 0Before 1970

First ancestries reported:
- English: 507 (23.2%)
- American: 351 (16.1%)
- European: 101 (4.6%)
- German: 62 (2.8%)
- Irish: 55 (2.5%)
- Scottish: 23 (1.1%)
- Polish: 18 (0.8%)
- Scotch-Irish: 7 (0.3%)
Most common places of birth for foreign-born residents (%):
| Hampton: | 49.5% (50) |
| South Carolina: | 4.1% (11,031) |
| Hampton: | 33.7% (34) |
| South Carolina: | 6.8% (18,307) |
| Hampton: | 20.8% (21) |
| South Carolina: | 0.2% (581) |
| Hampton: | 8.9% (9) |
| South Carolina: | 3.7% (9,982) |
Place of birth for U.S.-born residents:
- This state: 2,034
- Other state: 628
- Northeast: 92
- Midwest: 33
- South: 491
- West: 0
91.4% of Hampton residents lived in the same house 1 years ago.
Out of people who lived in different houses, 36.7% lived in this county.
Out of people who lived in different counties, 69.8% lived in South Carolina.
| Hampton: | 91.4% |
| State average: | 86.5% |
Education attainment for males 25 years and older:
- No schooling: 0
- Nursery to 4th grade: 0
- 5th and 6th grade: 0
- 7th and 8th grade: 42
- 9th grade: 0
- 10th grade: 12
- 11th grade: 106
- 12th grade, no diploma: 0
- High school graduate (or equivalency): 546
- Less than 1 year of college: 49
- Some college more than 1 year, no degree: 93
- Associate degree: 81
- Bachelor's degree: 93
- Master's degree: 35
- Professional school degree: 3
- Doctorate degree: 0

Education attainment for females 25 years and older:
- No schooling: 0
- Nursery to 4th grade: 0
- 5th and 6th grade: 0
- 7th and 8th grade: 12
- 9th grade: 17
- 10th grade: 0
- 11th grade: 30
- 12th grade, no diploma: 45
- High school graduate (or equivalency): 439
- Less than 1 year of college: 118
- Some college more than 1 year, no degree: 167
- Associate degree: 145
- Bachelor's degree: 71
- Master's degree: 35
- Professional school degree: 15
- Doctorate degree: 21


Housing units in structures:
- One, detached: 1,018
- One, attached: 15
- 3 or 4: 126
- 5 to 9: 118
- 20 to 49: 10
- Mobile homes: 184
Housing units lacking complete kitchen facilities in 2022: 1.4%
House/condo owner moved in on average 18 years ago
Renter moved in on average 1 years ago

Private vs. public school enrollment:
| Here: | 21.5% |
| South Carolina: | 14.4% |
| Here: | 23.7% |
| South Carolina: | 11.1% |
| Here: | 0.0% |
| South Carolina: | 21.9% |


