Hampton, VA (Virginia) Houses and Residents
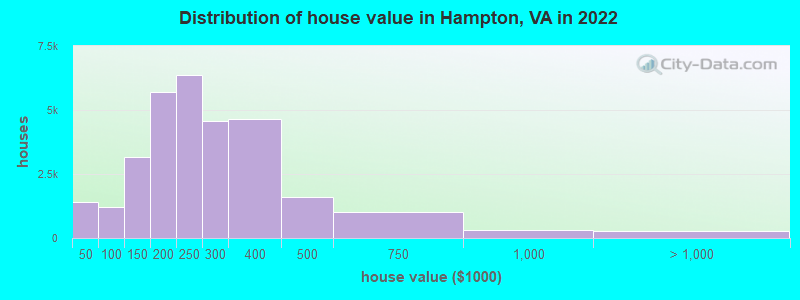
Estimated median house or condo value in 2022: $250,000 (it was $90,000 in 2000 )
Hampton:
$250,000Virginia:
$365,700
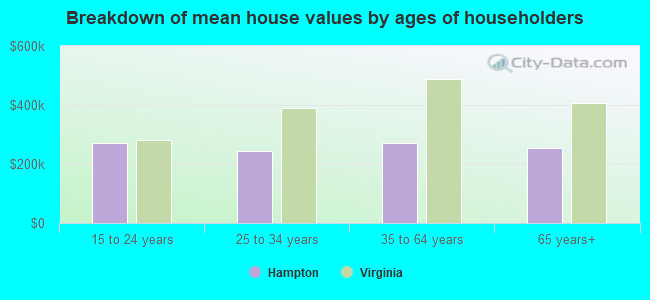
Lower value quartile - upper value quartile: $190,400 - $327,100Mean price in 2022: Detached houses: $248,821 Here:
$248,821State:
$472,865
Townhouses or other attached units: $265,677 Here:
$265,677State:
$457,437
In 2-unit structures: $147,504 Here:
$147,504State:
$396,289
In 3-to-4-unit structures: $197,396 Here:
$197,396State:
$252,346
In 5-or-more-unit structures: $269,713 Here:
$269,713State:
$382,551
Mobile homes: $100,327 Here:
$100,327State:
$100,736
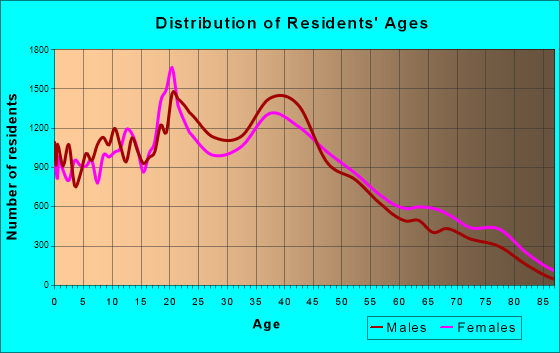
Total population: 136,879 (All urban)
Houses: 62,624 (56,961 occupied: 33,812 owner occupied, 23,149 renter occupied )
% of renters here:
41%State:
33%
Housing density: 1,209 houses/condos per square mile
Median price asked for vacant for-sale houses and condos in 2022: $248,458.
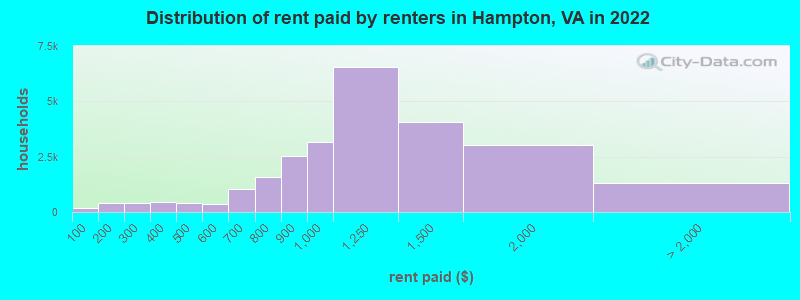
Median contract rent in 2022: $1,092 (lower quartile is $859, upper quartile is $1,400)
Median rent asked for vacant for-rent units in 2022: $1,585
Median gross rent in Hampton, VA in 2022: $1,323
Housing units in Hampton with a mortgage: 24,060 (2,081 second mortgage, 69 home equity loan, 1,128 both second mortgage and home equity loan )Houses without a mortgage: 392
Median household income for houses/condos with a mortgage: $90,132
Median household income for apartments without a mortgage: $62,900
Median monthly housing costs: $1,313
Data:
Median house or condo value ($)
Median house or condo value ($ change since 2000)
Median house or condo value ($) - White
Median house or condo value ($) - Black or African American
Median house or condo value ($) - Asian
Median house or condo value ($) - Hispanic or Latino
Median house or condo value ($) - American Indian and Alaska Native
Median house or condo value ($) - Multirace
Median house or condo value ($) - Other Race
Median price asked for mobile homes ($)
Household density (households per square mile)
Mean house or condo value by units in structure - 1, detached ($)
Mean house or condo value by units in structure - 1, attached ($)
Mean house or condo value by units in structure - 2 ($)
Mean house or condo value by units in structure by units in structure - 3 or 4 ($)
Mean house or condo value by units in structure - 5 or more ($)
Mean house or condo value by units in structure - Boat, RV, van, etc. ($)
Mean house or condo value by units in structure - Mobile home ($)
Median contract rent ($)
Median contract rent - Lower quartile ($)
Median contract rent - Upper quartile ($)
Median gross rent ($)
Urban houses (%)
Rural houses (%)
Houses occupied (%)
Houses occupied (% change since 2000)
Houses owner occupied (%)
Houses owner occupied (% change since 2000)
Houses renter occupied (%)
Houses renter occupied (% change since 2000)
Vacant housing units - For rent (%)
Vacant housing units - For rent (% change since 2000)
Vacant housing units - For sale only (%)
Vacant housing units - For sale only (% change since 2000)
Vacant housing units - Rented or sold, not occupied (%)
Vacant housing units - Rented or sold, not occupied (% change since 2000)
Vacant housing units - For seasonal, recreational, or occasional use (%)
Vacant housing units - For seasonal, recreational, or occasional use (% change since 2000)
Vacant housing units - For migrant workers (%)
Vacant housing units - For migrant workers (% change since 2000)
Vacant housing units - Other vacant (%)
Vacant housing units - Other vacant (% change since 2000)
Median monthly housing costs ($)
Median household income for houses/condos with a mortgage ($)
Median household income for houses/condos without a mortgage ($)
Median household income ($)
Median household income ($) - White
Median household income ($) - Black or African American
Median household income ($) - Asian
Median household income ($) - Hispanic or Latino
Median household income ($) - American Indian and Alaska Native
Median household income ($) - Multirace
Median household income ($) - Other Race
Mortgage status - with mortgage (%)
Mortgage status - with second mortgage (%)
Mortgage status - with home equity loan (%)
Mortgage status - with both second mortgage and home equity loan (%)
Mortgage status - without a mortgage (%)
Median year house/condo built
Median year apartment built
Household type by relationship - Male householder living alone (%)
Household type by relationship - Male householder not living alone (%)
Household type by relationship - Female householder living alone (%)
Household type by relationship - Female householder not living alone (%)
Household type by relationship - Opposite-Sex spouse (%)
Household type by relationship - Same-Sex spouse (%)
Household type by relationship - Opposite-Sex unmarried partner (%)
Household type by relationship - Same-Sex unmarried partner (%)
Household type by relationship - In group quarters (%)
Size of family households - 2-person household (%)
Size of family households - 3-person household (%)
Size of family households - 4-person household (%)
Size of family households - 5-person household (%)
Size of family households - 6-person household (%)
Size of family households - 7-or-more-person household (%)
Size of nonfamily households - 1-person household (%)
Size of nonfamily households - 2-person household (%)
Size of nonfamily households - 3-person household (%)
Size of nonfamily households - 4-person household (%)
Size of nonfamily households - 5-person household (%)
Size of nonfamily households - 6-person household (%)
Size of nonfamily households - 7-or-moreperson household (%)
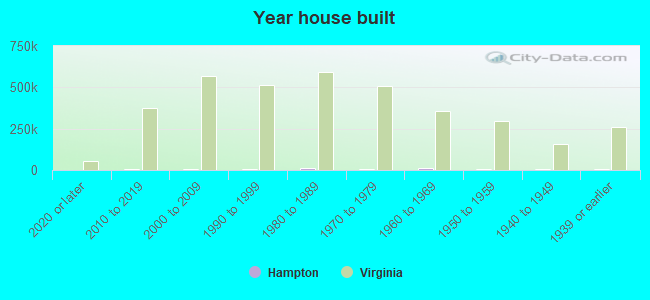
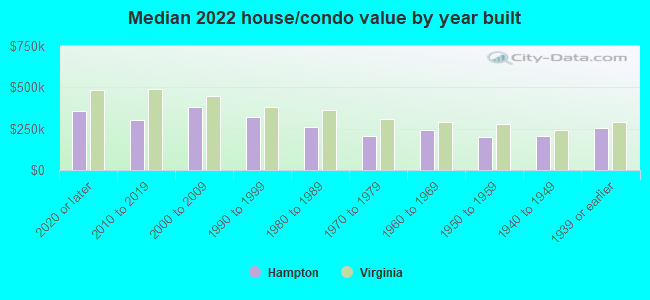
Year house built - Built 2010 or later (%)
Year house built - Built 2000 to 2009 (%)
Year house built - Built 1990 to 1999 (%)
Year house built - Built 1980 to 1989 (%)
Year house built - Built 1970 to 1979 (%)
Year house built - Built 1960 to 1969 (%)
Year house built - Built 1950 to 1959 (%)
Year house built - Built 1940 to 1949 (%)
Year house built - Built 1939 or earlier (%)
Median number of rooms in houses and condos
Median number of rooms in apartments
Median number of bedrooms in owner occupied houses
Mean number of bedrooms in owner occupied houses
Median number of bedrooms in renter occupied houses
Mean number of bedrooms in renter occupied houses
Median number of vehichles in owner occupied houses
Mean number of vehichles in owner occupied houses
Median number of vehichles in renter occupied houses
Mean number of vehichles in renter occupied houses
Rooms in owner-occupied houses - 1 room (%)
Rooms in owner-occupied houses - 2 rooms (%)
Rooms in owner-occupied houses - 3 rooms (%)
Rooms in owner-occupied houses - 4 rooms (%)
Rooms in owner-occupied houses - 5 rooms (%)
Rooms in owner-occupied houses - 6 rooms (%)
Rooms in owner-occupied houses - 7 rooms (%)
Rooms in owner-occupied houses - 8 rooms (%)
Rooms in owner-occupied houses - 9+ rooms (%)
Rooms in renter-occupied houses - 1 room (%)
Rooms in renter-occupied houses - 2 rooms (%)
Rooms in renter-occupied houses - 3 rooms (%)
Rooms in renter-occupied houses - 4 rooms (%)
Rooms in renter-occupied houses - 5 rooms (%)
Rooms in renter-occupied houses - 6 rooms (%)
Rooms in renter-occupied houses - 7 rooms (%)
Rooms in renter-occupied houses - 8 rooms (%)
Rooms in renter-occupied houses - 9+ rooms (%)
Bedrooms in owner-occupied houses - no bedrooms (%)
Bedrooms in owner-occupied houses - 1 bedroom (%)
Bedrooms in owner-occupied houses - 2 bedrooms (%)
Bedrooms in owner-occupied houses - 3 bedrooms (%)
Bedrooms in owner-occupied houses - 4 bedrooms (%)
Bedrooms in owner-occupied houses - 5+ bedrooms (%)
Bedrooms in renter-occupied houses - no bedrooms (%)
Bedrooms in renter-occupied houses - 1 bedroom (%)
Bedrooms in renter-occupied houses - 2 bedrooms (%)
Bedrooms in renter-occupied houses - 3 bedrooms (%)
Bedrooms in renter-occupied houses - 4 bedrooms (%)
Bedrooms in renter-occupied houses - 5+ bedrooms (%)
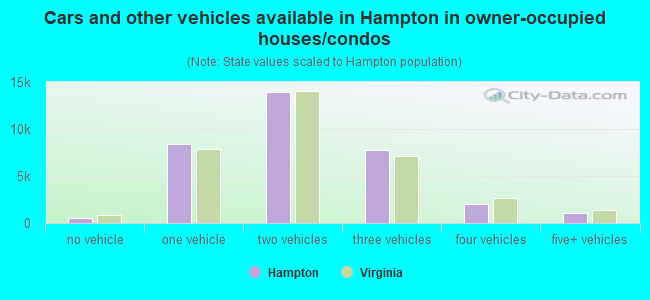
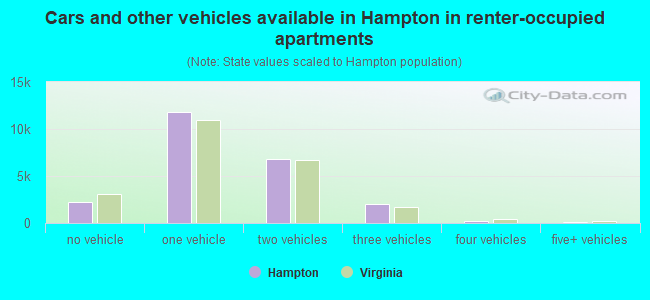
Vehicles available in owner-occupied houses - no vehicle available (%)
Vehicles available in owner-occupied houses - 1 vehicle available(%)
Vehicles available in owner-occupied houses - 2 Vehicles available (%)
Vehicles available in owner-occupied houses - 3 Vehicles available (%)
Vehicles available in owner-occupied houses - 4 Vehicles available (%)
Vehicles available in owner-occupied houses - 5+ Vehicles available (%)
Vehicles available in renter-occupied houses - no vehicle available (%)
Vehicles available in renter-occupied houses - 1 vehicle available (%)
Vehicles available in renter-occupied houses - 2 Vehicles available (%)
Vehicles available in renter-occupied houses - 3 Vehicles available (%)
Vehicles available in renter-occupied houses - 4 Vehicles available (%)
Vehicles available in renter-occupied houses - 5+ Vehicles available (%)
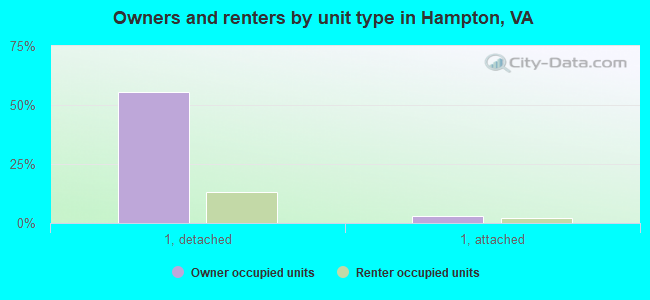
Housing units in structures - 1, detached (%)
Housing units in structures - 1, attached (%)
Housing units in structures - 2 (%)
Housing units in structures - 3 or 4 (%)
Housing units in structures - 5 to 9 (%)
Housing units in structures - 10 to 19 (%)
Housing units in structures - 20 to 49 (%)
Housing units in structures - 50 or more (%)
Housing units in structures - Mobile home (%)
Housing units in structures - Boat, RV, van, etc. (%)
Housing units in structures - Owners - 1, detached (%)
Housing units in structures - Owners - 1, attached (%)
Housing units in structures - Owners - 2 (%)
Housing units in structures - Owners - 3 or 4 (%)
Housing units in structures - Owners - 5 to 9 (%)
Housing units in structures - Owners - 10 to 19 (%)
Housing units in structures - Owners - 20 to 49 (%)
Housing units in structures - Owners - 50 or more (%)
Housing units in structures - Owners - Mobile home (%)
Housing units in structures - Owners - Boat, RV, van, etc. (%)
Housing units in structures - Renters - 1, detached (%)
Housing units in structures - Renters - 1, attached (%)
Housing units in structures - Renters - 2 (%)
Housing units in structures - Renters - 3 or 4 (%)
Housing units in structures - Renters - 5 to 9 (%)
Housing units in structures - Renters - 10 to 19 (%)
Housing units in structures - Renters - 20 to 49 (%)
Housing units in structures - Renters - 50 or more (%)
Housing units in structures - Renters - Mobile home (%)
Housing units in structures - Renters - Boat, RV, van, etc. (%)
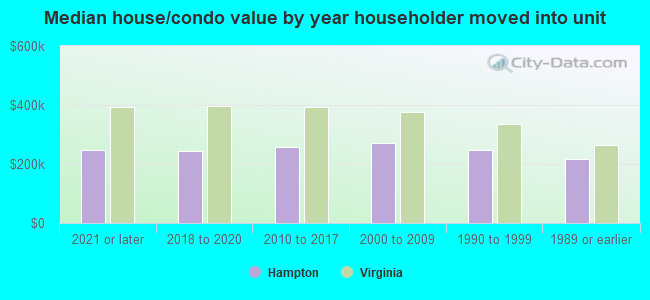
House/condo owner moved in on average (years ago)
Renter moved in on average (years ago)
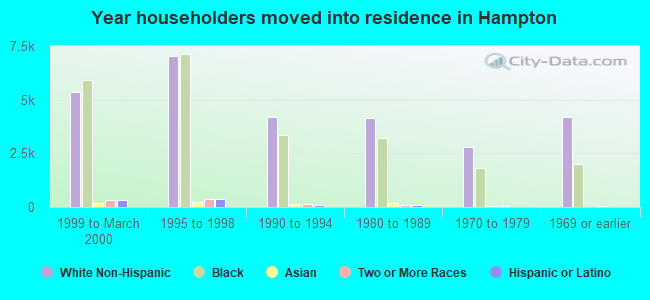
Year householder moved into unit - Moved in 1999 to March 2000 (%)
Year householder moved into unit - Moved in 1999 to March 2000 (%) - White
Year householder moved into unit - Moved in 1999 to March 2000 (%) - Black or African American
Year householder moved into unit - Moved in 1999 to March 2000 (%) - Asian
Year householder moved into unit - Moved in 1999 to March 2000 (%) - Hispanic or Latino
Year householder moved into unit - Moved in 1999 to March 2000 (%) - American Indian and Alaska Native
Year householder moved into unit - Moved in 1999 to March 2000 (%) - Multirace
Year householder moved into unit - Moved in 1999 to March 2000 (%) - Other Race
Year householder moved into unit - Moved in 1995 to 1998 (%)
Year householder moved into unit - Moved in 1995 to 1998 (%) - White
Year householder moved into unit - Moved in 1995 to 1998 (%) - Black or African American
Year householder moved into unit - Moved in 1995 to 1998 (%) - Asian
Year householder moved into unit - Moved in 1995 to 1998 (%) - Hispanic or Latino
Year householder moved into unit - Moved in 1995 to 1998 (%) - American Indian and Alaska Native
Year householder moved into unit - Moved in 1995 to 1998 (%) - Multirace
Year householder moved into unit - Moved in 1995 to 1998 (%) - Other Race
Year householder moved into unit - Moved in 1990 to 1994 (%)
Year householder moved into unit - Moved in 1990 to 1994 (%) - White
Year householder moved into unit - Moved in 1990 to 1994 (%) - Black or African American
Year householder moved into unit - Moved in 1990 to 1994 (%) - Asian
Year householder moved into unit - Moved in 1990 to 1994 (%) - Hispanic or Latino
Year householder moved into unit - Moved in 1990 to 1994 (%) - American Indian and Alaska Native
Year householder moved into unit - Moved in 1990 to 1994 (%) - Multirace
Year householder moved into unit - Moved in 1990 to 1994 (%) - Other Race
Year householder moved into unit - Moved in 1980 to 1989 (%)
Year householder moved into unit - Moved in 1980 to 1989 (%) - White
Year householder moved into unit - Moved in 1980 to 1989 (%) - Black or African American
Year householder moved into unit - Moved in 1980 to 1989 (%) - Asian
Year householder moved into unit - Moved in 1980 to 1989 (%) - Hispanic or Latino
Year householder moved into unit - Moved in 1980 to 1989 (%) - American Indian and Alaska Native
Year householder moved into unit - Moved in 1980 to 1989 (%) - Multirace
Year householder moved into unit - Moved in 1980 to 1989 (%) - Other Race
Year householder moved into unit - Moved in 1970 to 1979 (%)
Year householder moved into unit - Moved in 1970 to 1979 (%) - White
Year householder moved into unit - Moved in 1970 to 1979 (%) - Black or African American
Year householder moved into unit - Moved in 1970 to 1979 (%) - Asian
Year householder moved into unit - Moved in 1970 to 1979 (%) - Hispanic or Latino
Year householder moved into unit - Moved in 1970 to 1979 (%) - American Indian and Alaska Native
Year householder moved into unit - Moved in 1970 to 1979 (%) - Multirace
Year householder moved into unit - Moved in 1970 to 1979 (%) - Other Race
Year householder moved into unit - Moved in 1969 or earlier (%)
Year householder moved into unit - Moved in 1969 or earlier (%) - White
Year householder moved into unit - Moved in 1969 or earlier (%) - Black or African American
Year householder moved into unit - Moved in 1969 or earlier (%) - Asian
Year householder moved into unit - Moved in 1969 or earlier (%) - Hispanic or Latino
Year householder moved into unit - Moved in 1969 or earlier (%) - American Indian and Alaska Native
Year householder moved into unit - Moved in 1969 or earlier (%) - Multirace
Year householder moved into unit - Moved in 1969 or earlier (%) - Other Race
Housing units lacking complete plumbing facilities (%)
Housing units lacking complete kitchen facilities (%)
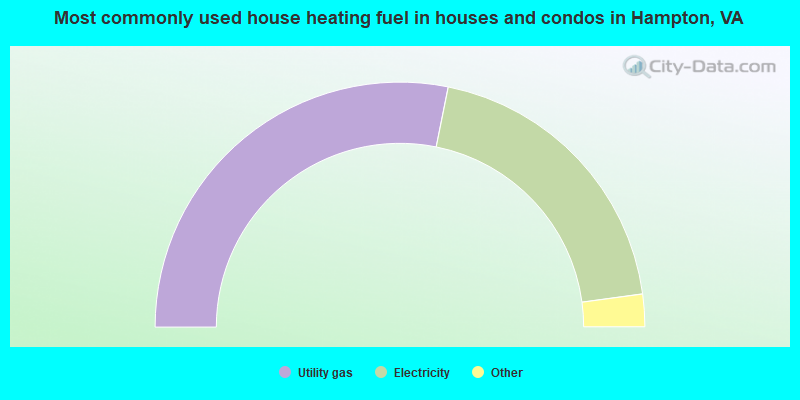
House heating fuel used in houses and condos - Utility gas (%)
House heating fuel used in houses and condos - Bottled, tank, or LP gas (%)
House heating fuel used in houses and condos - Electricity (%)
House heating fuel used in houses and condos - Fuel oil, kerosene, etc. (%)
House heating fuel used in houses and condos - Coal or coke (%)
House heating fuel used in houses and condos - Wood (%)
House heating fuel used in houses and condos - Solar energy (%)
House heating fuel used in houses and condos - Other fuel (%)
House heating fuel used in houses and condos - No fuel used (%)
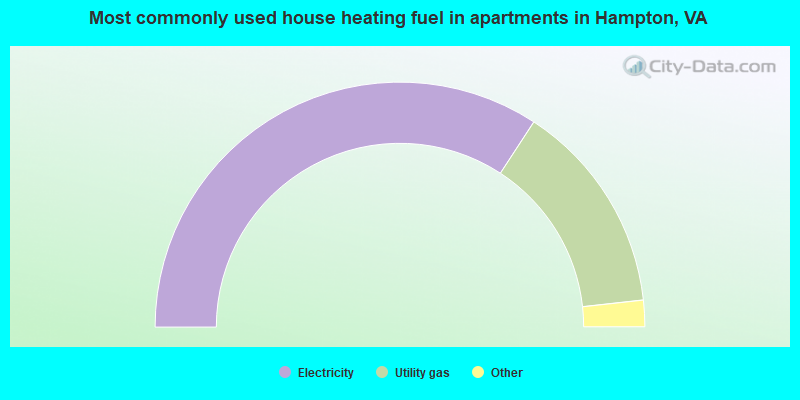
House heating fuel used in apartments - Utility gas (%)
House heating fuel used in apartments - Bottled, tank, or LP gas (%)
House heating fuel used in apartments - Electricity (%)
House heating fuel used in apartments - Fuel oil, kerosene, etc. (%)
House heating fuel used in apartments - Coal or coke (%)
House heating fuel used in apartments - Wood (%)
House heating fuel used in apartments - Solar energy (%)
House heating fuel used in apartments - Other fuel (%)
House heating fuel used in apartments - No fuel used (%)
Latest news about housing in Hampton, VA collected exclusively by city-data.com from local newspapers, TV, and radio stations
Median year house/condo built: 1972Median year apartment built: 1980Household type by relationship:
Households: 138,037
Male householders: 26,677 (7,874 living alone ), Female householders: 30,284 (11,144 living alone )23,475 spouses (23,418 opposite-sex spouses ), 3,704 unmarried partners , (3,461 opposite-sex unmarried partners ), 37,122 children (32,133 natural , 643 adopted , 4,346 stepchildren ), 4,292 grandchildren , 1,754 brothers or sisters , 2,125 parents , 0 foster children , 2,029 other relatives , 3,461 non-relatives In group quarters: 3,114
Size of family households: 14,267 2-persons , 8,460 3-persons , 4,701 4-persons , 3,493 5-persons , 1,193 6-persons , 1,526 7-or-more-persons .
Size of nonfamily households: 19,018 1-person , 3,527 2-persons , 637 3-persons , 69 4-persons , 70 5-persons .
17,664 married couples with children. single-parent households (1,393 men , 5,610 women ).
92.3% of residents of Hampton speak English at home. of residents speak Spanish at home (72% speak English very well , 13% speak English well , 12% speak English not well , 2% don't speak English at all ).of residents speak other Indo-European language at home (71% speak English very well , 22% speak English well , 6% speak English not well , 1% don't speak English at all ).of residents speak Asian or Pacific Island language at home (54% speak English very well , 36% speak English well , 10% speak English not well ).of residents speak other language at home (84% speak English very well , 9% speak English well , 1% speak English not well , 6% don't speak English at all ).
Foreign born population: 7,779 (5.6%)of them are naturalized citizens )
Median number of rooms in houses and condos:
Median number of rooms in apartments
Owner-occupied Renter-occupied
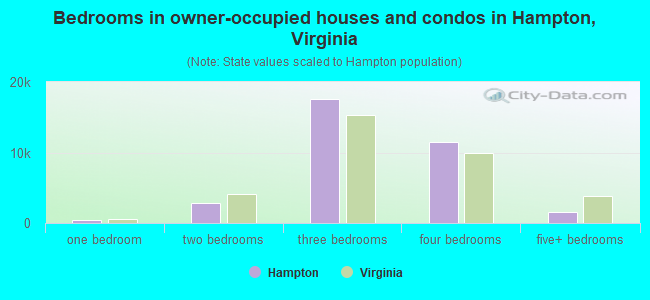
Bedrooms in owner-occupied houses and condos in Hampton, Virginia
45 no bedroom 435 1 bedroom 2,808 2 bedrooms 17,542 3 bedrooms 11,474 4 bedrooms 1,508 5+ bedrooms
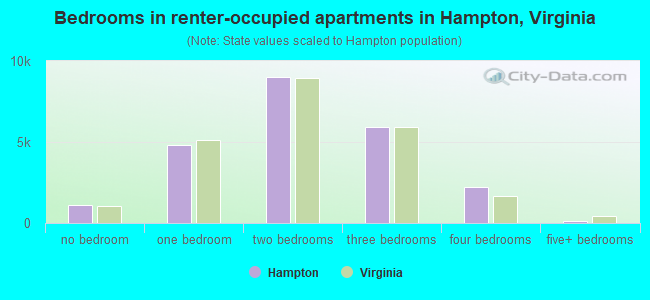
Bedrooms in renter-occupied apartments in Hampton, Virginia
1,087 no bedroom 4,840 1 bedroom 8,985 2 bedrooms 5,910 3 bedrooms 2,218 4 bedrooms 109 5+ bedrooms
Owner-occupied Renter-occupied
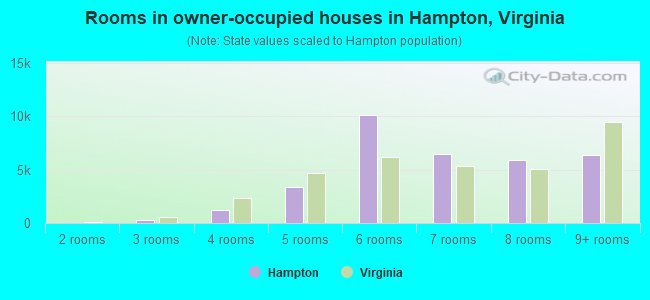
Rooms in owner-occupied houses in Hampton, Virginia
45 1 room 0 2 rooms 241 3 rooms 1,245 4 rooms 3,403 5 rooms 10,098 6 rooms 6,474 7 rooms 5,919 8 rooms 6,387 9+ rooms
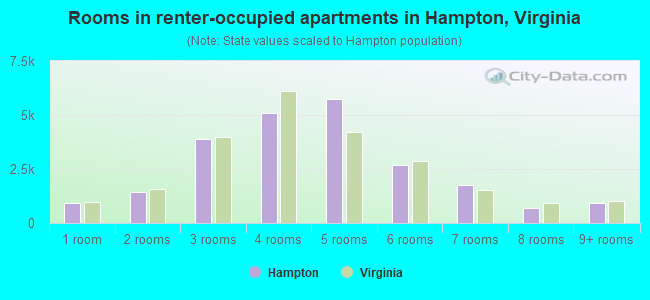
Rooms in renter-occupied apartments in Hampton, Virginia
931 1 room 1,455 2 rooms 3,866 3 rooms 5,103 4 rooms 5,720 5 rooms 2,694 6 rooms 1,757 7 rooms 700 8 rooms 923 9+ rooms
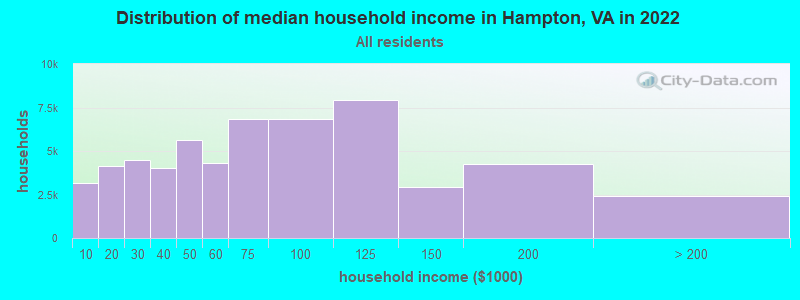
Hampton, VA household income distribution 3,174 Less than $10,0004,114 $10,000 to $19,9994,476 $20,000 to $29,9994,044 $30,000 to $39,9995,632 $40,000 to $49,9994,309 $50,000 to $59,9996,842 $60,000 to $74,9996,864 $75,000 to $99,9997,908 $100,000 to $124,9992,912 $125,000 to $149,9994,266 $150,000 to $199,9992,420 $200,000 or more
Home value of owner - occupied houses in 2022 in Hampton, VA 520 Less than $10,000129 $10,000 to $14,999196 $15,000 to $19,999258 $20,000 to $24,99991 $25,000 to $29,99960 $30,000 to $34,99978 $35,000 to $39,99954 $40,000 to $49,999188 $50,000 to $59,999200 $60,000 to $69,999201 $70,000 to $79,999287 $80,000 to $89,999283 $90,000 to $99,9991,158 $100,000 to $124,9991,986 $125,000 to $149,9993,131 $150,000 to $174,9992,585 $175,000 to $199,9996,373 $200,000 to $249,9994,566 $250,000 to $299,9994,656 $300,000 to $399,9991,590 $400,000 to $499,9991,033 $500,000 to $749,999305 $750,000 to $999,999224 $1,000,000 to $1,499,99924 $1,500,000 to $1,999,99916 $2,000,000 or moreRent paid by renters in 2022 in Hampton, VA 171 Less than $100221 $100 to $149174 $150 to $199316 $200 to $24999 $250 to $299250 $300 to $349190 $350 to $399194 $400 to $449222 $450 to $499169 $500 to $549172 $550 to $599576 $600 to $649480 $650 to $699557 $700 to $7491,007 $750 to $7992,525 $800 to $8993,143 $900 to $9996,560 $1,000 to $1,2494,060 $1,250 to $1,4993,013 $1,500 to $1,999417 $2,000 to $2,49960 $2,500 to $2,99957 $3,000 to $3,49973 $3,500 or more698 No cash rent
Percentage of workers working in this county: 49.6%Number of people working at home: 6,237 (9.1% of all workers )
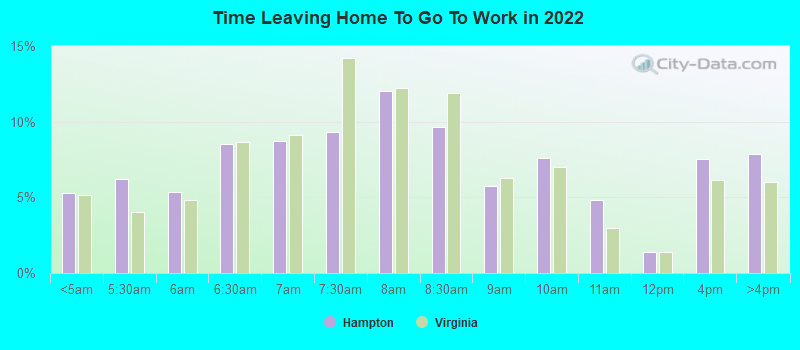
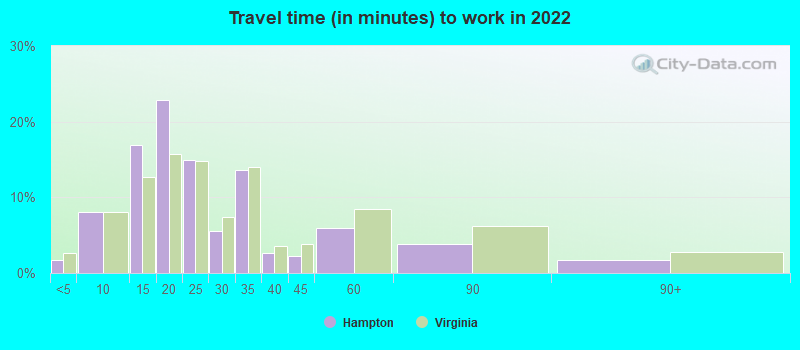
Travel time to work (commute)
Less than 5 minutes: 1,6835 to 9 minutes: 5,18110 to 14 minutes: 10,56215 to 19 minutes: 13,36020 to 24 minutes: 9,99225 to 29 minutes: 3,42930 to 34 minutes: 7,36535 to 39 minutes: 1,65240 to 44 minutes: 1,59145 to 59 minutes: 3,19060 to 89 minutes: 2,71890 or more minutes: 689
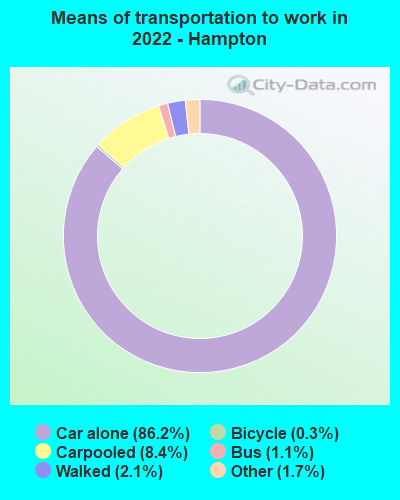
Means of transportation to work:
Drove a car alone: 50,806 (76.2%)Carpooled: 5,036 (7.6%)Bus : 477 (0.7%)Light rail, streetcar or trolley : 13 (0.0%)Ferryboat: 33 (0.0%)Taxi: 1,245 (1.9%)Bicycle: 159 (0.2%)Walked: 1,352 (2.0%)Worked at home: 6,237 (9.4%)
Unemployment by race in 2022
Unemployment rate for White non-Hispanic residents 6.5% Males5.1% FemalesUnemployment rate for Black residents 16.8% Males6.9% FemalesUnemployment rate for Asian residents 2.3% Males2.8% FemalesUnemployment rate for two or more race residents 7.8% Males3.1% FemalesUnemployment rate for Hispanic or Latino residents 0.7% Males3.8% Females
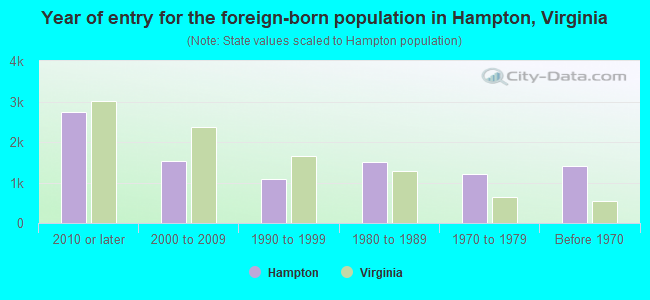
Year of entry for the foreign-born population in Hampton, Virginia
2,747 2010 or later 1,531 2000 to 2009 1,086 1990 to 1999 1,510 1980 to 1989 1,222 1970 to 1979 1,397 Before 1970
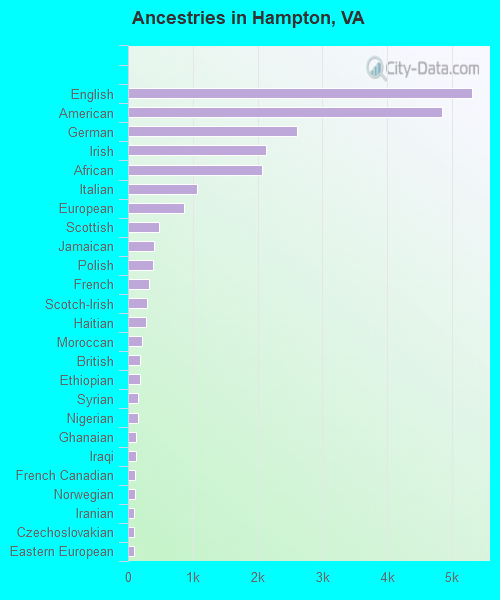
First ancestries reported:
English: 5,307 (6.7%)
American: 4,845 (6.2%)
German: 2,611 (3.3%)
Irish: 2,129 (2.7%)
African: 2,075 (2.6%)
Italian: 1,065 (1.4%)
European: 860 (1.1%)
Scottish: 483 (0.6%)
Jamaican: 409 (0.5%)
Polish: 389 (0.5%)
French: 326 (0.4%)
Scotch-Irish: 298 (0.4%)
Haitian: 281 (0.4%)
Moroccan: 213 (0.3%)
British: 187 (0.2%)
Ethiopian: 184 (0.2%)
Syrian: 162 (0.2%)
Nigerian: 159 (0.2%)
Ghanaian: 117 (0.1%)
Iraqi: 116 (0.1%)
French Canadian: 105 (0.1%)
Norwegian: 101 (0.1%)
Iranian: 96 (0.1%)
Czechoslovakian: 94 (0.1%)
Eastern European: 89 (0.1%)
Greek: 86 (0.1%)
Russian: 80 (0.1%)
Swedish: 80 (0.1%)
Guyanese: 67 (0.09%)
Welsh: 67 (0.09%)
Finnish: 62 (0.08%)
West Indian: 51 (0.06%)
Romanian: 46 (0.06%)
Barbadian: 45 (0.06%)
Canadian: 40 (0.05%)
Trinidadian and Tobagonian: 40 (0.05%)
Scandinavian: 34 (0.04%)
Swiss: 32 (0.04%)
South African: 31 (0.04%)
Belizean: 27 (0.03%)
Dutch: 27 (0.03%)
Egyptian: 25 (0.03%)
Slovak: 25 (0.03%)
Afghan: 24 (0.03%)
Portuguese: 24 (0.03%)
Lebanese: 23 (0.03%)
Hungarian: 22 (0.03%)
Yugoslavian: 21 (0.03%)
Danish: 20 (0.03%)
Arab: 17 (0.02%)
Northern European: 16 (0.02%)
Czech: 16 (0.02%)
Serbian: 16 (0.02%)
Bermudan: 15 (0.02%)
Armenian: 13 (0.02%)
Senegalese: 13 (0.02%)
Ukrainian: 11 (0.01%)
Pennsylvania German: 10 (0.01%)
Somali: 7 (0.01%)
Belgian: 6 (0.01%)
British West Indian: 5 (0.01%)
Turkish: 4 (0.01%)
Most common places of birth for foreign-born residents (%): Philippines Hampton:
12.1% (927)Virginia:
4.8% (52,629)
Panama Hampton:
5.9% (452)Virginia:
0.4% (4,196)
Jamaica Hampton:
5.4% (409)Virginia:
1.0% (10,734)
Vietnam Hampton:
4.2% (323)Virginia:
4.2% (45,750)
Honduras Hampton:
3.8% (294)Virginia:
3.0% (32,892)
Japan Hampton:
3.6% (278)Virginia:
0.8% (8,805)
Mexico Hampton:
3.6% (272)Virginia:
5.3% (57,498)
Iraq Hampton:
3.2% (248)Virginia:
0.9% (9,351)
Syria Hampton:
2.8% (217)Virginia:
0.3% (2,743)
Dominican Republic Hampton:
2.8% (217)Virginia:
0.6% (6,698)
El Salvador Hampton:
2.8% (217)Virginia:
9.9% (107,534)
Africa, n.e.c. Hampton:
2.8% (214)Virginia:
0.3% (3,275)
Germany Hampton:
2.6% (198)Virginia:
1.7% (18,227)
Korea Hampton:
2.5% (193)Virginia:
4.9% (52,857)
Haiti Hampton:
2.5% (189)Virginia:
0.4% (4,246)
Canada Hampton:
2.3% (177)Virginia:
1.2% (12,984)
Spain Hampton:
2.0% (156)Virginia:
0.3% (3,452)
Ghana Hampton:
1.9% (147)Virginia:
1.6% (17,346)
England Hampton:
1.8% (140)Virginia:
0.9% (9,842)
Thailand Hampton:
1.7% (133)Virginia:
0.7% (7,672)
India Hampton:
1.6% (123)Virginia:
9.0% (97,830)
Nigeria Hampton:
1.6% (121)Virginia:
0.6% (6,956)
Egypt Hampton:
1.6% (119)Virginia:
0.9% (9,672)
Democratic Republic of Congo (Zaire) Hampton:
1.5% (116)Virginia:
0.2% (1,786)
Place of birth for U.S.-born residents:
This state: 72,502Other state: 54,299Northeast: 15,396Midwest: 8,360South: 24,137West: 6,406 83.9% of Hampton residents lived in the same house 1 years ago.
Out of people who lived in different houses, 26.6% lived in this county.
Out of people who lived in different counties, 57.5% lived in Virginia.
Hampton:
83.9%State average:
86.6%
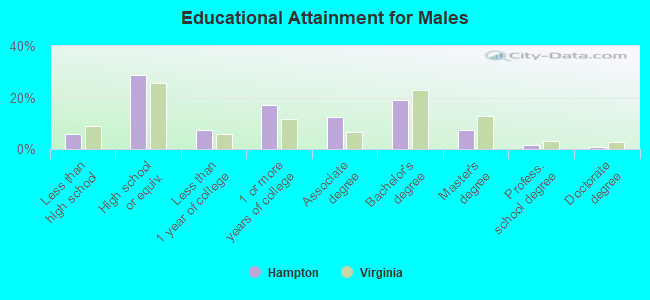
Education attainment for males 25 years and older:
No schooling: 264Nursery to 4th grade: 505th and 6th grade: 07th and 8th grade: 2829th grade: 9410th grade: 45511th grade: 32612th grade, no diploma: 1,118High school graduate (or equivalency): 12,763Less than 1 year of college: 3,226Some college more than 1 year, no degree: 7,578Associate degree: 5,455Bachelor's degree: 8,547Master's degree: 3,270Professional school degree: 731Doctorate degree: 316
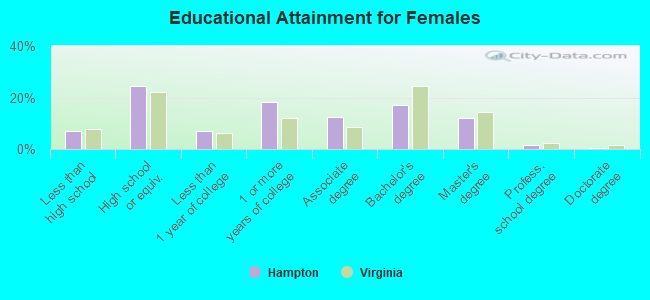
Education attainment for females 25 years and older:
No schooling: 409Nursery to 4th grade: 1125th and 6th grade: 07th and 8th grade: 2779th grade: 23910th grade: 6911th grade: 1,15312th grade, no diploma: 1,068High school graduate (or equivalency): 11,905Less than 1 year of college: 3,336Some college more than 1 year, no degree: 8,868Associate degree: 6,119Bachelor's degree: 8,325Master's degree: 5,796Professional school degree: 769Doctorate degree: 178
Housing units in structures:
One, detached: 41,153One, attached: 3,767Two: 1,7483 or 4: 2,3255 to 9: 3,88210 to 19: 4,70220 to 49: 1,64750 or more: 3,023Mobile homes: 377Median worth of mobile homes: $27,300
Housing units lacking complete plumbing facilities in 2022: 0.7%Housing units lacking complete kitchen facilities in 2022: 0.3%House/condo owner moved in on average 16 years ago
Renter moved in on average 2 years ago
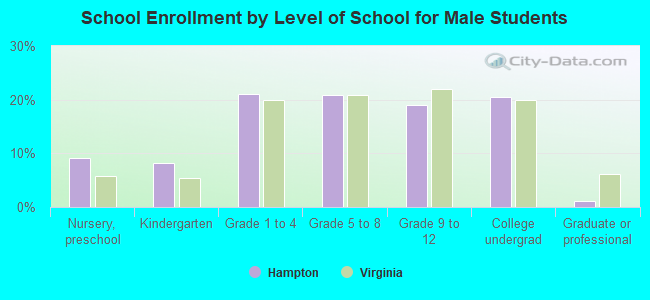
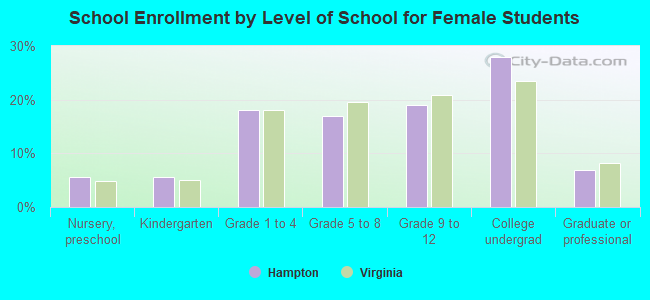
Private vs. public school enrollment:
Students in private schools in grades 1 to 8 (elementary and middle school): 1,368 Students in private schools in grades 9 to 12 (high school): 227 Students in private undergraduate colleges: 2,759