Hanna City, IL (Illinois) Houses and Residents
| Hanna City: | $131,767 |
| Illinois: | $251,600 |
Total population: 1,229 (Urban population: 0, Rural population: 1,005 (all nonfarm))
Houses: 816 (761 occupied: 638 owner occupied, 146 renter occupied)
| % of renters here: | 19% |
| State: | 33% |
Housing density: 1,711 houses/condos per square mile
Median price asked for vacant for-sale houses and condos in 2022 in this county: $63,105.
Median contract rent in 2022: $587 (lower quartile is $321, upper quartile is $789)
Median rent asked for vacant for-rent units in 2022: $1,741
Median gross rent in Hanna City, IL in 2022: $705
Housing units in Hanna City with a mortgage: 364 (21 second mortgage, 0 home equity loan, 15 both second mortgage and home equity loan)
Houses without a mortgage: 12
Median household income for houses/condos with a mortgage: $72,873
Median household income for apartments without a mortgage: $56,234
Median monthly housing costs: $809
Compare current foreclosures near Hanna City, IL:
| Photo | Address | Area | Beds / Baths | Price | Details |
|---|---|---|---|---|---|

|
#1
S Hanna City Glasford Rd
Hanna City, IL 61536
|
1,162 sq. feet
|
1 baths 2 beds |
show details | |

|
#2
W Jo Dan Ct
Hanna City, IL 61536
|
1,408 sq. feet
|
1 baths 3 beds |
show details | |

|
#3
Center St
Hanna City, IL 61536
|
936 sq. feet
|
1 baths 3 beds |
show details | |

|
#4
W Farmington Rd
Hanna City, IL 61536
|
1,110 sq. feet
|
2 baths 2 beds |
show details | |

|
#5
N Conn Rd
Hanna City, IL 61536
|
1,848 sq. feet
|
1 baths 3 beds |
show details | |

|
#6
N Molleck Dr # 5
Peoria, IL 61604
|
952 sq. feet
|
2 baths 2 beds |
$129,000
|
show details |

|
#7
2nd St
Pekin, IL 61554
|
1,058 sq. feet
|
1 baths 3 beds |
$124,900
|
show details |

|
#8
Herman St
Pekin, IL 61554
|
915 sq. feet
|
1 baths 2 beds |
$135,000
|
show details |

|
#9
W Brookside Dr
Peoria, IL 61615
|
2,391 sq. feet
|
2 baths 3 beds |
$241,000
|
show details |

|
#10
State St
Pekin, IL 61554
|
1,652 sq. feet
|
1 baths 6 beds |
$29,900
|
show details |
| Photo | Address | Area | Beds / Baths | Price | Details |
|---|---|---|---|---|---|

|
#11
N Highland St
Creve Coeur, IL 61610
|
750 sq. feet
|
1 baths 1 beds |
$24,900
|
show details |

|
#12
N Galena Rd
Peoria Heights, IL 61616
|
2,494 sq. feet
|
3 baths 3 beds |
show details | |

|
#13
N Brooklyn Pl
Dunlap, IL 61525
|
1,756 sq. feet
|
2 baths 2 beds |
show details | |

|
#14
Cypress St
Pekin, IL 61554
|
1,008 sq. feet
|
1 baths 3 beds |
show details | |

|
#15
Fischer Rd
Creve Coeur, IL 61610
|
1,444 sq. feet
|
1 baths 3 beds |
show details | |

|
#16
W Albany Ave
Peoria, IL 61604
|
1,014 sq. feet
|
1 baths 3 beds |
show details | |

|
#17
Franklin St
Pekin, IL 61554
|
1,254 sq. feet
|
2 baths 3 beds |
show details | |

|
#18
Kaskaskia Rd
Pekin, IL 61554
|
2,292 sq. feet
|
2 baths 3 beds |
show details | |

|
#19
Sun Valley Ct
East Peoria, IL 61611
|
1,060 sq. feet
|
1 baths 3 beds |
show details | |

|
#20
Jim Ct
East Peoria, IL 61611
|
1,788 sq. feet
|
1 baths 3 beds |
show details |
| Photo | Address | Area | Beds / Baths | Price | Details |
|---|---|---|---|---|---|

|
#21
W Mcclure Ave
Peoria, IL 61607
|
832 sq. feet
|
1 baths 2 beds |
show details | |

|
#22
W Shenandoah Dr
Peoria, IL 61614
|
1,332 sq. feet
|
2 baths 2 beds |
show details | |

|
#23
N Hamilton Rd
Peoria, IL 61614
|
- sq. feet
|
2 baths 4 beds |
show details | |

|
#24
S Stewart St
Creve Coeur, IL 61610
|
1,364 sq. feet
|
1 baths 4 beds |
show details | |

|
#25
Meadow Ave
East Peoria, IL 61611
|
- sq. feet
|
1 baths 2 beds |
show details | |

|
#26
Parkfield Dr
Pekin, IL 61554
|
2,123 sq. feet
|
2 baths 3 beds |
show details | |

|
#27
N Safford Dr
Peoria, IL 61615
|
912 sq. feet
|
1 baths 2 beds |
show details | |

|
#28
N 18th St
Pekin, IL 61554
|
1,548 sq. feet
|
1 baths 3 beds |
show details | |

|
#29
W Heading Ave
Peoria, IL 61604
|
1,040 sq. feet
|
2 baths 3 beds |
show details | |

|
#30
Ricketts Ave
Peoria, IL 61607
|
1,952 sq. feet
|
3 baths 3 beds |
show details |
| Photo | Address | Area | Beds / Baths | Price | Details |
|---|---|---|---|---|---|

|
#31
Royal Ave
Pekin, IL 61554
|
1,324 sq. feet
|
1 baths 3 beds |
show details | |

|
#32
N Oxford Pl
Peoria, IL 61614
|
1,844 sq. feet
|
2 baths 3 beds |
show details | |

|
#33
E Corrington Ave
Peoria, IL 61603
|
2,218 sq. feet
|
1 baths 4 beds |
show details | |

|
#34
W Detweiller Dr
Peoria, IL 61615
|
2,379 sq. feet
|
3 baths 3 beds |
show details | |

|
#35
S 7th St
Pekin, IL 61554
|
2,040 sq. feet
|
3 baths 3 beds |
show details | |

|
#36
E High St
Creve Coeur, IL 61610
|
1,095 sq. feet
|
1 baths 3 beds |
show details | |

|
#37
W Garden St
Peoria, IL 61605
|
950 sq. feet
|
1 baths 5 beds |
show details | |

|
#38
Illinois St
Pekin, IL 61554
|
1,008 sq. feet
|
1 baths 2 beds |
show details | |

|
#39
E Willcox Ave
Peoria, IL 61603
|
844 sq. feet
|
1 baths 2 beds |
show details | |

|
#40
S Stewart St
Creve Coeur, IL 61610
|
1,152 sq. feet
|
1 baths 3 beds |
show details |
| Photo | Address | Area | Beds / Baths | Price | Details |
|---|---|---|---|---|---|

|
#41
N Harper Ter
Peoria, IL 61604
|
1,388 sq. feet
|
2 baths 3 beds |
show details | |

|
#42
W Corrington Ave
Peoria, IL 61604
|
1,504 sq. feet
|
2 baths 3 beds |
show details | |

|
#43
W Meadows Pl
Peoria, IL 61604
|
818 sq. feet
|
1 baths 2 beds |
show details | |

|
#44
Dean Ct
Canton, IL 61520
|
1,406 sq. feet
|
1 baths 3 beds |
show details | |

|
#45
N Bourland Ave
Peoria, IL 61604
|
792 sq. feet
|
1 baths 2 beds |
show details | |

|
#46
S Granville Ave
Peoria, IL 61607
|
2,412 sq. feet
|
2 baths 4 beds |
show details | |

|
#47
W Thrush Ave
Peoria, IL 61604
|
1,142 sq. feet
|
2 baths 3 beds |
show details | |

|
#48
S Trivoli Rd
Trivoli, IL 61569
|
2,060 sq. feet
|
1 baths 3 beds |
show details | |

|
#49
N Saint Michael Ave
Peoria, IL 61615
|
1,653 sq. feet
|
2 baths 4 beds |
show details | |

|
Check over 1 million property listings on Foreclosure.com!
|
browse all offers | |||


 | Washington/Germantown Hills/Chillicothe/Dunlap (5 replies) |
| Looking for apartment in or around bartonville, il (13 replies) |
| Peoria, IL place to live (23 replies) |
| Bartonville IL (19 replies) |

Median year apartment built: 1968
Household type by relationship:
Households: 1,395- Male householders: 418 (199 living alone), Female householders: 331 (138 living alone)
317 spouses (317 opposite-sex spouses), 45 unmarried partners, (45 opposite-sex unmarried partners), 270 children (238 natural, 32 adopted, 0 stepchildren), 3 grandchildren, 0 brothers or sisters, 4 parents, 0 foster children, 0 other relatives, 2 non-relatives
Size of family households: 255 2-persons, 100 3-persons, 33 4-persons, 12 5-persons, 1 6-persons, 1 7-or-more-persons.
Size of nonfamily households: 349 1-person, 29 2-persons.
103 married couples with children.
48 single-parent households (19 men, 29 women).
98.6% of residents of Hanna City speak English at home.
0.4% of residents speak Spanish at home (100% speak English very well).
0.8% of residents speak other Indo-European language at home (91% speak English very well, 9% speak English not well).
Foreign born population: 9 (0.6%)
(88.9% of them are naturalized citizens)
| Here: | 5.7 |
| State: | 6.4 |
| Here: | 3.4 |
| State: | 4.1 |

- Bedrooms in owner-occupied houses and condos in Hanna City, Illinois
- 0no bedroom
- 151 bedroom
- 1922 bedrooms
- 3653 bedrooms
- 644 bedrooms
- 15+ bedrooms

- Bedrooms in renter-occupied apartments in Hanna City, Illinois
- 6no bedroom
- 791 bedroom
- 462 bedrooms
- 143 bedrooms
- 04 bedrooms
- 05+ bedrooms

- Cars and other vehicles available in Hanna City in owner-occupied houses/condos
- 15no vehicle
- 1381 vehicle
- 3442 vehicles
- 1163 vehicles
- 164 vehicles
- 85+ vehicles

- Cars and other vehicles available in Hanna City in renter-occupied apartments
- 6no vehicle
- 1001 vehicle
- 342 vehicles
- 63 vehicles
- 04 vehicles
- 05+ vehicles

- Rooms in owner-occupied houses in Hanna City, Illinois
- 01 room
- 02 rooms
- 133 rooms
- 544 rooms
- 2545 rooms
- 1176 rooms
- 777 rooms
- 588 rooms
- 659+ rooms

- Rooms in renter-occupied apartments in Hanna City, Illinois
- 61 room
- 72 rooms
- 693 rooms
- 314 rooms
- 225 rooms
- 36 rooms
- 87 rooms
- 08 rooms
- 09+ rooms


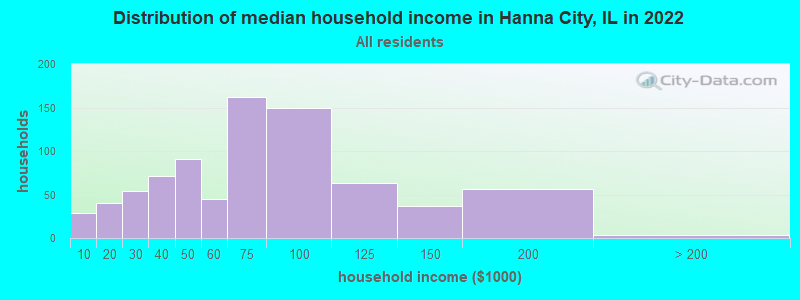
Hanna City, IL household income distribution

- 29Less than $10,000
- 40$10,000 to $19,999
- 54$20,000 to $29,999
- 71$30,000 to $39,999
- 91$40,000 to $49,999
- 45$50,000 to $59,999
- 162$60,000 to $74,999
- 149$75,000 to $99,999
- 63$100,000 to $124,999
- 37$125,000 to $149,999
- 56$150,000 to $199,999
- 4$200,000 or more
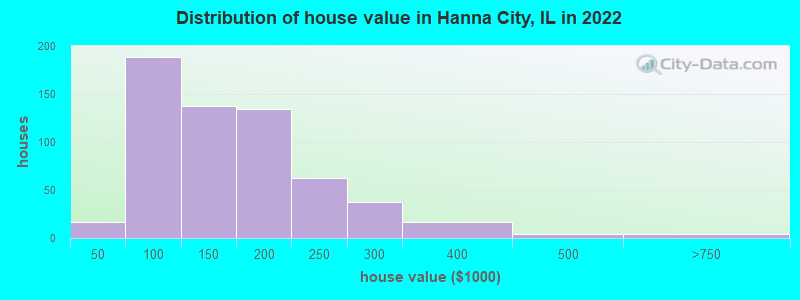
Home value of owner - occupied houses in 2022 in Hanna City, IL
-
- 4Less than $10,000
- 5$15,000 to $19,999
- 1$25,000 to $29,999
- 1$30,000 to $34,999
- 3$35,000 to $39,999
- 16$50,000 to $59,999
- 19$60,000 to $69,999
- 11$70,000 to $79,999
- 42$80,000 to $89,999
- 100$90,000 to $99,999
- 63$100,000 to $124,999
- 73$125,000 to $149,999
- 99$150,000 to $174,999
- 34$175,000 to $199,999
- 62$200,000 to $249,999
- 37$250,000 to $299,999
- 16$300,000 to $399,999
- 3$400,000 to $499,999
- 3$500,000 to $749,999
Rent paid by renters in 2022 in Hanna City, IL
-
- 13$150 to $199
- 11$200 to $249
- 15$300 to $349
- 4$350 to $399
- 16$500 to $549
- 8$550 to $599
- 24$600 to $649
- 2$650 to $699
- 1$700 to $749
- 16$750 to $799
- 12$800 to $899
- 5$900 to $999
- 3$1,000 to $1,249
- 8$1,250 to $1,499
- 2No cash rent


Percentage of workers working in this county: 68.1%
Number of people working at home: 66 (8.9% of all workers)
Travel time to work (commute)
- Less than 5 minutes: 30
- 5 to 9 minutes: 6
- 10 to 14 minutes: 34
- 15 to 19 minutes: 53
- 20 to 24 minutes: 351
- 25 to 29 minutes: 111
- 30 to 34 minutes: 61
- 35 to 39 minutes: 6
- 40 to 44 minutes: 16
- 45 to 59 minutes: 29
- 60 to 89 minutes: 3
- 90 or more minutes: 21
Means of transportation to work:
- Drove a car alone: 395 (79.3%)
- Carpooled: 69 (13.9%)
- Streetcar or trolley car: 7 (1.4%)
- Walked: 20 (4.0%)
- Worked at home: 7 (1.4%)

- Unemployment by race in 2022
- Unemployment rate for White non-Hispanic residents
- 0.7%Males
- 2.3%Females
- Unemployment rate for two or more race residents
- 100.0%Males

- Year of entry for the foreign-born population in Hanna City, Illinois
- 02010 or later
- 112000 to 2009
- 01990 to 1999
- 01980 to 1989
- 41970 to 1979
- 7Before 1970

First ancestries reported:
- German: 265 (36.8%)
- English: 126 (17.5%)
- American: 98 (13.6%)
- Irish: 26 (3.6%)
- Italian: 22 (3.1%)
- Scottish: 15 (2.1%)
- British: 13 (1.8%)
- Dutch: 11 (1.5%)
- Scotch-Irish: 11 (1.5%)
- Welsh: 8 (1.1%)
- Danish: 4 (0.6%)
- Turkish: 4 (0.6%)
- European: 3 (0.4%)
- French: 3 (0.4%)
- French Canadian: 3 (0.4%)
- Swedish: 3 (0.4%)
- Swiss: 2 (0.3%)
Most common places of birth for foreign-born residents (%):
| Hanna City: | 100.0% (12) |
| Illinois: | 1.3% (22,793) |
Place of birth for U.S.-born residents:
- This state: 1,177
- Other state: 214
- Northeast: 3
- Midwest: 85
- South: 61
- West: 73
93.4% of Hanna City residents lived in the same house 1 years ago.
Out of people who lived in different houses, 35.9% lived in this county.
Out of people who lived in different counties, 80.0% lived in Illinois.
| Hanna City: | 93.4% |
| State average: | 88.3% |
Education attainment for males 25 years and older:
- No schooling: 0
- Nursery to 4th grade: 0
- 5th and 6th grade: 0
- 7th and 8th grade: 2
- 9th grade: 0
- 10th grade: 0
- 11th grade: 13
- 12th grade, no diploma: 21
- High school graduate (or equivalency): 268
- Less than 1 year of college: 52
- Some college more than 1 year, no degree: 74
- Associate degree: 60
- Bachelor's degree: 74
- Master's degree: 29
- Professional school degree: 0
- Doctorate degree: 0

Education attainment for females 25 years and older:
- No schooling: 0
- Nursery to 4th grade: 0
- 5th and 6th grade: 0
- 7th and 8th grade: 1
- 9th grade: 5
- 10th grade: 0
- 11th grade: 3
- 12th grade, no diploma: 4
- High school graduate (or equivalency): 156
- Less than 1 year of college: 77
- Some college more than 1 year, no degree: 45
- Associate degree: 101
- Bachelor's degree: 75
- Master's degree: 64
- Professional school degree: 5
- Doctorate degree: 0


Housing units in structures:
- One, detached: 689
- One, attached: 37
- Two: 29
- 3 or 4: 9
- 10 to 19: 21
- 20 to 49: 19
- Mobile homes: 6
Housing units lacking complete kitchen facilities in 2022: 3.1%
House/condo owner moved in on average 17 years ago
Renter moved in on average 5 years ago

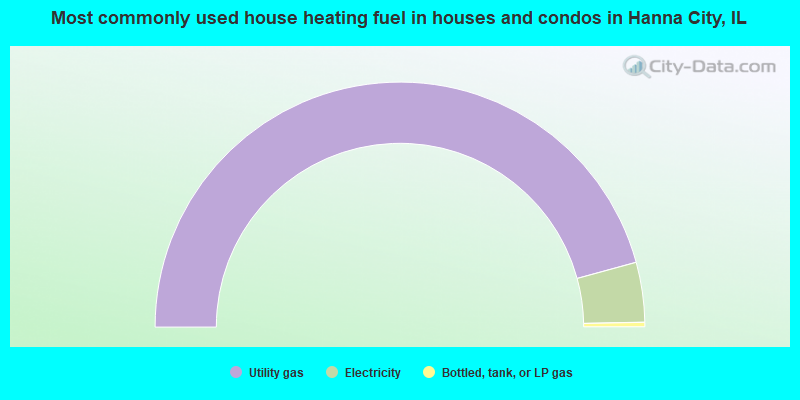
- 91.5%Utility gas
- 7.9%Electricity
- 0.6%Bottled, tank, or LP gas
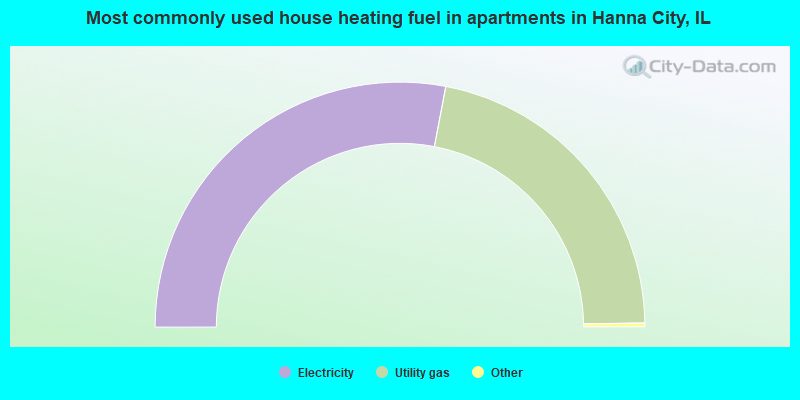
- 56.3%Electricity
- 43.7%Utility gas
Private vs. public school enrollment:
| Here: | 7.0% |
| Illinois: | 13.3% |
| Here: | 23.9% |
| Illinois: | 9.9% |
| Here: | 23.4% |
| Illinois: | 27.4% |


