Hannibal, MO (Missouri) Houses and Residents
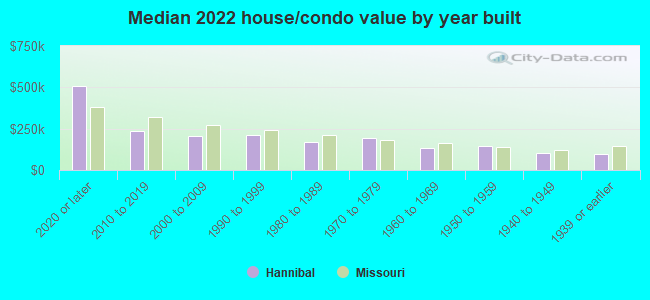
| Hannibal: | $140,774 |
| Missouri: | $221,200 |
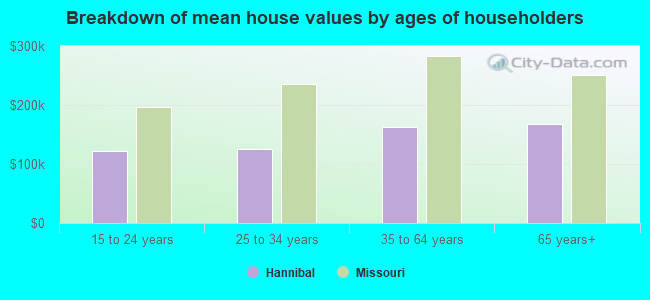
Mean price in 2022:
Detached houses: $162,915
Here: $162,915 State: $278,068 Townhouses or other attached units: $152,490
Here: $152,490 State: $260,773 In 2-unit structures: $113,485
Here: $113,485 State: $172,667 In 3-to-4-unit structures: $97,465
Here: $97,465 State: $181,162 Mobile homes: $20,912
Here: $20,912 State: $95,912
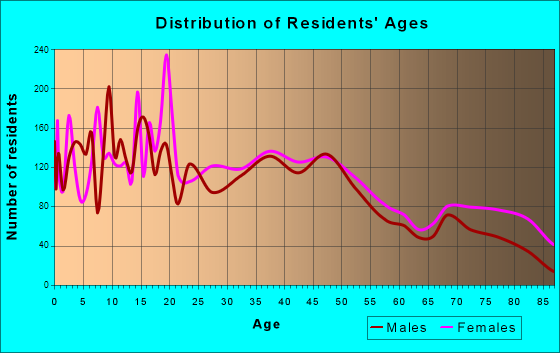
Total population: 17,893 (Urban population: 17,025 (all inside urban clusters), Rural population: 905 (24 farm, 881 nonfarm))
Houses: 7,826 (6,886 occupied: 4,318 owner occupied, 2,667 renter occupied)
| % of renters here: | 38% |
| State: | 32% |
Housing density: 536 houses/condos per square mile
Median price asked for vacant for-sale houses and condos in 2022: $249,571.
Median contract rent in 2022: $560 (lower quartile is $345, upper quartile is $735)
Median rent asked for vacant for-rent units in 2022: $621
Median gross rent in Hannibal, MO in 2022: $795
Housing units in Hannibal with a mortgage: 2,068 (99 second mortgage, 0 home equity loan, 37 both second mortgage and home equity loan)
Houses without a mortgage: 17
Median household income for houses/condos with a mortgage: $75,898
Median household income for apartments without a mortgage: $58,808
Median monthly housing costs: $707
Compare current foreclosures in Hannibal, MO:
| Photo | Address | Area | Beds / Baths | Price | Details |
|---|---|---|---|---|---|

|
#1
Volke St
Hannibal, MO 63401
|
1,499 sq. feet
|
1 baths 3 beds |
show details | |

|
#2
Rock St
Hannibal, MO 63401
|
1,887 sq. feet
|
1 baths 3 beds |
show details | |

|
#3
County Road 418
Hannibal, MO 63401
|
- sq. feet
|
- baths - beds |
show details | |

|
#4
Stardust Dr
Hannibal, MO 63401
|
- sq. feet
|
- baths - beds |
show details | |

|
#5
Saint Marys Ave
Hannibal, MO 63401
|
- sq. feet
|
- baths - beds |
show details | |

|
#6
Wellman St
Hannibal, MO 63401
|
- sq. feet
|
- baths - beds |
show details | |

|
#7
Country Club Dr
Hannibal, MO 63401
|
- sq. feet
|
- baths - beds |
show details | |

|
#8
Pioneer Trl
Hannibal, MO 63401
|
- sq. feet
|
- baths - beds |
show details | |

|
#9
Westgate Ln
Hannibal, MO 63401
|
- sq. feet
|
- baths - beds |
show details | |

|
#10
Center St
Hannibal, MO 63401
|
- sq. feet
|
- baths - beds |
show details |
| Photo | Address | Area | Beds / Baths | Price | Details |
|---|---|---|---|---|---|

|
#11
Clinic Rd
Hannibal, MO 63401
|
- sq. feet
|
- baths - beds |
show details | |

|
#12
Virginia St
Hannibal, MO 63401
|
- sq. feet
|
- baths - beds |
show details | |

|
#13
Saint Charles St # C
Hannibal, MO 63401
|
- sq. feet
|
- baths - beds |
show details | |

|
#14
W Ely Rd Apt 5
Hannibal, MO 63401
|
- sq. feet
|
- baths - beds |
show details | |

|
#15
Rensselaer Ln
Hannibal, MO 63401
|
- sq. feet
|
- baths - beds |
show details | |

|
#16
Rinker St
Hannibal, MO 63401
|
- sq. feet
|
- baths - beds |
show details | |

|
#17
Fulton Ave
Hannibal, MO 63401
|
- sq. feet
|
- baths - beds |
show details | |

|
#18
Fulton Ave
Hannibal, MO 63401
|
- sq. feet
|
- baths - beds |
show details | |

|
#19
Bailey Pl
Hannibal, MO 63401
|
- sq. feet
|
- baths - beds |
show details | |

|
#20
Stardust Dr
Hannibal, MO 63401
|
- sq. feet
|
- baths - beds |
show details |
| Photo | Address | Area | Beds / Baths | Price | Details |
|---|---|---|---|---|---|

|
#21
New London Gravel Rd
Hannibal, MO 63401
|
- sq. feet
|
- baths - beds |
show details | |

|
#22
36th St
Hannibal, MO 63401
|
- sq. feet
|
- baths - beds |
show details | |

|
#23
Bird St
Hannibal, MO 63401
|
- sq. feet
|
- baths - beds |
show details | |

|
#24
Rendlen Ave
Hannibal, MO 63401
|
- sq. feet
|
- baths - beds |
show details | |

|
#25
Rendlen Ave
Hannibal, MO 63401
|
- sq. feet
|
- baths - beds |
show details | |

|
#26
Lamb Ave
Hannibal, MO 63401
|
- sq. feet
|
- baths - beds |
show details | |

|
#27
N Hayden St
Hannibal, MO 63401
|
- sq. feet
|
- baths - beds |
show details | |

|
#28
County Road 412
Hannibal, MO 63401
|
- sq. feet
|
- baths - beds |
show details | |

|
#29
Central Ave
Hannibal, MO 63401
|
- sq. feet
|
- baths - beds |
show details | |

|
#30
Saint Marys Ave
Hannibal, MO 63401
|
- sq. feet
|
- baths - beds |
show details |
| Photo | Address | Area | Beds / Baths | Price | Details |
|---|---|---|---|---|---|

|
#31
Bird St
Hannibal, MO 63401
|
- sq. feet
|
- baths - beds |
show details | |

|
#32
Market St
Hannibal, MO 63401
|
- sq. feet
|
- baths - beds |
show details | |

|
#33
Surrey Hills Rd
Hannibal, MO 63401
|
- sq. feet
|
- baths - beds |
show details | |

|
Check over 1 million property listings on Foreclosure.com!
|
browse all offers | |||

Latest news about housing in Hannibal, MO collected exclusively by city-data.com from local newspapers, TV, and radio stations

 | Always nice to come home to Missouri.... (57 replies) |
| Is the ‘Midwesternness’ of Northern Missouri overstated? (99 replies) |
| What makes Missouri "Misery"? (109 replies) |
| Branson is slowly dying!!! (242 replies) |
| How "southern" is Kansas City? (188 replies) |
| Missouri Outlaw History (3407 replies) |
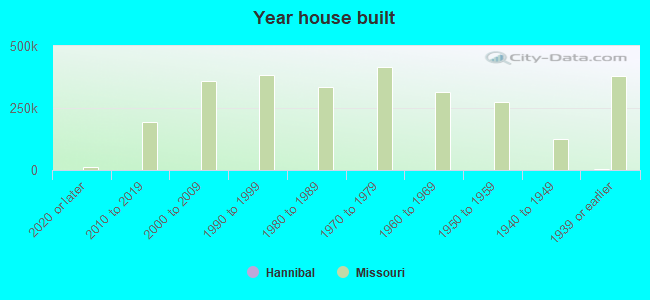
Median year apartment built: 1973
Household type by relationship:
Households: 17,068- Male householders: 2,948 (855 living alone), Female householders: 3,887 (1,542 living alone)
2,751 spouses (2,729 opposite-sex spouses), 582 unmarried partners, (487 opposite-sex unmarried partners), 4,496 children (3,924 natural, 126 adopted, 444 stepchildren), 349 grandchildren, 109 brothers or sisters, 155 parents, 42 foster children, 173 other relatives, 342 non-relatives
- In group quarters: 1,229
Size of family households: 2,001 2-persons, 876 3-persons, 672 4-persons, 346 5-persons, 209 6-persons, 85 7-or-more-persons.
Size of nonfamily households: 2,481 1-person, 253 2-persons, 61 3-persons.
1,950 married couples with children.
1,528 single-parent households (367 men, 1,161 women).
99.4% of residents of Hannibal speak English at home.
0.3% of residents speak Spanish at home (53% speak English very well, 13% speak English not well, 33% don't speak English at all).
0.3% of residents speak other Indo-European language at home (86% speak English very well, 14% speak English well).
Foreign born population: 158 (0.9%)
(48.7% of them are naturalized citizens)
| Here: | 6.2 |
| State: | 6.4 |
| Here: | 4.9 |
| State: | 4.4 |
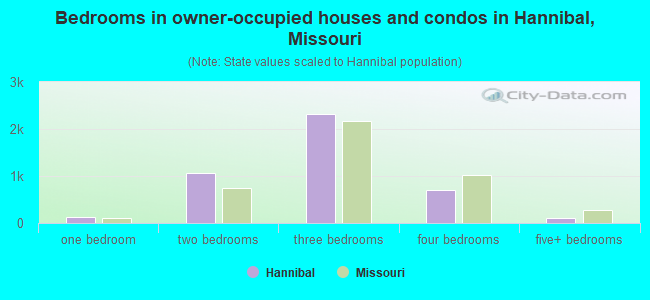
- Bedrooms in owner-occupied houses and condos in Hannibal, Missouri
- 0no bedroom
- 1181 bedroom
- 1,0542 bedrooms
- 2,3293 bedrooms
- 7094 bedrooms
- 1105+ bedrooms
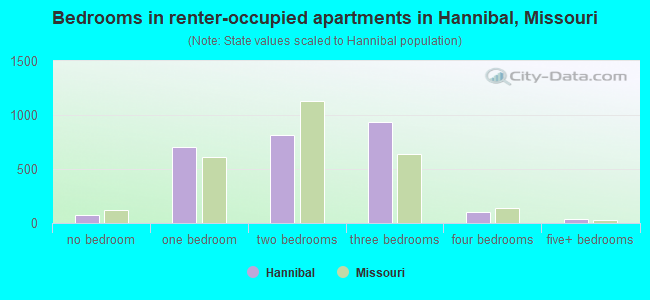
- Bedrooms in renter-occupied apartments in Hannibal, Missouri
- 74no bedroom
- 7021 bedroom
- 8172 bedrooms
- 9383 bedrooms
- 1024 bedrooms
- 365+ bedrooms
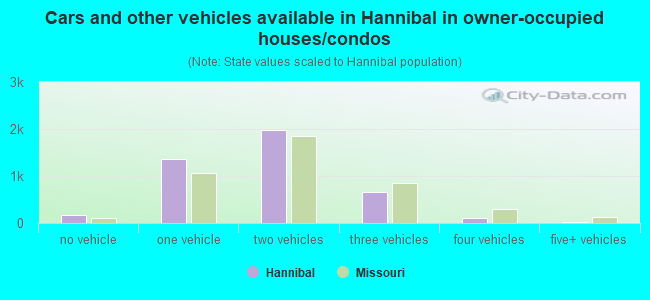
- Cars and other vehicles available in Hannibal in owner-occupied houses/condos
- 180no vehicle
- 1,3691 vehicle
- 1,9722 vehicles
- 6703 vehicles
- 1044 vehicles
- 255+ vehicles
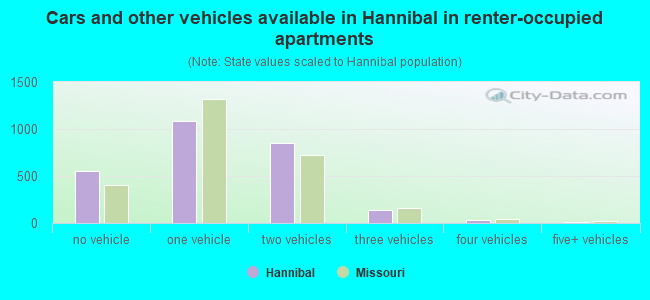
- Cars and other vehicles available in Hannibal in renter-occupied apartments
- 555no vehicle
- 1,0801 vehicle
- 8532 vehicles
- 1363 vehicles
- 344 vehicles
- 85+ vehicles
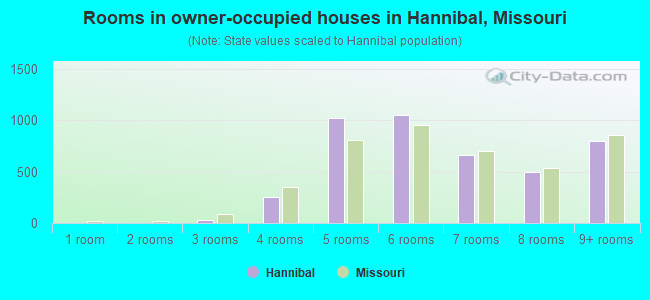
- Rooms in owner-occupied houses in Hannibal, Missouri
- 01 room
- 02 rooms
- 283 rooms
- 2504 rooms
- 1,0265 rooms
- 1,0546 rooms
- 6637 rooms
- 4948 rooms
- 8049+ rooms
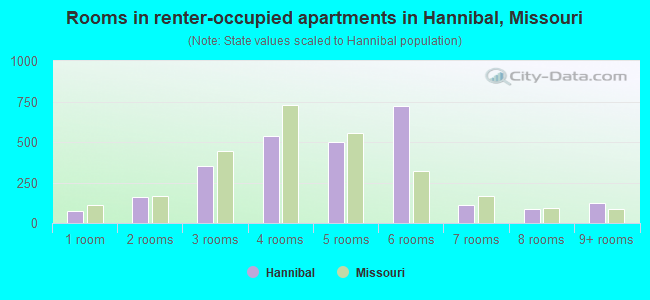
- Rooms in renter-occupied apartments in Hannibal, Missouri
- 741 room
- 1612 rooms
- 3533 rooms
- 5374 rooms
- 5005 rooms
- 7236 rooms
- 1107 rooms
- 898 rooms
- 1219+ rooms
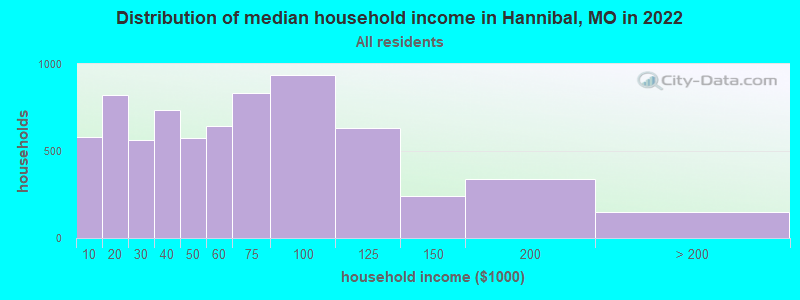
Hannibal, MO household income distribution

- 583Less than $10,000
- 820$10,000 to $19,999
- 565$20,000 to $29,999
- 736$30,000 to $39,999
- 573$40,000 to $49,999
- 641$50,000 to $59,999
- 834$60,000 to $74,999
- 936$75,000 to $99,999
- 633$100,000 to $124,999
- 243$125,000 to $149,999
- 340$150,000 to $199,999
- 147$200,000 or more
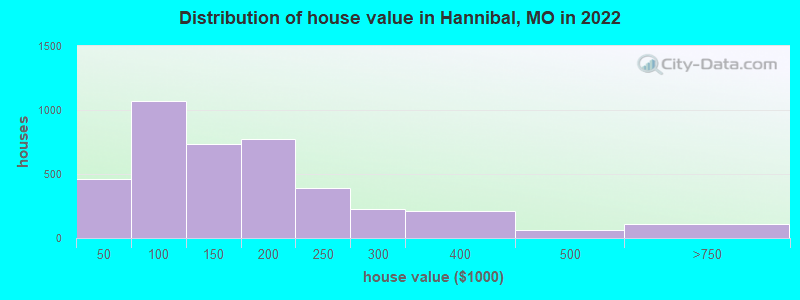
Home value of owner - occupied houses in 2022 in Hannibal, MO
-
- 38Less than $10,000
- 89$10,000 to $14,999
- 77$15,000 to $19,999
- 77$20,000 to $24,999
- 19$25,000 to $29,999
- 12$30,000 to $34,999
- 97$35,000 to $39,999
- 47$40,000 to $49,999
- 106$50,000 to $59,999
- 282$60,000 to $69,999
- 203$70,000 to $79,999
- 262$80,000 to $89,999
- 166$90,000 to $99,999
- 404$100,000 to $124,999
- 332$125,000 to $149,999
- 441$150,000 to $174,999
- 330$175,000 to $199,999
- 394$200,000 to $249,999
- 230$250,000 to $299,999
- 212$300,000 to $399,999
- 60$400,000 to $499,999
- 88$500,000 to $749,999
- 7$750,000 to $999,999
- 11$1,500,000 to $1,999,999
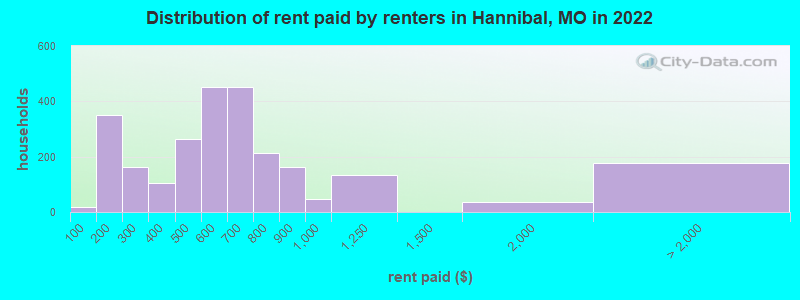
Rent paid by renters in 2022 in Hannibal, MO
-
- 18Less than $100
- 201$100 to $149
- 149$150 to $199
- 73$200 to $249
- 87$250 to $299
- 79$300 to $349
- 26$350 to $399
- 39$400 to $449
- 225$450 to $499
- 269$500 to $549
- 182$550 to $599
- 280$600 to $649
- 170$650 to $699
- 85$700 to $749
- 129$750 to $799
- 160$800 to $899
- 47$900 to $999
- 132$1,000 to $1,249
- 35$1,500 to $1,999
- 177No cash rent
Percentage of workers working in this county: 77.4%
Number of people working at home: 475 (6.4% of all workers)
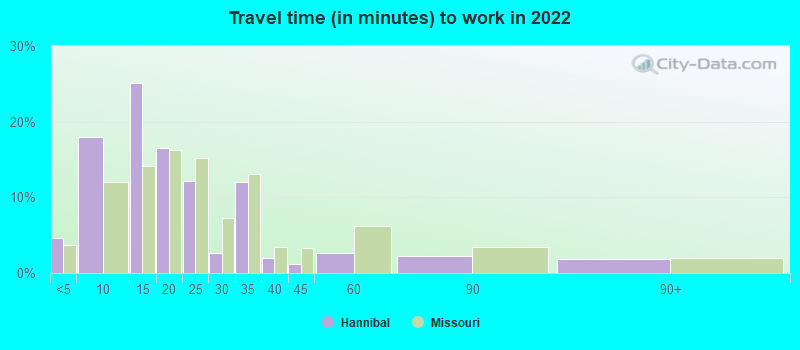
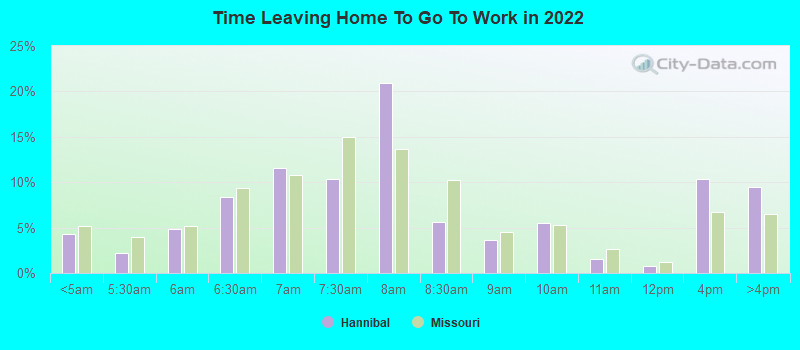
Travel time to work (commute)
- Less than 5 minutes: 408
- 5 to 9 minutes: 1,698
- 10 to 14 minutes: 2,080
- 15 to 19 minutes: 893
- 20 to 24 minutes: 524
- 25 to 29 minutes: 197
- 30 to 34 minutes: 561
- 35 to 39 minutes: 80
- 40 to 44 minutes: 90
- 45 to 59 minutes: 96
- 60 to 89 minutes: 161
- 90 or more minutes: 61
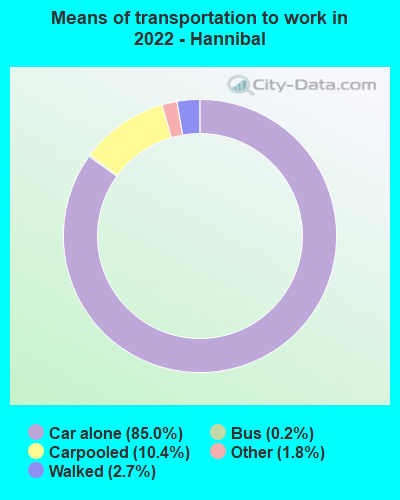
Means of transportation to work:
- Drove a car alone: 8,899 (79.6%)
- Carpooled: 1,099 (9.8%)
- Bus: 15 (0.1%)
- Taxi: 194 (1.7%)
- Walked: 264 (2.4%)
- Worked at home: 475 (4.2%)
- Unemployment by race in 2022
- Unemployment rate for White non-Hispanic residents
- 3.5%Males
- 2.5%Females
- Unemployment rate for Black residents
- 8.5%Males
- 10.9%Females
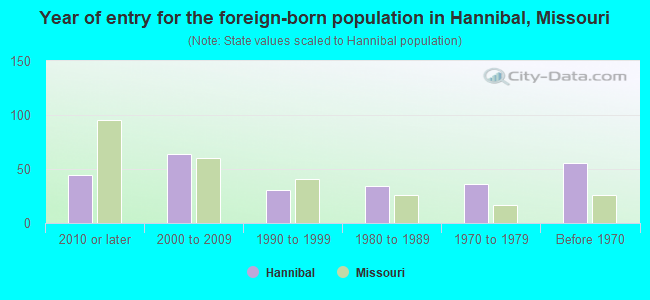
- Year of entry for the foreign-born population in Hannibal, Missouri
- 442010 or later
- 642000 to 2009
- 311990 to 1999
- 341980 to 1989
- 361970 to 1979
- 56Before 1970
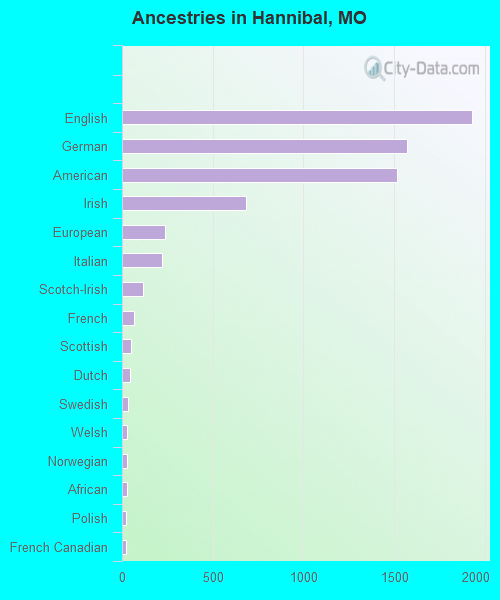
First ancestries reported:
- English: 1,926 (25.1%)
- German: 1,568 (20.5%)
- American: 1,518 (19.8%)
- Irish: 685 (8.9%)
- European: 236 (3.1%)
- Italian: 221 (2.9%)
- Scotch-Irish: 118 (1.5%)
- French: 67 (0.9%)
- Scottish: 47 (0.6%)
- Dutch: 46 (0.6%)
- Swedish: 34 (0.4%)
- Welsh: 30 (0.4%)
- Norwegian: 28 (0.4%)
- African: 27 (0.4%)
- Polish: 22 (0.3%)
- French Canadian: 21 (0.3%)
- Ukrainian: 13 (0.2%)
- Hungarian: 11 (0.1%)
- Northern European: 8 (0.1%)
- Swiss: 7 (0.09%)
- Austrian: 6 (0.08%)
- Scandinavian: 6 (0.08%)
- British: 5 (0.07%)
- Finnish: 4 (0.05%)
- Russian: 4 (0.05%)
- Ethiopian: 4 (0.05%)
Most common places of birth for foreign-born residents (%):
| Hannibal: | 27.8% (44) |
| Missouri: | 8.9% (22,932) |
| Hannibal: | 24.1% (38) |
| Missouri: | 0.5% (1,233) |
| Hannibal: | 15.2% (24) |
| Missouri: | 6.6% (17,002) |
| Hannibal: | 8.9% (14) |
| Missouri: | 14.9% (38,568) |
| Hannibal: | 7.6% (12) |
| Missouri: | 0.6% (1,519) |
| Hannibal: | 5.7% (9) |
| Missouri: | 3.0% (7,803) |
| Hannibal: | 3.8% (6) |
| Missouri: | 0.8% (2,138) |
Place of birth for U.S.-born residents:
- This state: 12,294
- Other state: 4,566
- Northeast: 104
- Midwest: 3,128
- South: 767
- West: 556
86.2% of Hannibal residents lived in the same house 1 years ago.
Out of people who lived in different houses, 25.4% lived in this county.
Out of people who lived in different counties, 67.8% lived in Missouri.
| Hannibal: | 86.2% |
| State average: | 87.1% |
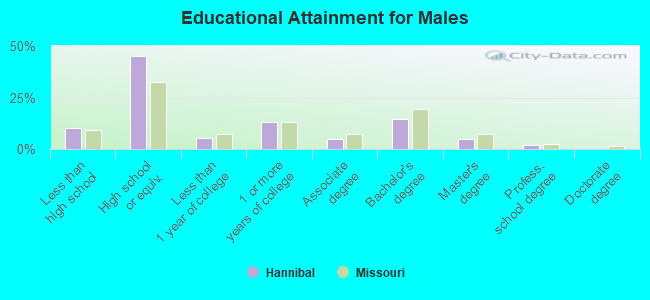
Education attainment for males 25 years and older:
- No schooling: 132
- Nursery to 4th grade: 4
- 5th and 6th grade: 10
- 7th and 8th grade: 62
- 9th grade: 38
- 10th grade: 131
- 11th grade: 80
- 12th grade, no diploma: 83
- High school graduate (or equivalency): 2,401
- Less than 1 year of college: 297
- Some college more than 1 year, no degree: 700
- Associate degree: 251
- Bachelor's degree: 780
- Master's degree: 247
- Professional school degree: 102
- Doctorate degree: 4
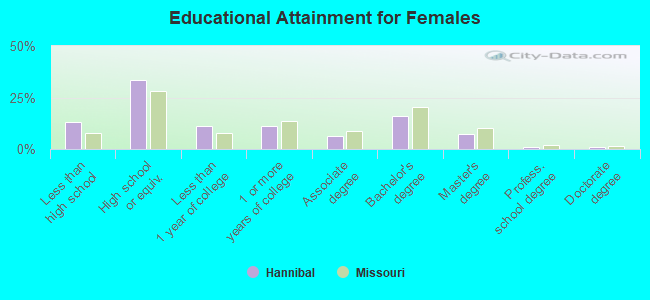
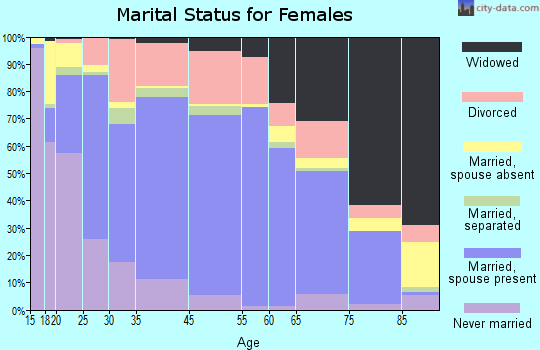
Education attainment for females 25 years and older:
- No schooling: 86
- Nursery to 4th grade: 0
- 5th and 6th grade: 0
- 7th and 8th grade: 132
- 9th grade: 63
- 10th grade: 203
- 11th grade: 229
- 12th grade, no diploma: 66
- High school graduate (or equivalency): 2,012
- Less than 1 year of college: 666
- Some college more than 1 year, no degree: 660
- Associate degree: 382
- Bachelor's degree: 954
- Master's degree: 436
- Professional school degree: 60
- Doctorate degree: 53
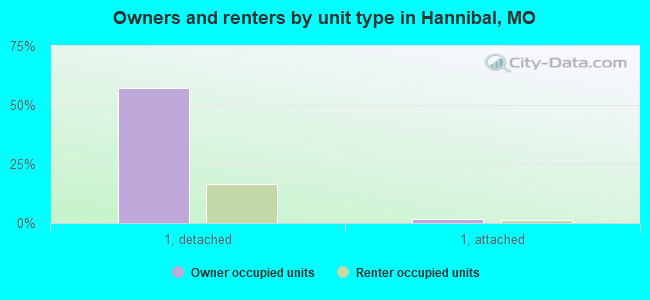
Housing units in structures:
- One, detached: 5,713
- One, attached: 210
- Two: 580
- 3 or 4: 435
- 5 to 9: 191
- 10 to 19: 113
- 20 to 49: 257
- 50 or more: 136
- Mobile homes: 188
Median worth of mobile homes: $15,584
Housing units lacking complete kitchen facilities in 2022: 4.1%
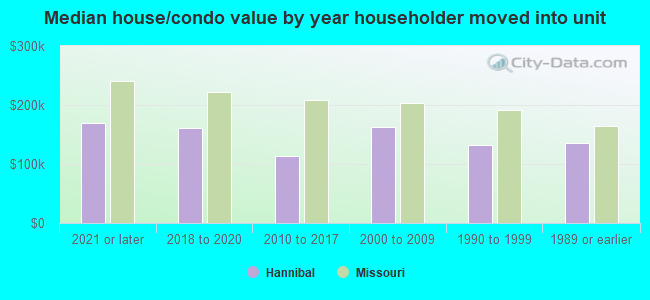
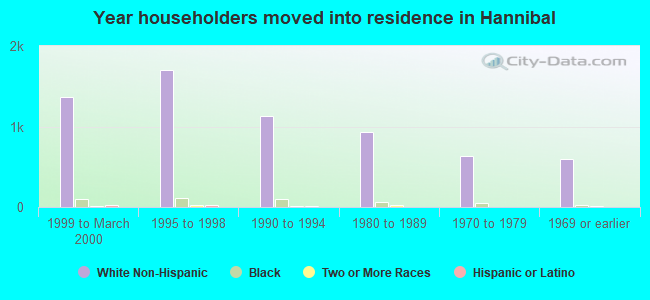
House/condo owner moved in on average 14 years ago
Renter moved in on average 2 years ago
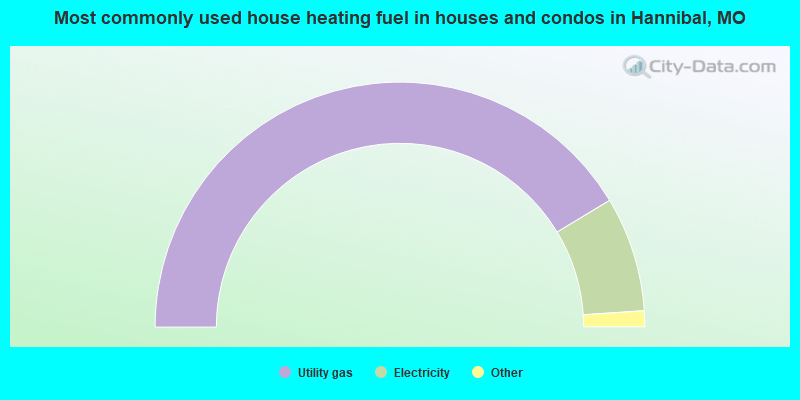
- 82.7%Utility gas
- 15.2%Electricity
- 0.9%Wood
- 0.7%Bottled, tank, or LP gas
- 0.2%Other fuel
- 0.2%No fuel used

- 52.0%Electricity
- 47.5%Utility gas
- 0.5%Other fuel
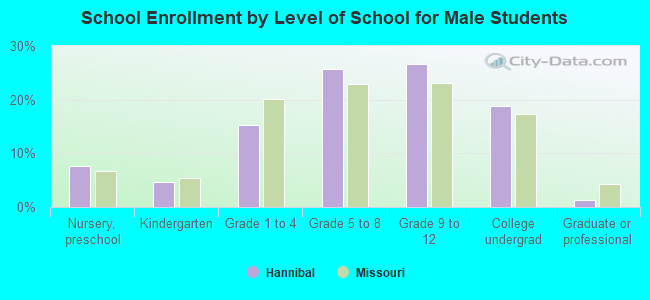
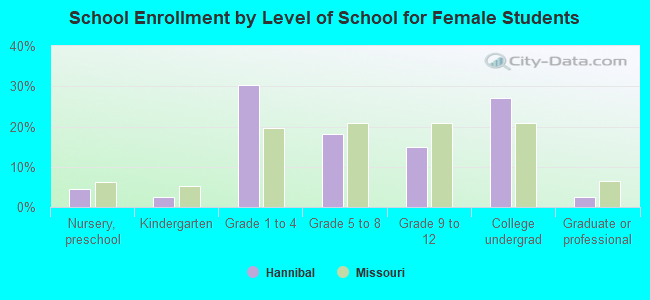
Private vs. public school enrollment:
| Here: | 6.1% |
| Missouri: | 15.4% |
| Here: | 5.3% |
| Missouri: | 13.9% |
| Here: | 63.2% |
| Missouri: | 22.6% |