Hanover Park, IL (Illinois) Houses and Residents
Estimated median house or condo value in 2022: $249,690 (it was $139,900 in 2000 )
Hanover Park:
$249,690Illinois:
$251,600
Lower value quartile - upper value quartile: $199,602 - $291,776Mean price in 2022: Detached houses: $278,432 Here:
$278,432State:
$310,164
Townhouses or other attached units: $188,126 Here:
$188,126State:
$286,230
In 2-unit structures: $280,390 Here:
$280,390State:
$299,638
In 3-to-4-unit structures: $145,653 Here:
$145,653State:
$330,907
In 5-or-more-unit structures: $174,977 Here:
$174,977State:
$318,887
Total population: 38,476 (Urban population: 38,366, Rural population: 0)
Houses: 11,567 (11,169 occupied: 8,412 owner occupied, 2,768 renter occupied )
% of renters here:
25%State:
33%
Housing density: 1,703 houses/condos per square mile
Median price asked for vacant for-sale houses and condos in 2022: $216,833.
Median contract rent in 2022: $1,256 (lower quartile is $1,049, upper quartile is $1,628)
Median rent asked for vacant for-rent units in 2022: $7,684
Median gross rent in Hanover Park, IL in 2022: $1,404
Housing units in Hanover Park with a mortgage: 5,950 (534 second mortgage, 56 home equity loan, 423 both second mortgage and home equity loan )Houses without a mortgage: 245
Median household income for houses/condos with a mortgage: $106,381
Median household income for apartments without a mortgage: $76,283
Median monthly housing costs: $1,461
Data:
Median house or condo value ($)
Median house or condo value ($ change since 2000)
Median house or condo value ($) - White
Median house or condo value ($) - Black or African American
Median house or condo value ($) - Asian
Median house or condo value ($) - Hispanic or Latino
Median house or condo value ($) - American Indian and Alaska Native
Median house or condo value ($) - Multirace
Median house or condo value ($) - Other Race
Median price asked for mobile homes ($)
Household density (households per square mile)
Mean house or condo value by units in structure - 1, detached ($)
Mean house or condo value by units in structure - 1, attached ($)
Mean house or condo value by units in structure - 2 ($)
Mean house or condo value by units in structure by units in structure - 3 or 4 ($)
Mean house or condo value by units in structure - 5 or more ($)
Mean house or condo value by units in structure - Boat, RV, van, etc. ($)
Mean house or condo value by units in structure - Mobile home ($)
Median contract rent ($)
Median contract rent - Lower quartile ($)
Median contract rent - Upper quartile ($)
Median gross rent ($)
Urban houses (%)
Rural houses (%)
Houses occupied (%)
Houses occupied (% change since 2000)
Houses owner occupied (%)
Houses owner occupied (% change since 2000)
Houses renter occupied (%)
Houses renter occupied (% change since 2000)
Vacant housing units - For rent (%)
Vacant housing units - For rent (% change since 2000)
Vacant housing units - For sale only (%)
Vacant housing units - For sale only (% change since 2000)
Vacant housing units - Rented or sold, not occupied (%)
Vacant housing units - Rented or sold, not occupied (% change since 2000)
Vacant housing units - For seasonal, recreational, or occasional use (%)
Vacant housing units - For seasonal, recreational, or occasional use (% change since 2000)
Vacant housing units - For migrant workers (%)
Vacant housing units - For migrant workers (% change since 2000)
Vacant housing units - Other vacant (%)
Vacant housing units - Other vacant (% change since 2000)
Median monthly housing costs ($)
Median household income for houses/condos with a mortgage ($)
Median household income for houses/condos without a mortgage ($)
Median household income ($)
Median household income ($) - White
Median household income ($) - Black or African American
Median household income ($) - Asian
Median household income ($) - Hispanic or Latino
Median household income ($) - American Indian and Alaska Native
Median household income ($) - Multirace
Median household income ($) - Other Race
Mortgage status - with mortgage (%)
Mortgage status - with second mortgage (%)
Mortgage status - with home equity loan (%)
Mortgage status - with both second mortgage and home equity loan (%)
Mortgage status - without a mortgage (%)
Median year house/condo built
Median year apartment built
Household type by relationship - Male householder living alone (%)
Household type by relationship - Male householder not living alone (%)
Household type by relationship - Female householder living alone (%)
Household type by relationship - Female householder not living alone (%)
Household type by relationship - Opposite-Sex spouse (%)
Household type by relationship - Same-Sex spouse (%)
Household type by relationship - Opposite-Sex unmarried partner (%)
Household type by relationship - Same-Sex unmarried partner (%)
Household type by relationship - In group quarters (%)
Size of family households - 2-person household (%)
Size of family households - 3-person household (%)
Size of family households - 4-person household (%)
Size of family households - 5-person household (%)
Size of family households - 6-person household (%)
Size of family households - 7-or-more-person household (%)
Size of nonfamily households - 1-person household (%)
Size of nonfamily households - 2-person household (%)
Size of nonfamily households - 3-person household (%)
Size of nonfamily households - 4-person household (%)
Size of nonfamily households - 5-person household (%)
Size of nonfamily households - 6-person household (%)
Size of nonfamily households - 7-or-moreperson household (%)
Year house built - Built 2010 or later (%)
Year house built - Built 2000 to 2009 (%)
Year house built - Built 1990 to 1999 (%)
Year house built - Built 1980 to 1989 (%)
Year house built - Built 1970 to 1979 (%)
Year house built - Built 1960 to 1969 (%)
Year house built - Built 1950 to 1959 (%)
Year house built - Built 1940 to 1949 (%)
Year house built - Built 1939 or earlier (%)
Median number of rooms in houses and condos
Median number of rooms in apartments
Median number of bedrooms in owner occupied houses
Mean number of bedrooms in owner occupied houses
Median number of bedrooms in renter occupied houses
Mean number of bedrooms in renter occupied houses
Median number of vehichles in owner occupied houses
Mean number of vehichles in owner occupied houses
Median number of vehichles in renter occupied houses
Mean number of vehichles in renter occupied houses
Rooms in owner-occupied houses - 1 room (%)
Rooms in owner-occupied houses - 2 rooms (%)
Rooms in owner-occupied houses - 3 rooms (%)
Rooms in owner-occupied houses - 4 rooms (%)
Rooms in owner-occupied houses - 5 rooms (%)
Rooms in owner-occupied houses - 6 rooms (%)
Rooms in owner-occupied houses - 7 rooms (%)
Rooms in owner-occupied houses - 8 rooms (%)
Rooms in owner-occupied houses - 9+ rooms (%)
Rooms in renter-occupied houses - 1 room (%)
Rooms in renter-occupied houses - 2 rooms (%)
Rooms in renter-occupied houses - 3 rooms (%)
Rooms in renter-occupied houses - 4 rooms (%)
Rooms in renter-occupied houses - 5 rooms (%)
Rooms in renter-occupied houses - 6 rooms (%)
Rooms in renter-occupied houses - 7 rooms (%)
Rooms in renter-occupied houses - 8 rooms (%)
Rooms in renter-occupied houses - 9+ rooms (%)
Bedrooms in owner-occupied houses - no bedrooms (%)
Bedrooms in owner-occupied houses - 1 bedroom (%)
Bedrooms in owner-occupied houses - 2 bedrooms (%)
Bedrooms in owner-occupied houses - 3 bedrooms (%)
Bedrooms in owner-occupied houses - 4 bedrooms (%)
Bedrooms in owner-occupied houses - 5+ bedrooms (%)
Bedrooms in renter-occupied houses - no bedrooms (%)
Bedrooms in renter-occupied houses - 1 bedroom (%)
Bedrooms in renter-occupied houses - 2 bedrooms (%)
Bedrooms in renter-occupied houses - 3 bedrooms (%)
Bedrooms in renter-occupied houses - 4 bedrooms (%)
Bedrooms in renter-occupied houses - 5+ bedrooms (%)
Vehicles available in owner-occupied houses - no vehicle available (%)
Vehicles available in owner-occupied houses - 1 vehicle available(%)
Vehicles available in owner-occupied houses - 2 Vehicles available (%)
Vehicles available in owner-occupied houses - 3 Vehicles available (%)
Vehicles available in owner-occupied houses - 4 Vehicles available (%)
Vehicles available in owner-occupied houses - 5+ Vehicles available (%)
Vehicles available in renter-occupied houses - no vehicle available (%)
Vehicles available in renter-occupied houses - 1 vehicle available (%)
Vehicles available in renter-occupied houses - 2 Vehicles available (%)
Vehicles available in renter-occupied houses - 3 Vehicles available (%)
Vehicles available in renter-occupied houses - 4 Vehicles available (%)
Vehicles available in renter-occupied houses - 5+ Vehicles available (%)
Housing units in structures - 1, detached (%)
Housing units in structures - 1, attached (%)
Housing units in structures - 2 (%)
Housing units in structures - 3 or 4 (%)
Housing units in structures - 5 to 9 (%)
Housing units in structures - 10 to 19 (%)
Housing units in structures - 20 to 49 (%)
Housing units in structures - 50 or more (%)
Housing units in structures - Mobile home (%)
Housing units in structures - Boat, RV, van, etc. (%)
Housing units in structures - Owners - 1, detached (%)
Housing units in structures - Owners - 1, attached (%)
Housing units in structures - Owners - 2 (%)
Housing units in structures - Owners - 3 or 4 (%)
Housing units in structures - Owners - 5 to 9 (%)
Housing units in structures - Owners - 10 to 19 (%)
Housing units in structures - Owners - 20 to 49 (%)
Housing units in structures - Owners - 50 or more (%)
Housing units in structures - Owners - Mobile home (%)
Housing units in structures - Owners - Boat, RV, van, etc. (%)
Housing units in structures - Renters - 1, detached (%)
Housing units in structures - Renters - 1, attached (%)
Housing units in structures - Renters - 2 (%)
Housing units in structures - Renters - 3 or 4 (%)
Housing units in structures - Renters - 5 to 9 (%)
Housing units in structures - Renters - 10 to 19 (%)
Housing units in structures - Renters - 20 to 49 (%)
Housing units in structures - Renters - 50 or more (%)
Housing units in structures - Renters - Mobile home (%)
Housing units in structures - Renters - Boat, RV, van, etc. (%)
House/condo owner moved in on average (years ago)
Renter moved in on average (years ago)
Year householder moved into unit - Moved in 1999 to March 2000 (%)
Year householder moved into unit - Moved in 1999 to March 2000 (%) - White
Year householder moved into unit - Moved in 1999 to March 2000 (%) - Black or African American
Year householder moved into unit - Moved in 1999 to March 2000 (%) - Asian
Year householder moved into unit - Moved in 1999 to March 2000 (%) - Hispanic or Latino
Year householder moved into unit - Moved in 1999 to March 2000 (%) - American Indian and Alaska Native
Year householder moved into unit - Moved in 1999 to March 2000 (%) - Multirace
Year householder moved into unit - Moved in 1999 to March 2000 (%) - Other Race
Year householder moved into unit - Moved in 1995 to 1998 (%)
Year householder moved into unit - Moved in 1995 to 1998 (%) - White
Year householder moved into unit - Moved in 1995 to 1998 (%) - Black or African American
Year householder moved into unit - Moved in 1995 to 1998 (%) - Asian
Year householder moved into unit - Moved in 1995 to 1998 (%) - Hispanic or Latino
Year householder moved into unit - Moved in 1995 to 1998 (%) - American Indian and Alaska Native
Year householder moved into unit - Moved in 1995 to 1998 (%) - Multirace
Year householder moved into unit - Moved in 1995 to 1998 (%) - Other Race
Year householder moved into unit - Moved in 1990 to 1994 (%)
Year householder moved into unit - Moved in 1990 to 1994 (%) - White
Year householder moved into unit - Moved in 1990 to 1994 (%) - Black or African American
Year householder moved into unit - Moved in 1990 to 1994 (%) - Asian
Year householder moved into unit - Moved in 1990 to 1994 (%) - Hispanic or Latino
Year householder moved into unit - Moved in 1990 to 1994 (%) - American Indian and Alaska Native
Year householder moved into unit - Moved in 1990 to 1994 (%) - Multirace
Year householder moved into unit - Moved in 1990 to 1994 (%) - Other Race
Year householder moved into unit - Moved in 1980 to 1989 (%)
Year householder moved into unit - Moved in 1980 to 1989 (%) - White
Year householder moved into unit - Moved in 1980 to 1989 (%) - Black or African American
Year householder moved into unit - Moved in 1980 to 1989 (%) - Asian
Year householder moved into unit - Moved in 1980 to 1989 (%) - Hispanic or Latino
Year householder moved into unit - Moved in 1980 to 1989 (%) - American Indian and Alaska Native
Year householder moved into unit - Moved in 1980 to 1989 (%) - Multirace
Year householder moved into unit - Moved in 1980 to 1989 (%) - Other Race
Year householder moved into unit - Moved in 1970 to 1979 (%)
Year householder moved into unit - Moved in 1970 to 1979 (%) - White
Year householder moved into unit - Moved in 1970 to 1979 (%) - Black or African American
Year householder moved into unit - Moved in 1970 to 1979 (%) - Asian
Year householder moved into unit - Moved in 1970 to 1979 (%) - Hispanic or Latino
Year householder moved into unit - Moved in 1970 to 1979 (%) - American Indian and Alaska Native
Year householder moved into unit - Moved in 1970 to 1979 (%) - Multirace
Year householder moved into unit - Moved in 1970 to 1979 (%) - Other Race
Year householder moved into unit - Moved in 1969 or earlier (%)
Year householder moved into unit - Moved in 1969 or earlier (%) - White
Year householder moved into unit - Moved in 1969 or earlier (%) - Black or African American
Year householder moved into unit - Moved in 1969 or earlier (%) - Asian
Year householder moved into unit - Moved in 1969 or earlier (%) - Hispanic or Latino
Year householder moved into unit - Moved in 1969 or earlier (%) - American Indian and Alaska Native
Year householder moved into unit - Moved in 1969 or earlier (%) - Multirace
Year householder moved into unit - Moved in 1969 or earlier (%) - Other Race
Housing units lacking complete plumbing facilities (%)
Housing units lacking complete kitchen facilities (%)
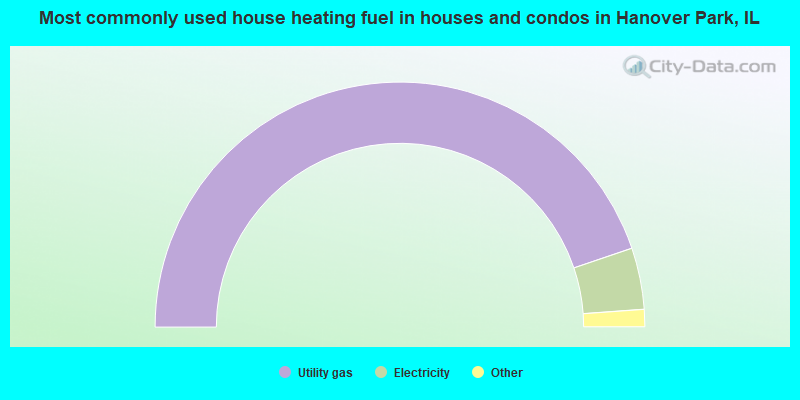
House heating fuel used in houses and condos - Utility gas (%)
House heating fuel used in houses and condos - Bottled, tank, or LP gas (%)
House heating fuel used in houses and condos - Electricity (%)
House heating fuel used in houses and condos - Fuel oil, kerosene, etc. (%)
House heating fuel used in houses and condos - Coal or coke (%)
House heating fuel used in houses and condos - Wood (%)
House heating fuel used in houses and condos - Solar energy (%)
House heating fuel used in houses and condos - Other fuel (%)
House heating fuel used in houses and condos - No fuel used (%)
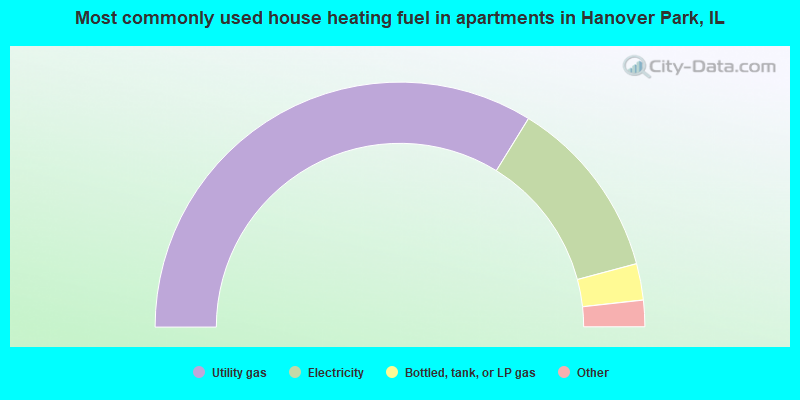
House heating fuel used in apartments - Utility gas (%)
House heating fuel used in apartments - Bottled, tank, or LP gas (%)
House heating fuel used in apartments - Electricity (%)
House heating fuel used in apartments - Fuel oil, kerosene, etc. (%)
House heating fuel used in apartments - Coal or coke (%)
House heating fuel used in apartments - Wood (%)
House heating fuel used in apartments - Solar energy (%)
House heating fuel used in apartments - Other fuel (%)
House heating fuel used in apartments - No fuel used (%)
Median year house/condo built: 1976Median year apartment built: 1976Household type by relationship:
Households: 36,835
Male householders: 6,082 (641 living alone ), Female householders: 4,915 (865 living alone )6,302 spouses (6,302 opposite-sex spouses ), 766 unmarried partners , (748 opposite-sex unmarried partners ), 13,190 children (12,519 natural , 67 adopted , 603 stepchildren ), 794 grandchildren , 1,030 brothers or sisters , 1,466 parents , 16 foster children , 1,376 other relatives , 879 non-relatives In group quarters: 12
Size of family households: 3,035 2-persons , 1,938 3-persons , 1,838 4-persons , 911 5-persons , 600 6-persons , 843 7-or-more-persons .
Size of nonfamily households: 1,562 1-person , 375 2-persons , 6 3-persons , 176 4-persons .
5,890 married couples with children. single-parent households (482 men , 1,650 women ).
43.9% of residents of Hanover Park speak English at home. of residents speak Spanish at home (53% speak English very well , 23% speak English well , 13% speak English not well , 11% don't speak English at all ).of residents speak other Indo-European language at home (64% speak English very well , 26% speak English well , 6% speak English not well , 4% don't speak English at all ).of residents speak Asian or Pacific Island language at home (45% speak English very well , 37% speak English well , 14% speak English not well , 4% don't speak English at all ).of residents speak other language at home (79% speak English very well , 10% speak English well , 11% speak English not well ).
Foreign born population: 12,984 (35.2%)of them are naturalized citizens )
Median number of rooms in houses and condos:
Median number of rooms in apartments
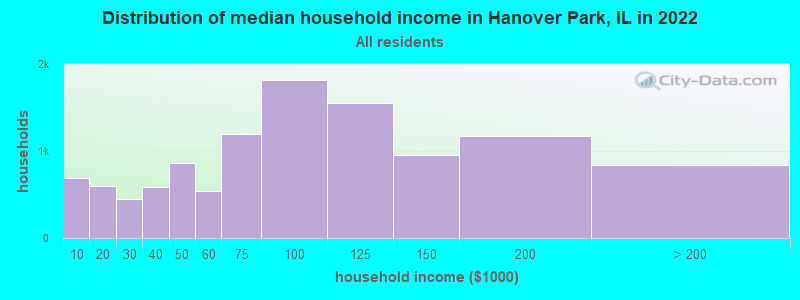
Hanover Park, IL household income distribution 693 Less than $10,000600 $10,000 to $19,999445 $20,000 to $29,999581 $30,000 to $39,999861 $40,000 to $49,999542 $50,000 to $59,9991,198 $60,000 to $74,9991,819 $75,000 to $99,9991,549 $100,000 to $124,999950 $125,000 to $149,9991,169 $150,000 to $199,999839 $200,000 or more
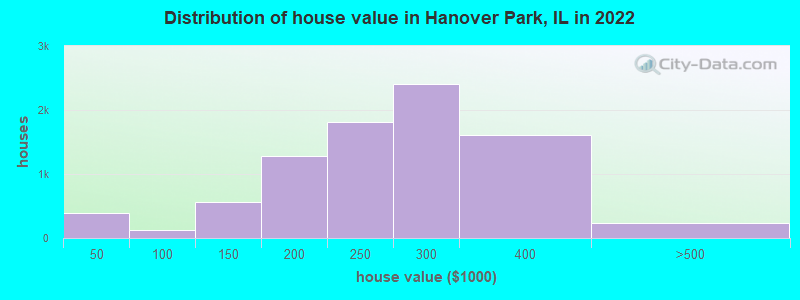
Home value of owner - occupied houses in 2022 in Hanover Park, IL 155 Less than $10,00072 $10,000 to $14,99916 $15,000 to $19,99976 $20,000 to $24,99932 $25,000 to $29,99916 $30,000 to $34,99914 $40,000 to $49,99918 $50,000 to $59,99923 $60,000 to $69,99954 $70,000 to $79,9994 $80,000 to $89,9997 $90,000 to $99,999273 $100,000 to $124,999293 $125,000 to $149,999608 $150,000 to $174,999669 $175,000 to $199,9991,816 $200,000 to $249,9992,400 $250,000 to $299,9991,615 $300,000 to $399,999220 $400,000 to $499,9997 $500,000 to $749,9998 $2,000,000 or moreRent paid by renters in 2022 in Hanover Park, IL 13 $250 to $2999 $300 to $3496 $350 to $3999 $650 to $69993 $800 to $899298 $900 to $999803 $1,000 to $1,249535 $1,250 to $1,499555 $1,500 to $1,999164 $2,000 to $2,49916 $2,500 to $2,99923 No cash rent
Percentage of workers working in this county: 64.0%Number of people working at home: 1,977 (11.1% of all workers )
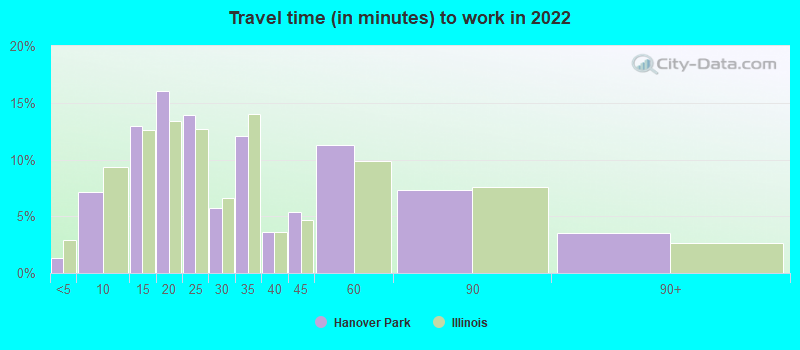
Travel time to work (commute)
Less than 5 minutes: 2175 to 9 minutes: 79610 to 14 minutes: 1,78715 to 19 minutes: 2,27820 to 24 minutes: 2,05125 to 29 minutes: 1,53030 to 34 minutes: 2,76935 to 39 minutes: 62740 to 44 minutes: 85245 to 59 minutes: 1,21560 to 89 minutes: 1,07890 or more minutes: 286
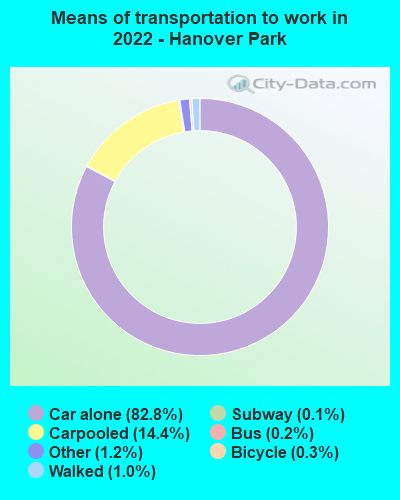
Means of transportation to work:
Drove a car alone: 6,049 (64.6%)Carpooled: 1,289 (13.8%)Bus : 24 (0.3%)Long-distance train or commuter rail : 8 (0.1%)Taxi: 99 (1.1%)Bicycle: 16 (0.2%)Walked: 69 (0.7%)Worked at home: 1,977 (21.1%)
Unemployment by race in 2022
Unemployment rate for White non-Hispanic residents 6.2% Males5.8% FemalesUnemployment rate for Black residents 11.2% Males13.1% FemalesUnemployment rate for American Indian and Alaska Native residents 8.8% MalesUnemployment rate for Asian residents 1.5% Males1.2% FemalesUnemployment rate for other race residents 5.3% Males6.1% FemalesUnemployment rate for two or more race residents 2.1% Males2.5% FemalesUnemployment rate for Hispanic or Latino residents 5.7% Males4.5% Females
Year of entry for the foreign-born population in Hanover Park, Illinois
4,420 2010 or later 2,899 2000 to 2009 2,372 1990 to 1999 3,262 1980 to 1989 1,759 1970 to 1979 703 Before 1970
First ancestries reported:
Polish: 1,190 (5.4%)
German: 607 (2.8%)
American: 501 (2.3%)
Italian: 434 (2.0%)
Somali: 367 (1.7%)
Irish: 318 (1.5%)
English: 179 (0.8%)
European: 177 (0.8%)
Swedish: 108 (0.5%)
Ukrainian: 101 (0.5%)
Greek: 79 (0.4%)
Ethiopian: 74 (0.3%)
Ghanaian: 68 (0.3%)
Dutch: 65 (0.3%)
Portuguese: 57 (0.3%)
Iraqi: 55 (0.3%)
Bulgarian: 55 (0.3%)
African: 54 (0.2%)
Albanian: 50 (0.2%)
Czech: 50 (0.2%)
Scandinavian: 44 (0.2%)
Hungarian: 40 (0.2%)
Egyptian: 30 (0.1%)
Czechoslovakian: 30 (0.1%)
Lithuanian: 25 (0.1%)
Palestinian: 24 (0.1%)
Norwegian: 23 (0.1%)
Yugoslavian: 22 (0.1%)
Eastern European: 20 (0.09%)
Nigerian: 19 (0.09%)
Serbian: 16 (0.07%)
French: 15 (0.07%)
Finnish: 14 (0.06%)
Russian: 14 (0.06%)
French Canadian: 11 (0.05%)
Trinidadian and Tobagonian: 11 (0.05%)
Romanian: 10 (0.05%)
Arab: 10 (0.05%)
British: 10 (0.05%)
Scottish: 7 (0.03%)
Canadian: 7 (0.03%)
Soviet Union: 6 (0.03%)
Slavic: 3 (0.01%) Most common places of birth for foreign-born residents (%): Mexico Hanover Park:
34.5% (4,508)Illinois:
34.7% (626,958)
India Hanover Park:
20.1% (2,627)Illinois:
9.2% (166,409)
Honduras Hanover Park:
7.8% (1,016)Illinois:
0.6% (10,762)
Pakistan Hanover Park:
7.2% (939)Illinois:
1.6% (29,519)
Philippines Hanover Park:
6.6% (864)Illinois:
5.2% (93,003)
Venezuela Hanover Park:
3.4% (447)Illinois:
0.5% (9,688)
Poland Hanover Park:
2.9% (382)Illinois:
6.9% (124,474)
El Salvador Hanover Park:
1.5% (196)Illinois:
0.6% (11,009)
Place of birth for U.S.-born residents:
This state: 20,115Other state: 2,844Northeast: 418Midwest: 1,159South: 766West: 471 90.3% of Hanover Park residents lived in the same house 1 years ago.
Out of people who lived in different houses, 30.2% lived in this county.
Out of people who lived in different counties, 85.8% lived in Illinois.
Hanover Park:
90.3%State average:
88.3%
Education attainment for males 25 years and older:
No schooling: 496Nursery to 4th grade: 1755th and 6th grade: 3127th and 8th grade: 1499th grade: 1610th grade: 33211th grade: 8312th grade, no diploma: 581High school graduate (or equivalency): 3,241Less than 1 year of college: 766Some college more than 1 year, no degree: 1,338Associate degree: 772Bachelor's degree: 2,507Master's degree: 747Professional school degree: 93Doctorate degree: 53
Education attainment for females 25 years and older:
No schooling: 540Nursery to 4th grade: 1755th and 6th grade: 6717th and 8th grade: 2589th grade: 7310th grade: 21111th grade: 15512th grade, no diploma: 315High school graduate (or equivalency): 3,106Less than 1 year of college: 760Some college more than 1 year, no degree: 1,253Associate degree: 1,211Bachelor's degree: 2,180Master's degree: 794Professional school degree: 262Doctorate degree: 91
Housing units in structures:
One, detached: 6,099One, attached: 3,542Two: 1473 or 4: 2515 to 9: 40810 to 19: 68520 to 49: 28950 or more: 126Mobile homes: 16Housing units lacking complete plumbing facilities in 2022: 0.2%Housing units lacking complete kitchen facilities in 2022: 0.3%House/condo owner moved in on average 16 years ago
Renter moved in on average 2 years ago
Private vs. public school enrollment:
Students in private schools in grades 1 to 8 (elementary and middle school): 246 Students in private schools in grades 9 to 12 (high school): 84 Students in private undergraduate colleges: 429