Harrisonburg, VA (Virginia) Houses and Residents
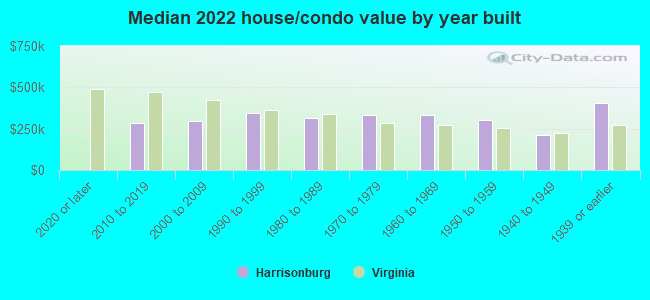
| Harrisonburg: | $315,175 |
| Virginia: | $365,700 |
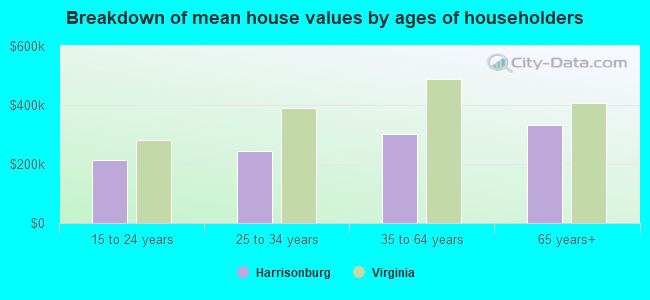
Mean price in 2022:
Detached houses: $338,758
Here: $338,758 State: $472,865 Townhouses or other attached units: $232,850
Here: $232,850 State: $457,437 In 2-unit structures: $289,073
Here: $289,073 State: $396,289 In 3-to-4-unit structures: $185,606
Here: $185,606 State: $252,346 In 5-or-more-unit structures: $158,573
Here: $158,573 State: $382,551 Mobile homes: $28,236
Here: $28,236 State: $100,736
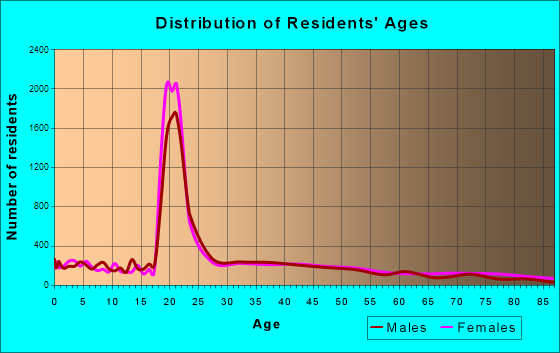
Total population: 52,478 (Urban population: 40,407, Rural population: 61 (20 farm, 41 nonfarm))
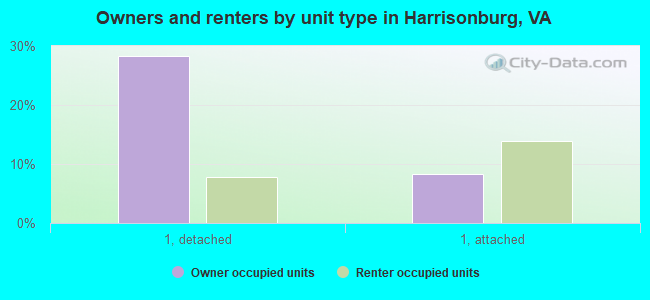
Houses: 19,031 (17,540 occupied: 6,980 owner occupied, 11,332 renter occupied)
| % of renters here: | 62% |
| State: | 33% |
Housing density: 1,084 houses/condos per square mile
Median price asked for vacant for-sale houses and condos in 2022: $238,454.
Median contract rent in 2022: $881 (lower quartile is $679, upper quartile is $1,274)
Median rent asked for vacant for-rent units in 2022: $1,473
Median gross rent in Harrisonburg, VA in 2022: $1,044
Housing units in Harrisonburg with a mortgage: 4,911 (439 second mortgage, 22 home equity loan, 441 both second mortgage and home equity loan)
Houses without a mortgage: 277
Median household income for houses/condos with a mortgage: $89,536
Median household income for apartments without a mortgage: $80,381
Median monthly housing costs: $1,165
Compare current foreclosures in Harrisonburg, VA:
| Photo | Address | Area | Beds / Baths | Price | Details |
|---|---|---|---|---|---|

|
#1
Berryfield Dr
Harrisonburg, VA 22801
|
4,318 sq. feet
|
2 baths 2 beds |
show details | |

|
#2
Franklin St
Harrisonburg, VA 22801
|
1,383 sq. feet
|
1 baths 3 beds |
show details | |

|
#3
Joppa Ct
Harrisonburg, VA 22801
|
2,022 sq. feet
|
2 baths 3 beds |
show details | |

|
#4
Spring Oaks Dr
Harrisonburg, VA 22801
|
1,160 sq. feet
|
2 baths 2 beds |
show details | |

|
#5
Goldfinch Dr
Harrisonburg, VA 22802
|
1,480 sq. feet
|
2 baths 3 beds |
show details | |

|
#6
Port Republic Rd
Harrisonburg, VA 22801
|
1,512 sq. feet
|
1 baths 2 beds |
show details | |

|
#7
Clayborn Rd
Harrisonburg, VA 22802
|
4,344 sq. feet
|
2 baths 3 beds |
show details | |

|
#8
New York Ave
Harrisonburg, VA 22801
|
918 sq. feet
|
1 baths 2 beds |
show details | |

|
#9
Pear St
Harrisonburg, VA 22801
|
720 sq. feet
|
1 baths 2 beds |
show details | |

|
#10
Gravels Rd
Harrisonburg, VA 22802
|
2,488 sq. feet
|
1 baths 2 beds |
show details |
| Photo | Address | Area | Beds / Baths | Price | Details |
|---|---|---|---|---|---|

|
#11
Reservoir St # 201
Harrisonburg, VA 22801
|
864 sq. feet
|
1 baths 3 beds |
show details | |

|
#12
Summit Ave
Harrisonburg, VA 22802
|
3,857 sq. feet
|
3 baths 4 beds |
show details | |

|
#13
Cumberland Dr
Harrisonburg, VA 22801
|
5,028 sq. feet
|
4 baths 4 beds |
show details | |

|
#14
Munchkin Ln
Harrisonburg, VA 22801
|
587 sq. feet
|
1 baths 2 beds |
show details | |

|
#15
Woodland Dr
Harrisonburg, VA 22801
|
1,411 sq. feet
|
2 baths 3 beds |
show details | |

|
#16
Goldfinch Dr
Harrisonburg, VA 22802
|
1,696 sq. feet
|
2 baths 3 beds |
show details | |

|
#17
Breckenridge Ct
Harrisonburg, VA 22801
|
1,000 sq. feet
|
1 baths 2 beds |
show details | |

|
#18
Founders Way
Harrisonburg, VA 22802
|
1,408 sq. feet
|
2 baths 3 beds |
show details | |

|
#19
Crawford Ave
Harrisonburg, VA 22801
|
1,900 sq. feet
|
1 baths 3 beds |
show details | |

|
#20
Rosedale Dr
Harrisonburg, VA 22801
|
1,073 sq. feet
|
1 baths 3 beds |
show details |
| Photo | Address | Area | Beds / Baths | Price | Details |
|---|---|---|---|---|---|

|
#21
Central Ave
Harrisonburg, VA 22801
|
1,856 sq. feet
|
1 baths 3 beds |
show details | |

|
#22
Hillmont Cir Apt 101
Harrisonburg, VA 22801
|
- sq. feet
|
- baths - beds |
show details | |

|
#23
Wesley Chapel Rd
Harrisonburg, VA 22802
|
- sq. feet
|
- baths - beds |
show details | |

|
#24
Virginia Ave Apt 247
Harrisonburg, VA 22802
|
- sq. feet
|
- baths - beds |
show details | |

|
#25
Greenfield Ln, Apt 113
Harrisonburg, VA 22801
|
- sq. feet
|
- baths - beds |
show details | |

|
#26
Alston Cir
Harrisonburg, VA 22802
|
- sq. feet
|
- baths - beds |
show details | |

|
#27
Hornsby Ave
Harrisonburg, VA 22801
|
- sq. feet
|
- baths - beds |
show details | |

|
#28
Peake Mountain Rd
Harrisonburg, VA 22802
|
- sq. feet
|
- baths - beds |
show details | |

|
#29
E Elizabeth St Apt 205
Harrisonburg, VA 22802
|
- sq. feet
|
- baths - beds |
show details | |

|
#30
Petes Ln
Harrisonburg, VA 22802
|
- sq. feet
|
- baths - beds |
show details |
| Photo | Address | Area | Beds / Baths | Price | Details |
|---|---|---|---|---|---|

|
#31
Commercial Ct
Harrisonburg, VA 22802
|
- sq. feet
|
- baths - beds |
show details | |

|
#32
Colonial Dr Apt A
Harrisonburg, VA 22801
|
- sq. feet
|
- baths - beds |
show details | |

|
#33
Stone Spring Rd, # 7
Harrisonburg, VA 22801
|
- sq. feet
|
- baths - beds |
show details | |

|
#34
E Market St, Ste C Pmb 238
Harrisonburg, VA 22801
|
- sq. feet
|
- baths - beds |
show details | |

|
#35
Cedar Point Ln
Harrisonburg, VA 22802
|
- sq. feet
|
- baths - beds |
show details | |

|
#36
Wellington Dr
Harrisonburg, VA 22802
|
- sq. feet
|
- baths - beds |
show details | |

|
#37
Hillmont Cir Apt 106
Harrisonburg, VA 22801
|
- sq. feet
|
- baths - beds |
show details | |

|
#38
Stonechris Dr
Harrisonburg, VA 22802
|
- sq. feet
|
- baths - beds |
show details | |

|
#39
John Tyler Cir Apt 204
Harrisonburg, VA 22801
|
- sq. feet
|
- baths - beds |
show details | |

|
#40
N Liberty St # 1
Harrisonburg, VA 22802
|
- sq. feet
|
- baths - beds |
show details |
| Photo | Address | Area | Beds / Baths | Price | Details |
|---|---|---|---|---|---|

|
#41
James Branch Rd
Harrisonburg, VA 22802
|
- sq. feet
|
- baths - beds |
show details | |

|
#42
Ferguson Dr
Harrisonburg, VA 22802
|
- sq. feet
|
- baths - beds |
show details | |

|
#43
Lewis St Apt A
Harrisonburg, VA 22801
|
- sq. feet
|
- baths - beds |
show details | |

|
#44
W Wolfe St
Harrisonburg, VA 22802
|
- sq. feet
|
- baths - beds |
show details | |

|
Check over 1 million property listings on Foreclosure.com!
|
browse all offers | |||

Latest news about housing in Harrisonburg, VA collected exclusively by city-data.com from local newspapers, TV, and radio stations

 | Where can I find apartments under $1000 in safe neighborhoods? (3 replies) |
| Seeking apartments in Harrisonburg area (1 reply) |
| Living in Roanoke, Harrisonburg or Charlottesville (17 replies) |
| Moving to the Harrisonburg area (21 replies) |
| Harrisonburg Staunton info please! (11 replies) |
| Blackburg, Lynchburg, Harrisonburg compared to Cville (10 replies) |
Median year apartment built: 1990
Household type by relationship:
Households: 52,704- Male householders: 8,469 (2,374 living alone), Female householders: 8,976 (2,491 living alone)
5,781 spouses (5,749 opposite-sex spouses), 1,468 unmarried partners, (1,445 opposite-sex unmarried partners), 10,091 children (9,355 natural, 355 adopted, 380 stepchildren), 447 grandchildren, 559 brothers or sisters, 488 parents, 0 foster children, 945 other relatives, 7,998 non-relatives
- In group quarters: 7,476
Size of family households: 3,674 2-persons, 2,469 3-persons, 1,802 4-persons, 1,224 5-persons, 323 6-persons, 376 7-or-more-persons.
Size of nonfamily households: 4,228 1-person, 1,945 2-persons, 542 3-persons, 1,102 4-persons, 153 5-persons, 57 7-or-more-persons.
4,700 married couples with children.
3,001 single-parent households (875 men, 2,126 women).
72.6% of residents of Harrisonburg speak English at home.
17.0% of residents speak Spanish at home (46% speak English very well, 20% speak English well, 23% speak English not well, 11% don't speak English at all).
4.6% of residents speak other Indo-European language at home (72% speak English very well, 23% speak English well, 4% speak English not well).
2.0% of residents speak Asian or Pacific Island language at home (52% speak English very well, 29% speak English well, 19% speak English not well, 1% don't speak English at all).
3.4% of residents speak other language at home (48% speak English very well, 26% speak English well, 18% speak English not well, 8% don't speak English at all).
Foreign born population: 8,569 (16.3%)
(39.2% of them are naturalized citizens)
| Here: | 6.9 |
| State: | 7.0 |
| Here: | 4.7 |
| State: | 4.3 |
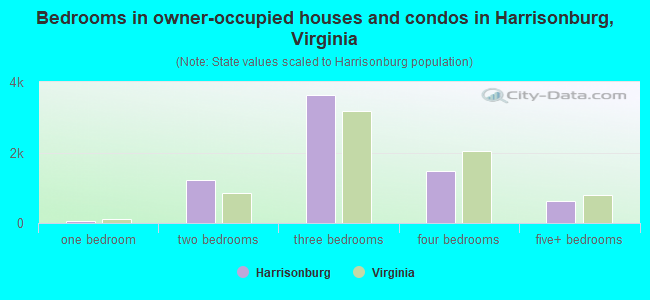
- Bedrooms in owner-occupied houses and condos in Harrisonburg, Virginia
- 0no bedroom
- 591 bedroom
- 1,2092 bedrooms
- 3,6233 bedrooms
- 1,4734 bedrooms
- 6165+ bedrooms
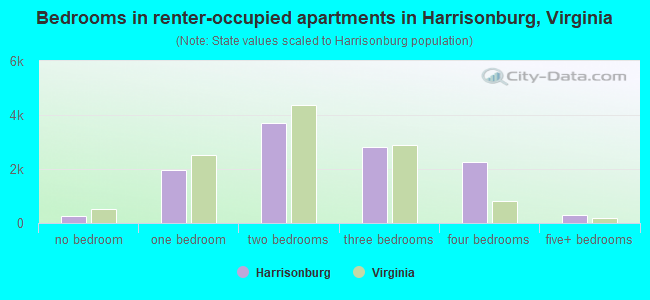
- Bedrooms in renter-occupied apartments in Harrisonburg, Virginia
- 268no bedroom
- 1,9811 bedroom
- 3,6982 bedrooms
- 2,8253 bedrooms
- 2,2704 bedrooms
- 2915+ bedrooms
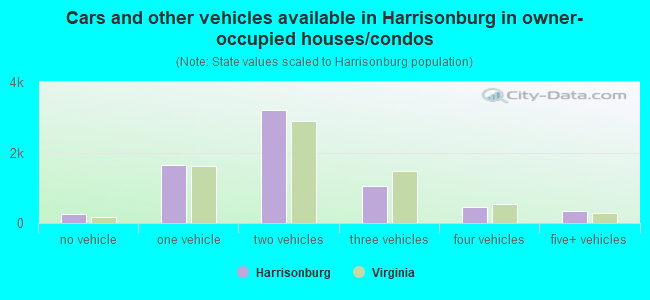
- Cars and other vehicles available in Harrisonburg in owner-occupied houses/condos
- 267no vehicle
- 1,6531 vehicle
- 3,2182 vehicles
- 1,0543 vehicles
- 4424 vehicles
- 3465+ vehicles
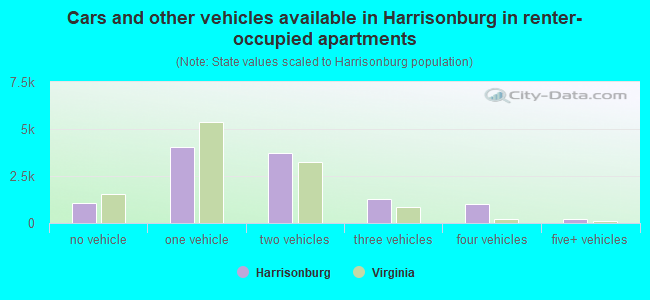
- Cars and other vehicles available in Harrisonburg in renter-occupied apartments
- 1,054no vehicle
- 4,0291 vehicle
- 3,7092 vehicles
- 1,2973 vehicles
- 1,0374 vehicles
- 2065+ vehicles
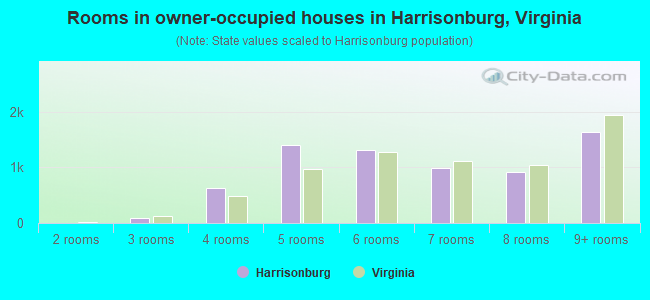
- Rooms in owner-occupied houses in Harrisonburg, Virginia
- 01 room
- 02 rooms
- 953 rooms
- 6354 rooms
- 1,4045 rooms
- 1,3036 rooms
- 9867 rooms
- 9218 rooms
- 1,6379+ rooms
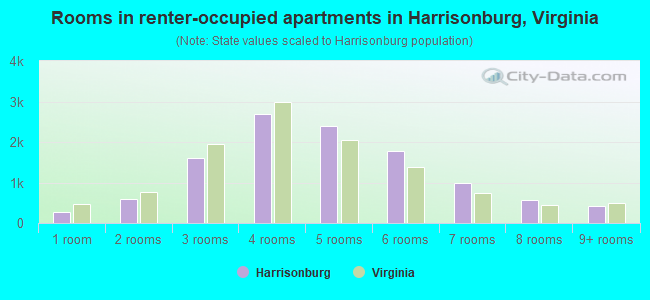
- Rooms in renter-occupied apartments in Harrisonburg, Virginia
- 2681 room
- 6042 rooms
- 1,6073 rooms
- 2,6854 rooms
- 2,3845 rooms
- 1,7856 rooms
- 9977 rooms
- 5758 rooms
- 4289+ rooms
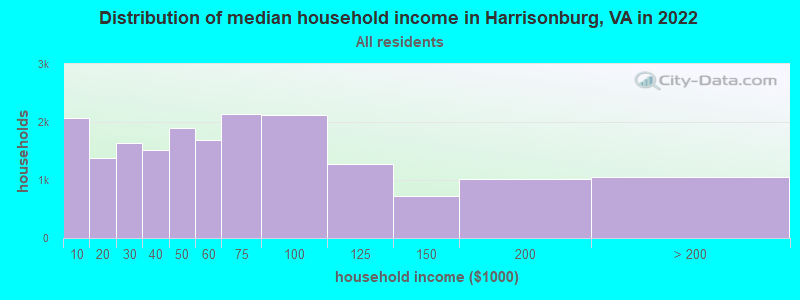
Harrisonburg, VA household income distribution

- 2,070Less than $10,000
- 1,376$10,000 to $19,999
- 1,645$20,000 to $29,999
- 1,524$30,000 to $39,999
- 1,899$40,000 to $49,999
- 1,682$50,000 to $59,999
- 2,134$60,000 to $74,999
- 2,118$75,000 to $99,999
- 1,268$100,000 to $124,999
- 732$125,000 to $149,999
- 1,011$150,000 to $199,999
- 1,046$200,000 or more
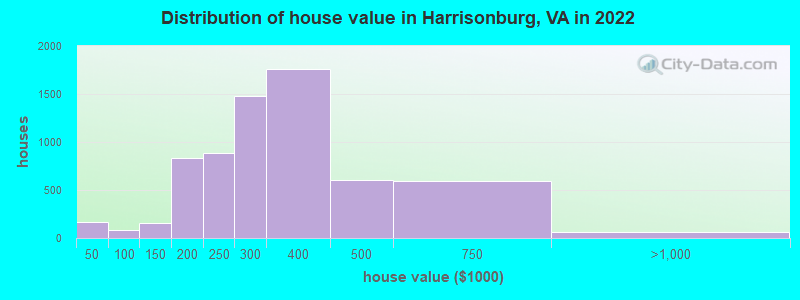
Home value of owner - occupied houses in 2022 in Harrisonburg, VA
-
- 55Less than $10,000
- 48$10,000 to $14,999
- 25$25,000 to $29,999
- 27$30,000 to $34,999
- 14$35,000 to $39,999
- 27$70,000 to $79,999
- 58$90,000 to $99,999
- 86$100,000 to $124,999
- 68$125,000 to $149,999
- 566$150,000 to $174,999
- 270$175,000 to $199,999
- 886$200,000 to $249,999
- 1,479$250,000 to $299,999
- 1,758$300,000 to $399,999
- 609$400,000 to $499,999
- 595$500,000 to $749,999
- 45$750,000 to $999,999
- 12$1,000,000 to $1,499,999
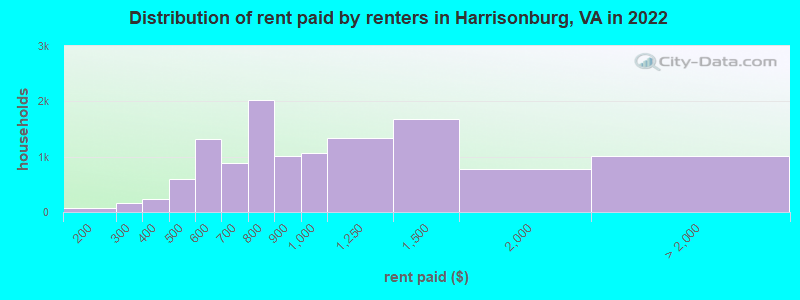
Rent paid by renters in 2022 in Harrisonburg, VA
-
- 7Less than $100
- 66$150 to $199
- 91$200 to $249
- 66$250 to $299
- 57$300 to $349
- 177$350 to $399
- 87$400 to $449
- 514$450 to $499
- 806$500 to $549
- 504$550 to $599
- 359$600 to $649
- 534$650 to $699
- 1,329$700 to $749
- 694$750 to $799
- 1,010$800 to $899
- 1,069$900 to $999
- 1,334$1,000 to $1,249
- 1,676$1,250 to $1,499
- 779$1,500 to $1,999
- 382$2,000 to $2,499
- 147$2,500 to $2,999
- 9$3,000 to $3,499
- 9$3,500 or more
- 460No cash rent
Percentage of workers working in this county: 66.4%
Number of people working at home: 2,360 (9.9% of all workers)
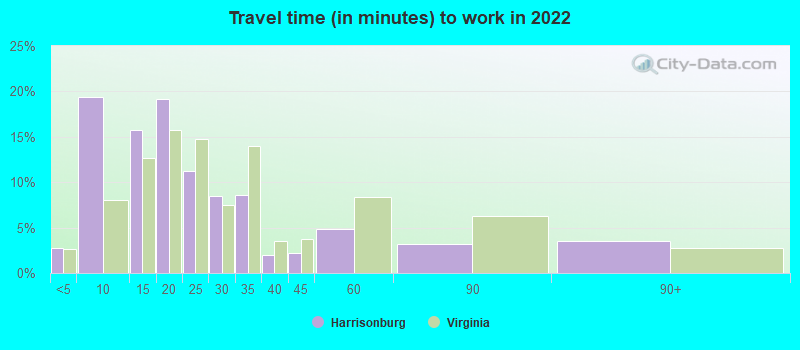
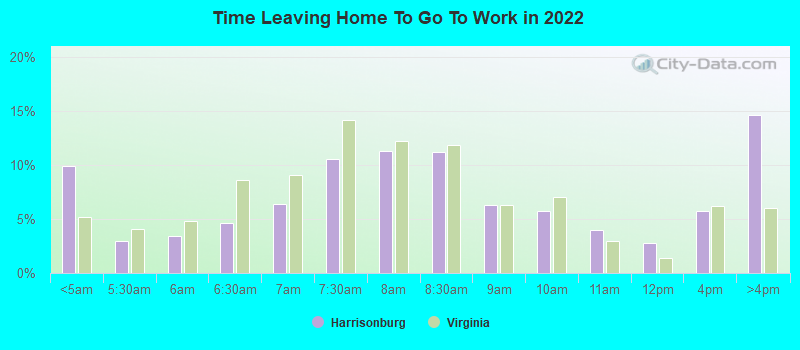
Travel time to work (commute)
- Less than 5 minutes: 902
- 5 to 9 minutes: 6,040
- 10 to 14 minutes: 6,219
- 15 to 19 minutes: 4,167
- 20 to 24 minutes: 1,668
- 25 to 29 minutes: 673
- 30 to 34 minutes: 1,134
- 35 to 39 minutes: 300
- 40 to 44 minutes: 523
- 45 to 59 minutes: 405
- 60 to 89 minutes: 414
- 90 or more minutes: 509
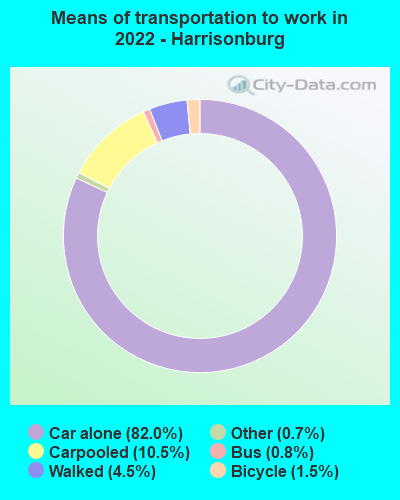
Means of transportation to work:
- Drove a car alone: 28,158 (74.3%)
- Carpooled: 3,674 (9.7%)
- Bus: 204 (0.5%)
- Subway or elevated rail: 17 (0.0%)
- Taxi: 271 (0.7%)
- Bicycle: 513 (1.4%)
- Walked: 1,639 (4.3%)
- Worked at home: 2,360 (6.2%)
- Unemployment by race in 2022
- Unemployment rate for White non-Hispanic residents
- 5.3%Males
- 5.8%Females
- Unemployment rate for Black residents
- 11.5%Males
- 2.8%Females
- Unemployment rate for American Indian and Alaska Native residents
- 16.0%Males
- Unemployment rate for Asian residents
- 1.9%Males
- Unemployment rate for other race residents
- 6.1%Males
- 12.2%Females
- Unemployment rate for two or more race residents
- 9.4%Males
- 0.9%Females
- Unemployment rate for Hispanic or Latino residents
- 7.4%Males
- 5.6%Females
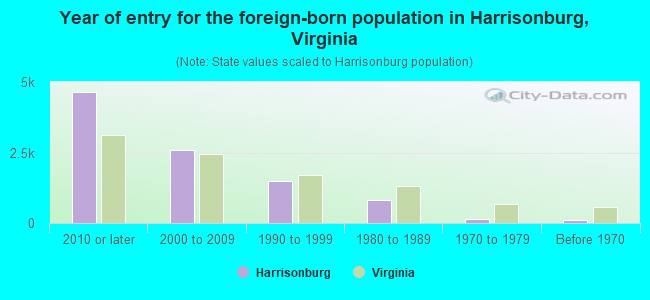
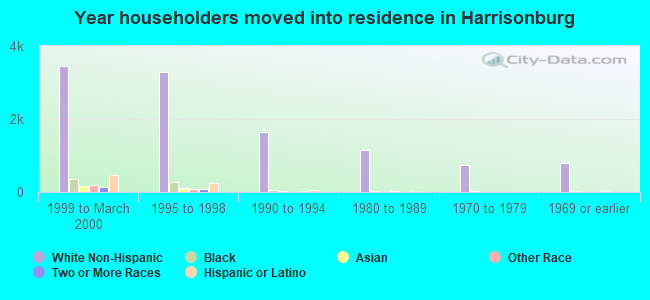
- Year of entry for the foreign-born population in Harrisonburg, Virginia
- 4,6552010 or later
- 2,6002000 to 2009
- 1,4731990 to 1999
- 8201980 to 1989
- 1501970 to 1979
- 114Before 1970
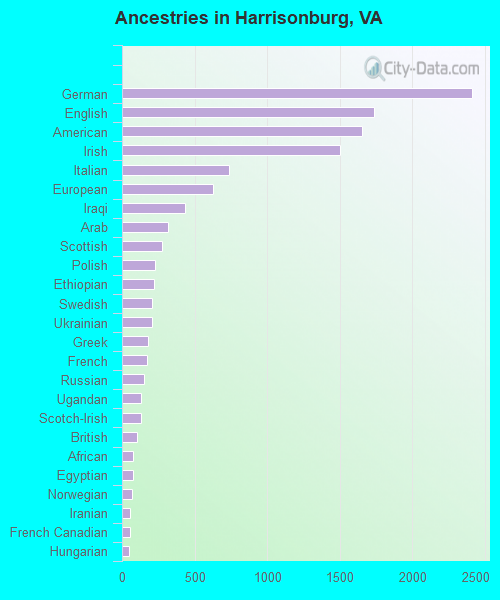
First ancestries reported:
- German: 2,408 (9.9%)
- English: 1,739 (7.1%)
- American: 1,651 (6.8%)
- Irish: 1,501 (6.1%)
- Italian: 736 (3.0%)
- European: 625 (2.6%)
- Iraqi: 435 (1.8%)
- Arab: 316 (1.3%)
- Scottish: 274 (1.1%)
- Polish: 227 (0.9%)
- Ethiopian: 221 (0.9%)
- Swedish: 207 (0.8%)
- Ukrainian: 206 (0.8%)
- Greek: 180 (0.7%)
- French: 174 (0.7%)
- Russian: 150 (0.6%)
- Ugandan: 134 (0.5%)
- Scotch-Irish: 133 (0.5%)
- British: 100 (0.4%)
- African: 76 (0.3%)
- Egyptian: 74 (0.3%)
- Norwegian: 71 (0.3%)
- Iranian: 52 (0.2%)
- French Canadian: 52 (0.2%)
- Hungarian: 51 (0.2%)
- Yugoslavian: 46 (0.2%)
- Canadian: 45 (0.2%)
- Nigerian: 43 (0.2%)
- Bermudan: 41 (0.2%)
- Scandinavian: 39 (0.2%)
- Eastern European: 35 (0.1%)
- Slovak: 33 (0.1%)
- Danish: 33 (0.1%)
- Sudanese: 26 (0.1%)
- Welsh: 25 (0.1%)
- Jamaican: 25 (0.1%)
- Kenyan: 23 (0.09%)
- Syrian: 23 (0.09%)
- Swiss: 19 (0.08%)
- Northern European: 16 (0.07%)
- Dutch: 15 (0.06%)
- Brazilian: 14 (0.06%)
- Serbian: 9 (0.04%)
- Pennsylvania German: 8 (0.03%)
- Romanian: 8 (0.03%)
- Ghanaian: 8 (0.03%)
- Barbadian: 7 (0.03%)
- Lebanese: 7 (0.03%)
- Latvian: 6 (0.02%)
- Finnish: 5 (0.02%)
- Armenian: 4 (0.02%)
- Austrian: 4 (0.02%)
- Guyanese: 3 (0.01%)
- British West Indian: 3 (0.01%)
Most common places of birth for foreign-born residents (%):
| Harrisonburg: | 13.8% (1,278) |
| Virginia: | 3.0% (32,892) |
| Harrisonburg: | 13.2% (1,215) |
| Virginia: | 5.3% (57,498) |
| Harrisonburg: | 12.9% (1,193) |
| Virginia: | 0.9% (9,351) |
| Harrisonburg: | 9.5% (879) |
| Virginia: | 9.9% (107,534) |
| Harrisonburg: | 3.5% (323) |
| Virginia: | 0.5% (5,899) |
| Harrisonburg: | 2.7% (253) |
| Virginia: | 0.1% (1,223) |
| Harrisonburg: | 2.7% (247) |
| Virginia: | 0.1% (961) |
| Harrisonburg: | 2.6% (242) |
| Virginia: | 0.6% (6,698) |
| Harrisonburg: | 2.1% (196) |
| Virginia: | 2.9% (32,082) |
| Harrisonburg: | 2.1% (192) |
| Virginia: | 3.3% (35,938) |
| Harrisonburg: | 2.0% (189) |
| Virginia: | 3.9% (42,989) |
| Harrisonburg: | 2.0% (186) |
| Virginia: | 4.2% (45,750) |
| Harrisonburg: | 1.8% (167) |
| Virginia: | 0.1% (843) |
| Harrisonburg: | 1.8% (163) |
| Virginia: | 1.3% (14,435) |
| Harrisonburg: | 1.7% (155) |
| Virginia: | 0.9% (9,440) |
| Harrisonburg: | 1.6% (146) |
| Virginia: | 0.2% (2,575) |
| Harrisonburg: | 1.6% (145) |
| Virginia: | 0.1% (1,127) |
| Harrisonburg: | 1.5% (142) |
| Virginia: | 9.0% (97,830) |
Place of birth for U.S.-born residents:
- This state: 24,134
- Other state: 17,401
- Northeast: 6,619
- Midwest: 2,935
- South: 5,604
- West: 2,427
73.3% of Harrisonburg residents lived in the same house 1 years ago.
Out of people who lived in different houses, 22.0% lived in this county.
Out of people who lived in different counties, 74.9% lived in Virginia.
| Harrisonburg: | 73.3% |
| State average: | 86.6% |
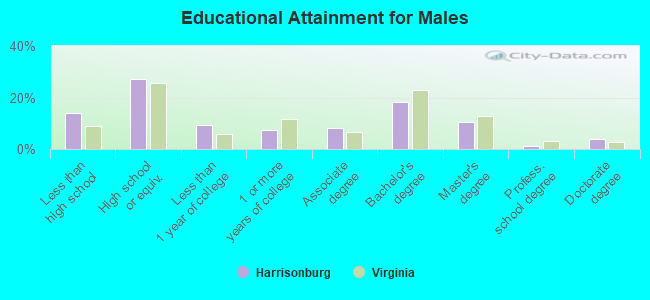
Education attainment for males 25 years and older:
- No schooling: 348
- Nursery to 4th grade: 284
- 5th and 6th grade: 314
- 7th and 8th grade: 308
- 9th grade: 136
- 10th grade: 80
- 11th grade: 165
- 12th grade, no diploma: 227
- High school graduate (or equivalency): 3,660
- Less than 1 year of college: 1,279
- Some college more than 1 year, no degree: 1,006
- Associate degree: 1,119
- Bachelor's degree: 2,439
- Master's degree: 1,439
- Professional school degree: 176
- Doctorate degree: 501
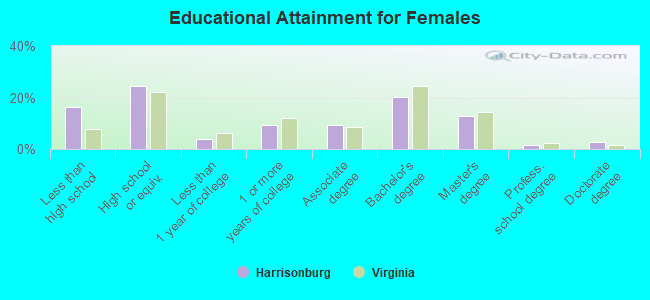
Education attainment for females 25 years and older:
- No schooling: 251
- Nursery to 4th grade: 271
- 5th and 6th grade: 212
- 7th and 8th grade: 385
- 9th grade: 302
- 10th grade: 294
- 11th grade: 374
- 12th grade, no diploma: 77
- High school graduate (or equivalency): 3,230
- Less than 1 year of college: 516
- Some college more than 1 year, no degree: 1,247
- Associate degree: 1,231
- Bachelor's degree: 2,669
- Master's degree: 1,708
- Professional school degree: 183
- Doctorate degree: 340
Housing units in structures:
- One, detached: 6,804
- One, attached: 4,392
- Two: 923
- 3 or 4: 1,610
- 5 to 9: 1,309
- 10 to 19: 2,667
- 20 to 49: 286
- 50 or more: 834
- Mobile homes: 200
Median worth of mobile homes: $13,437
Housing units lacking complete kitchen facilities in 2022: 1.4%
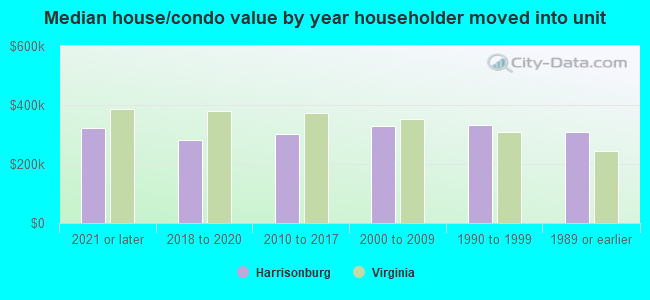
House/condo owner moved in on average 9 years ago
Renter moved in on average 2 years ago
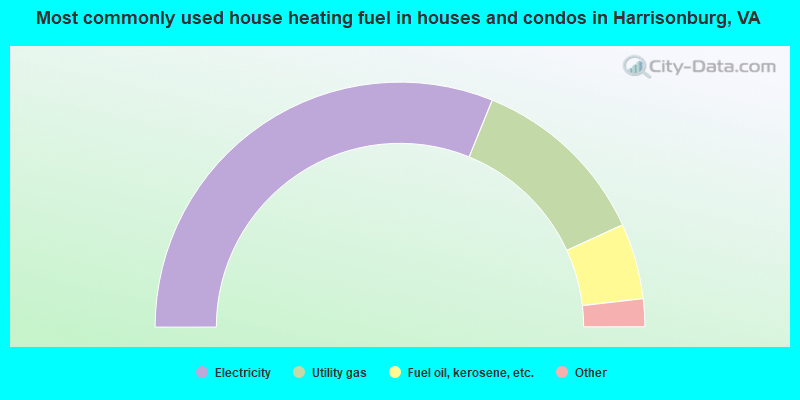
- 62.3%Electricity
- 24.0%Utility gas
- 10.0%Fuel oil, kerosene, etc.
- 1.6%Bottled, tank, or LP gas
- 1.1%Wood
- 0.6%Solar energy
- 0.3%No fuel used
- 0.1%Other fuel
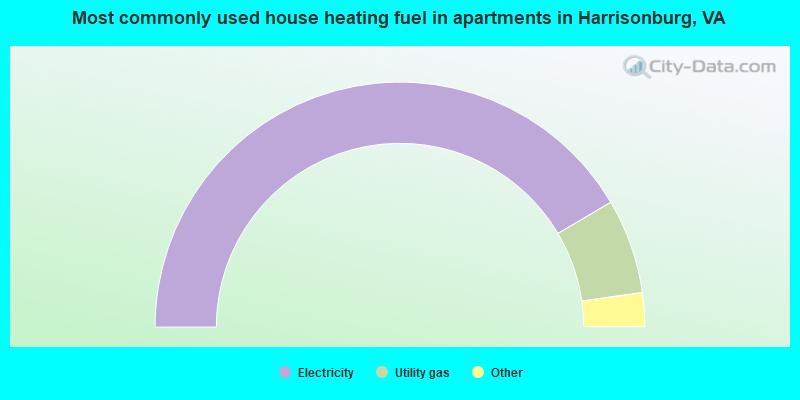
- 83.0%Electricity
- 12.5%Utility gas
- 1.8%Fuel oil, kerosene, etc.
- 1.5%Bottled, tank, or LP gas
- 0.9%No fuel used
- 0.1%Other fuel
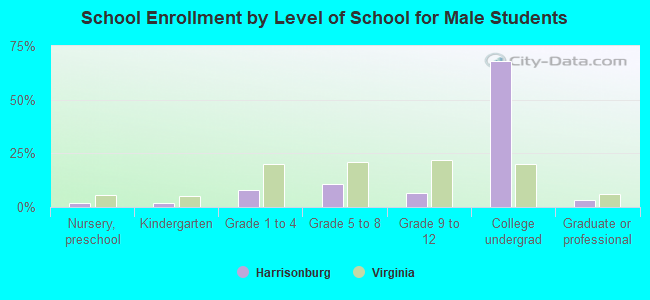
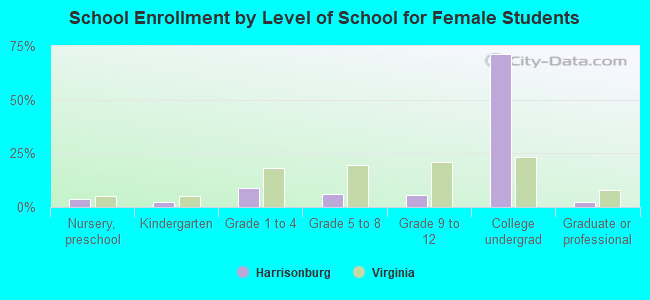
Private vs. public school enrollment:
| Here: | 6.1% |
| Virginia: | 13.2% |
| Here: | 5.6% |
| Virginia: | 10.2% |
| Here: | 8.7% |
| Virginia: | 18.7% |