Harrisville, NH (New Hampshire) Houses and Residents
| Harrisville: | $340,946 |
| New Hampshire: | $384,700 |
Total population: 961 (Urban population: 0, Rural population: 1,075 (23 farm, 1,052 nonfarm))
Houses: 698 (449 occupied: 362 owner occupied, 87 renter occupied)
| % of renters here: | 19% |
| State: | 28% |
Housing density: 37 houses/condos per square mile
Median price asked for vacant for-sale houses and condos in 2022 in this county: $225,021.
Median contract rent in 2022: $1,080 (lower quartile is $647, upper quartile is $1,706)
Median rent asked for vacant for-rent units in 2022: $594
Median gross rent in Harrisville, NH in 2022: $1,326
Housing units in Harrisville with a mortgage: 174 (15 second mortgage, 26 home equity loan, 2 both second mortgage and home equity loan)
Houses without a mortgage: 86
Compare current foreclosures near Harrisville, NH:
| Photo | Address | Area | Beds / Baths | Price | Details |
|---|---|---|---|---|---|

|
#1
Spring St
Swanzey, NH 03446
|
1,524 sq. feet
|
1 baths 3 beds |
show details | |

|
#2
Pine Rd
Fitzwilliam, NH 03447
|
792 sq. feet
|
1 baths 2 beds |
show details | |

|
#3
South Rd
Swanzey, NH 03446
|
3,929 sq. feet
|
3 baths 3 beds |
show details | |

|
#4
Russell Ave
Troy, NH 03465
|
2,046 sq. feet
|
1 baths 3 beds |
show details | |

|
#5
Laura Ln
Keene, NH 03431
|
912 sq. feet
|
1 baths 3 beds |
show details | |

|
#6
W Hill Rd
Troy, NH 03465
|
1,664 sq. feet
|
2 baths 3 beds |
show details | |

|
#7
Birch Dr
Rindge, NH 03461
|
1,971 sq. feet
|
2 baths 4 beds |
show details | |

|
#8
Fitzgerald Rd
Rindge, NH 03461
|
3,960 sq. feet
|
3 baths 4 beds |
show details | |

|
#9
Taggart Cir
Rindge, NH 03461
|
1,488 sq. feet
|
1 baths 3 beds |
show details | |

|
#10
Hale Hill Rd
Swanzey, NH 03446
|
2,976 sq. feet
|
2 baths 3 beds |
show details |
| Photo | Address | Area | Beds / Baths | Price | Details |
|---|---|---|---|---|---|

|
#11
Lord Brook Rd
Rindge, NH 03461
|
1,920 sq. feet
|
1 baths 3 beds |
show details | |

|
#12
W Hill Rd
Troy, NH 03465
|
1,664 sq. feet
|
2 baths 3 beds |
show details | |

|
#13
Old New Ipswich Rd
Rindge, NH 03461
|
1,184 sq. feet
|
2 baths 3 beds |
show details | |

|
#14
N Shore Rd
Spofford, NH 03462
|
- sq. feet
|
2 baths 3 beds |
show details | |

|
#15
Monomonac Ter
Rindge, NH 03461
|
1,024 sq. feet
|
1 baths 3 beds |
show details | |

|
#16
South Rd
Sullivan, NH 03445
|
- sq. feet
|
1 baths 3 beds |
show details | |

|
#17
Whitney Rd
Hillsboro, NH 03244
|
- sq. feet
|
2 baths 3 beds |
show details | |

|
#18
Washington St
Keene, NH 03431
|
- sq. feet
|
1 baths 3 beds |
show details | |

|
#19
Washington St
Keene, NH 03431
|
- sq. feet
|
1 baths 3 beds |
show details | |

|
#20
Francestown Rd
Bennington, NH 03442
|
- sq. feet
|
1 baths 2 beds |
show details |
| Photo | Address | Area | Beds / Baths | Price | Details |
|---|---|---|---|---|---|

|
#21
Howard St # 2
Keene, NH 03431
|
- sq. feet
|
2 baths 3 beds |
show details | |

|
#22
Spring St Apt 1
Keene, NH 03431
|
- sq. feet
|
- baths - beds |
show details | |

|
#23
Fitzwilliam Rd
Winchester, NH 03470
|
- sq. feet
|
- baths - beds |
show details | |

|
#24
Gilsum Mine Rd
Alstead, NH 03602
|
- sq. feet
|
- baths - beds |
show details | |

|
#25
University Dr
Rindge, NH 03461
|
- sq. feet
|
- baths - beds |
show details | |

|
#26
Baine Way
Alstead, NH 03602
|
- sq. feet
|
- baths - beds |
show details | |

|
#27
Childs Way
Hillsboro, NH 03244
|
- sq. feet
|
- baths - beds |
show details | |

|
#28
Hubbard Rd
Sullivan, NH 03445
|
- sq. feet
|
- baths - beds |
show details | |

|
#29
School St Ste 211
Bennington, NH 03442
|
- sq. feet
|
- baths - beds |
show details | |

|
#30
Lord Hill Rd
Rindge, NH 03461
|
- sq. feet
|
- baths - beds |
show details |
| Photo | Address | Area | Beds / Baths | Price | Details |
|---|---|---|---|---|---|

|
#31
Tigola Trl
Stoddard, NH 03464
|
- sq. feet
|
- baths - beds |
show details | |

|
#32
Depot St Apt 3
Hillsboro, NH 03244
|
- sq. feet
|
- baths - beds |
show details | |

|
#33
Court St Apt I
Keene, NH 03431
|
- sq. feet
|
- baths - beds |
show details | |

|
#34
Birch St
Keene, NH 03431
|
- sq. feet
|
- baths - beds |
show details | |

|
#35
Emerald St # 194
Keene, NH 03431
|
- sq. feet
|
- baths - beds |
show details | |

|
#36
Deering Center Rd
Hillsboro, NH 03244
|
- sq. feet
|
- baths - beds |
show details | |

|
#37
Washington St
Keene, NH 03431
|
- sq. feet
|
- baths - beds |
show details | |

|
#38
Fitzwilliam Rd
Winchester, NH 03470
|
- sq. feet
|
- baths - beds |
show details | |

|
#39
N Shore R 2
Spofford, NH 03462
|
- sq. feet
|
- baths - beds |
show details | |

|
#40
Kullgren Rd
Temple, NH 03084
|
- sq. feet
|
- baths - beds |
show details |
| Photo | Address | Area | Beds / Baths | Price | Details |
|---|---|---|---|---|---|

|
#41
Old Harrisville Rd
Marlborough, NH 03455
|
- sq. feet
|
- baths - beds |
show details | |

|
#42
Pierce Lake Rd
Antrim, NH 03440
|
- sq. feet
|
- baths - beds |
show details | |

|
#43
Forest Rd # 1
Greenfield, NH 03047
|
- sq. feet
|
- baths - beds |
show details | |

|
#44
Masquanipi Dr
Antrim, NH 03440
|
- sq. feet
|
- baths - beds |
show details | |

|
#45
Main St
Marlborough, NH 03455
|
- sq. feet
|
- baths - beds |
show details | |

|
#46
Old Sharon Rd
Peterborough, NH 03458
|
- sq. feet
|
- baths - beds |
show details | |

|
#47
Glen Dr
Peterborough, NH 03458
|
- sq. feet
|
- baths - beds |
show details | |

|
#48
Chapman Rd
Keene, NH 03431
|
- sq. feet
|
- baths - beds |
show details | |

|
#49
Longview Rd
Hancock, NH 03449
|
- sq. feet
|
- baths - beds |
show details | |

|
Check over 1 million property listings on Foreclosure.com!
|
browse all offers | |||
Latest news about housing in Harrisville, NH collected exclusively by city-data.com from local newspapers, TV, and radio stations

 | Searching for area with unique homes. (24 replies) |
| Moving to Keene area or Walpole. Please advise. (13 replies) |
| Looking at Southern NH...Where would you recommend searching? (15 replies) |
| Relocating to Keene/Bratt/Walpole (0 replies) |
| MD to...Anywhere in the US (37 replies) |
| Relocating - Let me Pick Your Brains! (30 replies) |

Household type by relationship:
Households: 72,490- In family households: 57,506 (13,731 male householders, 5,553 female householders)
15,061 spouses, 18,450 children (16,981 natural, 486 adopted, 983 stepchildren), 1,059 grandchildren, 370 brothers or sisters, 455 parents, foster children, 424 other relatives, 2,014 non-relatives
- In nonfamily households: 14,984 (5,137 male householders (3,505 living alone)), 5,783 female householders (4,395 living alone)), 4,064 nonrelatives
- In group quarters: 4,627 (604 institutionalized population)
12,264 married couples with children.
3,698 single-parent households (1,049 men, 2,649 women).
92.6% of residents of Harrisville speak English at home.
2.8% of residents speak Spanish at home (32% speak English very well, 29% speak English well, 39% speak English not well).
4.2% of residents speak other Indo-European language at home (63% speak English very well, 5% speak English well, 33% speak English not well).
0.4% of residents speak other language at home (100% speak English very well).
Foreign born population: 74 (6.6%)
(36.5% of them are naturalized citizens)
| Here: | 6.1 |
| State: | 6.4 |
| Here: | 4.3 |
| State: | 4.0 |

- Bedrooms in owner-occupied houses and condos in Harrisville, New Hampshire
- 0no bedroom
- 211 bedroom
- 962 bedrooms
- 1613 bedrooms
- 734 bedrooms
- 115+ bedrooms

- Bedrooms in renter-occupied apartments in Harrisville, New Hampshire
- 0no bedroom
- 171 bedroom
- 272 bedrooms
- 313 bedrooms
- 54 bedrooms
- 75+ bedrooms

- Cars and other vehicles available in Harrisville in owner-occupied houses/condos
- 12no vehicle
- 1001 vehicle
- 1552 vehicles
- 693 vehicles
- 224 vehicles
- 45+ vehicles

- Cars and other vehicles available in Harrisville in renter-occupied apartments
- 2no vehicle
- 281 vehicle
- 302 vehicles
- 223 vehicles
- 34 vehicles
- 25+ vehicles

- Rooms in owner-occupied houses in Harrisville, New Hampshire
- 01 room
- 42 rooms
- 143 rooms
- 344 rooms
- 755 rooms
- 1036 rooms
- 527 rooms
- 458 rooms
- 359+ rooms

- Rooms in renter-occupied apartments in Harrisville, New Hampshire
- 01 room
- 22 rooms
- 183 rooms
- 204 rooms
- 175 rooms
- 156 rooms
- 57 rooms
- 28 rooms
- 89+ rooms


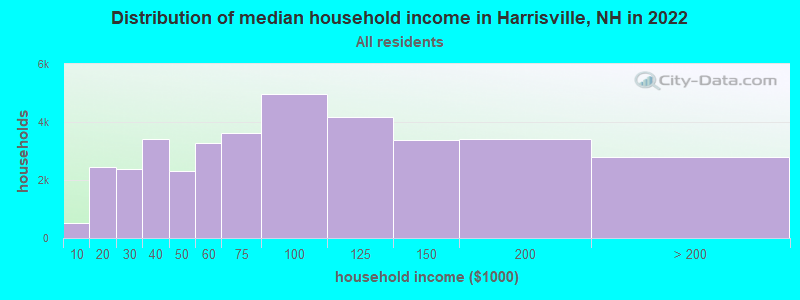
Harrisville, NH household income distribution

- 513Less than $10,000
- 2,453$10,000 to $19,999
- 2,389$20,000 to $29,999
- 3,402$30,000 to $39,999
- 2,314$40,000 to $49,999
- 3,277$50,000 to $59,999
- 3,619$60,000 to $74,999
- 4,961$75,000 to $99,999
- 4,181$100,000 to $124,999
- 3,382$125,000 to $149,999
- 3,401$150,000 to $199,999
- 2,778$200,000 or more
Percentage of workers working in this county: 76.7%
Number of people working at home: 118 (17.4% of all workers)
Travel time to work (commute)
- Less than 5 minutes: 27
- 5 to 9 minutes: 29
- 10 to 14 minutes: 43
- 15 to 19 minutes: 72
- 20 to 24 minutes: 135
- 25 to 29 minutes: 90
- 30 to 34 minutes: 70
- 35 to 39 minutes: 13
- 40 to 44 minutes: 9
- 45 to 59 minutes: 23
- 60 to 89 minutes: 20
- 90 or more minutes: 16
Means of transportation to work:
- Drove a car alone: 475 (81.6%)
- Carpooled: 48 (8.2%)
- Bus or trolley bus: 3 (0.5%)
- Walked: 19 (3.3%)
- Other means: 2 (0.3%)
- Worked at home: 35 (6.0%)


- Year of entry for the foreign-born population in Harrisville, New Hampshire
- 01995 to March 2000
- 81990 to 1994
- 51985 to 1989
- 71980 to 1984
- 31975 to 1979
- 41970 to 1974
- 21965 to 1969
- 11Before 1965
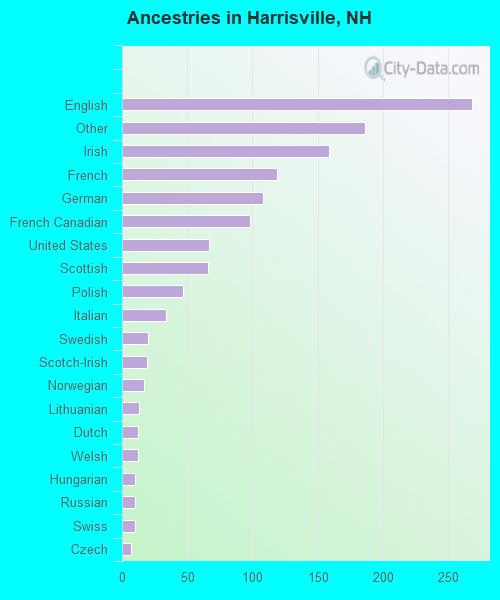
First ancestries reported:
- English: 268 (20.8%)
- Other: 186 (14.5%)
- Irish: 159 (12.4%)
- French: 119 (9.3%)
- German: 108 (8.4%)
- French Canadian: 98 (7.6%)
- United States: 67 (5.2%)
- Scottish: 66 (5.1%)
- Polish: 47 (3.7%)
- Italian: 34 (2.6%)
- Swedish: 20 (1.6%)
- Scotch-Irish: 19 (1.5%)
- Norwegian: 17 (1.3%)
- Lithuanian: 13 (1.0%)
- Dutch: 12 (0.9%)
- Welsh: 12 (0.9%)
- Hungarian: 10 (0.8%)
- Russian: 10 (0.8%)
- Swiss: 10 (0.8%)
- Czech: 7 (0.5%)
- Arab: 2 (0.2%)
- Portuguese: 2 (0.2%)
Most common places of birth for foreign-born residents (%):
| Harrisville: | 30.0% (12) |
| New Hampshire: | 22.9% (12,397) |
| Harrisville: | 17.5% (7) |
| New Hampshire: | 8.1% (4,396) |
| Harrisville: | 10.0% (4) |
| New Hampshire: | 1.5% (786) |
| Harrisville: | 10.0% (4) |
| New Hampshire: | 0.2% (96) |
| Harrisville: | 7.5% (3) |
| New Hampshire: | 2.9% (1,582) |
| Harrisville: | 5.0% (2) |
| New Hampshire: | 0.5% (250) |
| Harrisville: | 5.0% (2) |
| New Hampshire: | 0.3% (183) |
| Harrisville: | 5.0% (2) |
| New Hampshire: | 0.7% (401) |
| Harrisville: | 5.0% (2) |
| New Hampshire: | 4.9% (2,670) |
| Harrisville: | 5.0% (2) |
| New Hampshire: | 0.5% (290) |
Place of birth for U.S.-born residents:
- This state: 452
- Other state: 574
- Northeast: 446
- Midwest: 42
- South: 62
- West: 24
62% of Harrisville residents lived in the same house 5 years ago.
Out of people who lived in different houses, 47% lived in this county.
Out of people who lived in different counties, 24% lived in New Hampshire.
Education attainment for males 25 years and older:
- No schooling: 2
- Nursery to 4th grade: 0
- 5th and 6th grade: 4
- 7th and 8th grade: 9
- 9th grade: 8
- 10th grade: 8
- 11th grade: 8
- 12th grade, no diploma: 6
- High school graduate (or equivalency): 82
- Less than 1 year of college: 18
- Some college more than 1 year, no degree: 43
- Associate degree: 18
- Bachelor's degree: 91
- Master's degree: 40
- Professional school degree: 5
- Doctorate degree: 10

Education attainment for females 25 years and older:
- No schooling: 2
- Nursery to 4th grade: 0
- 5th and 6th grade: 0
- 7th and 8th grade: 11
- 9th grade: 0
- 10th grade: 8
- 11th grade: 7
- 12th grade, no diploma: 13
- High school graduate (or equivalency): 116
- Less than 1 year of college: 29
- Some college more than 1 year, no degree: 43
- Associate degree: 18
- Bachelor's degree: 98
- Master's degree: 51
- Professional school degree: 9
- Doctorate degree: 5


Housing units in structures:
- One, detached: 625
- One, attached: 10
- Two: 27
- 3 or 4: 8
- Mobile homes: 28
Median worth of mobile homes: $56,401
Housing units lacking complete kitchen facilities: 1.9%

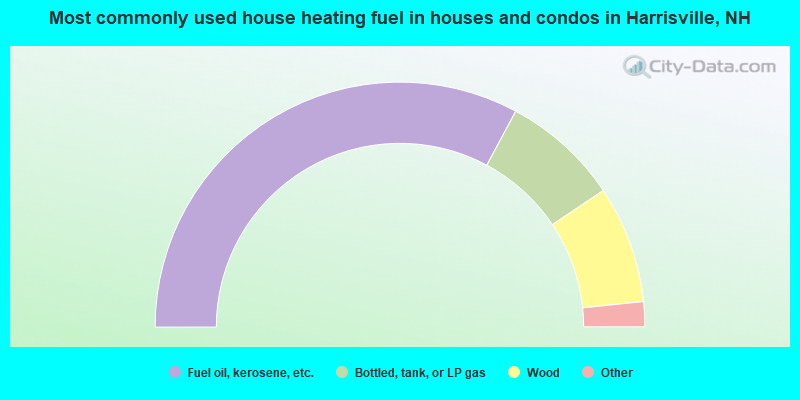
- 65.7%Fuel oil, kerosene, etc.
- 15.5%Bottled, tank, or LP gas
- 15.5%Wood
- 2.8%Electricity
- 0.6%Solar energy
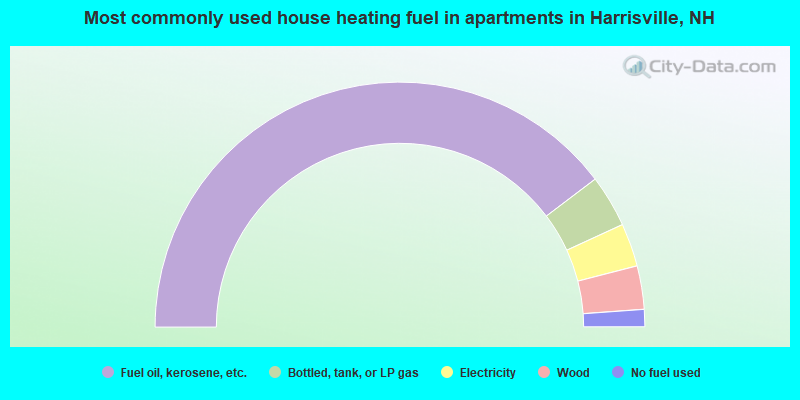
- 79.3%Fuel oil, kerosene, etc.
- 6.9%Bottled, tank, or LP gas
- 5.7%Electricity
- 5.7%Wood
- 2.3%No fuel used
Private vs. public school enrollment:
| Here: | 16.4% |
| New Hampshire: | 8.9% |
| Here: | 18.5% |
| New Hampshire: | 10.7% |
| Here: | 24.0% |
| New Hampshire: | 36.4% |


