Hartford City, IN (Indiana) Houses and Residents
| Hartford City: | $77,637 |
| Indiana: | $208,700 |
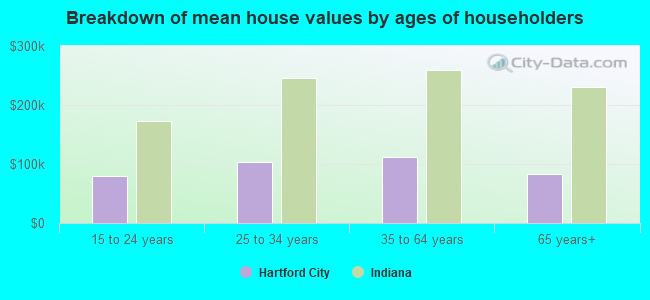
Mean price in 2022:
Detached houses: $107,704
Here: $107,704 State: $257,916 Townhouses or other attached units: $142,669
Here: $142,669 State: $224,114 In 2-unit structures: $121,739
Here: $121,739 State: $175,375 Mobile homes: $21,441
Here: $21,441 State: $67,116
Total population: 6,042 (All urban)
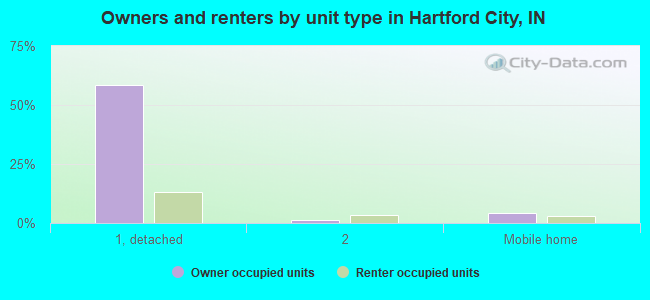
Houses: 3,138 (2,693 occupied: 1,959 owner occupied, 765 renter occupied)
| % of renters here: | 28% |
| State: | 29% |
Housing density: 843 houses/condos per square mile
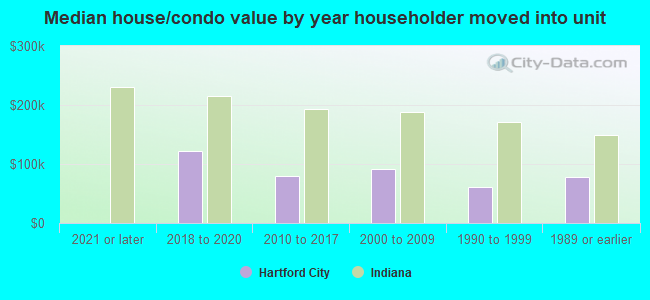
Median price asked for vacant for-sale houses and condos in 2022: $45,473.
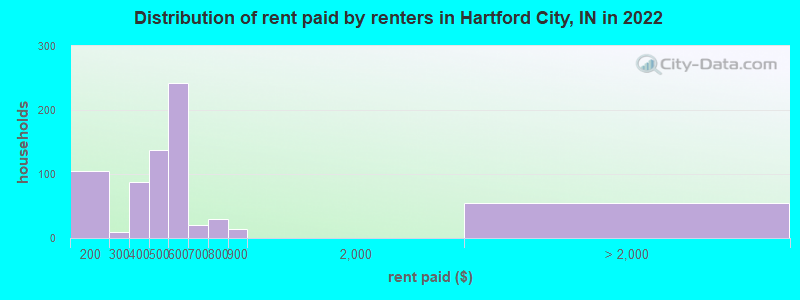
Median contract rent in 2022: $485 (lower quartile is $376, upper quartile is $596)
Median rent asked for vacant for-rent units in 2022: $460
Median gross rent in Hartford City, IN in 2022: $643
Housing units in Hartford City with a mortgage: 896 (42 second mortgage, 0 home equity loan, 39 both second mortgage and home equity loan)
Houses without a mortgage: 97
Median household income for houses/condos with a mortgage: $57,539
Median household income for apartments without a mortgage: $35,461
Median monthly housing costs: $615
Compare current foreclosures near Hartford City, IN:
| Photo | Address | Area | Beds / Baths | Price | Details |
|---|---|---|---|---|---|

|
#1
S Jefferson St
Hartford City, IN 47348
|
2,440 sq. feet
|
1 baths 3 beds |
show details | |

|
#2
S Monroe St
Hartford City, IN 47348
|
1,000 sq. feet
|
1 baths 3 beds |
show details | |

|
#3
S State Road 3 Apt 26
Hartford City, IN 47348
|
1,064 sq. feet
|
1 baths 2 beds |
show details | |

|
#4
1010 18
Hartford City, IN 47348
|
888 sq. feet
|
1 baths 1 beds |
show details | |

|
#5
E Washington St
Hartford City, IN 47348
|
1,744 sq. feet
|
1 baths 3 beds |
show details | |

|
#6
S State Road 3
Hartford City, IN 47348
|
1,136 sq. feet
|
1 baths 3 beds |
show details | |

|
#7
N Jefferson St
Hartford City, IN 47348
|
3,188 sq. feet
|
1 baths 4 beds |
show details | |

|
#8
E Elm St
Hartford City, IN 47348
|
1,514 sq. feet
|
1 baths 2 beds |
show details | |

|
#9
S 350 W
Hartford City, IN 47348
|
2,569 sq. feet
|
2 baths 6 beds |
show details | |

|
#10
W 400 S
Hartford City, IN 47348
|
1,200 sq. feet
|
1 baths 3 beds |
show details |
| Photo | Address | Area | Beds / Baths | Price | Details |
|---|---|---|---|---|---|

|
#11
W State Road 26
Hartford City, IN 47348
|
2,520 sq. feet
|
2 baths 3 beds |
show details | |

|
#12
N 200 W
Hartford City, IN 47348
|
1,248 sq. feet
|
2 baths 3 beds |
show details | |

|
#13
Greenwood Dr
Hartford City, IN 47348
|
1,164 sq. feet
|
1 baths 3 beds |
show details | |

|
#14
W Franklin St
Hartford City, IN 47348
|
1,248 sq. feet
|
1 baths 1 beds |
show details | |

|
#15
W Mcdonald St
Hartford City, IN 47348
|
1,056 sq. feet
|
1 baths 3 beds |
show details | |

|
#16
Homestead Ave
Hartford City, IN 47348
|
1,248 sq. feet
|
1 baths 3 beds |
show details | |

|
#17
E Franklin St
Hartford City, IN 47348
|
1,037 sq. feet
|
1 baths 2 beds |
show details | |

|
#18
W State Road 26
Hartford City, IN 47348
|
1,608 sq. feet
|
1 baths 3 beds |
show details | |

|
#19
E 100 S
Hartford City, IN 47348
|
- sq. feet
|
- baths - beds |
show details | |

|
#20
S Cherry St # T
Hartford City, IN 47348
|
- sq. feet
|
- baths - beds |
show details |
| Photo | Address | Area | Beds / Baths | Price | Details |
|---|---|---|---|---|---|

|
#21
W Elm St
Hartford City, IN 47348
|
- sq. feet
|
- baths - beds |
show details | |

|
#22
E Wabash Ave
Muncie, IN 47303
|
1,400 sq. feet
|
1 baths 3 beds |
$158,900
|
show details |

|
#23
West 500 North
Gaston, IN 47342
|
1,736 sq. feet
|
1 baths 3 beds |
$214,900
|
show details |

|
#24
E Main St
Redkey, IN 47373
|
1,825 sq. feet
|
1 baths 2 beds |
$33,250
|
show details |

|
#25
E S G
Gas City, IN 46933
|
1,256 sq. feet
|
1 baths - beds |
$19,900
|
show details |

|
#26
E 1st St
Fowlerton, IN 46930
|
1,640 sq. feet
|
1 baths 2 beds |
show details | |

|
#27
E Marshall St
Marion, IN 46952
|
955 sq. feet
|
1 baths 3 beds |
show details | |

|
#28
E 38th St
Marion, IN 46953
|
1,071 sq. feet
|
1 baths 3 beds |
show details | |

|
#29
E South D St
Gas City, IN 46933
|
1,808 sq. feet
|
1 baths 3 beds |
show details | |

|
#30
E Main St
Gas City, IN 46933
|
- sq. feet
|
2 baths 3 beds |
show details |
| Photo | Address | Area | Beds / Baths | Price | Details |
|---|---|---|---|---|---|

|
#31
N 10th St
Gas City, IN 46933
|
1,568 sq. feet
|
1 baths 3 beds |
show details | |

|
#32
W Elm St
Gaston, IN 47342
|
1,979 sq. feet
|
2 baths 3 beds |
show details | |

|
#33
W 2nd St
Fowlerton, IN 46930
|
1,440 sq. feet
|
2 baths 3 beds |
show details | |

|
#34
W Kings Row St
Muncie, IN 47304
|
2,000 sq. feet
|
2 baths 3 beds |
show details | |

|
#35
W Henderson St
Montpelier, IN 47359
|
1,392 sq. feet
|
1 baths 3 beds |
show details | |

|
#36
E Delta Dr
Muncie, IN 47303
|
960 sq. feet
|
1 baths 2 beds |
show details | |

|
#37
N Oakwood Ave
Muncie, IN 47304
|
2,282 sq. feet
|
2 baths 3 beds |
show details | |

|
#38
E Indiana Ave
Eaton, IN 47338
|
1,396 sq. feet
|
1 baths 4 beds |
show details | |

|
#39
W Harvard Ave
Muncie, IN 47304
|
1,466 sq. feet
|
1 baths 3 beds |
show details | |

|
#40
N Lakeside Dr
Muncie, IN 47304
|
1,642 sq. feet
|
2 baths 3 beds |
show details |
| Photo | Address | Area | Beds / Baths | Price | Details |
|---|---|---|---|---|---|

|
#41
N Dalton Ave
Albany, IN 47320
|
3,284 sq. feet
|
1 baths 3 beds |
show details | |

|
#42
E Harvard Ave
Muncie, IN 47303
|
504 sq. feet
|
1 baths 2 beds |
show details | |

|
#43
W Horizon Rd
Muncie, IN 47303
|
1,792 sq. feet
|
2 baths 3 beds |
show details | |

|
#44
S Adams St
Montpelier, IN 47359
|
1,296 sq. feet
|
1 baths 3 beds |
show details | |

|
#45
E Yale Ave
Muncie, IN 47303
|
1,145 sq. feet
|
1 baths 2 beds |
show details | |

|
#46
N Linden St
Muncie, IN 47304
|
2,494 sq. feet
|
2 baths 3 beds |
show details | |

|
#47
N New York Ave
Muncie, IN 47304
|
1,242 sq. feet
|
1 baths 3 beds |
show details | |

|
#48
E Purdue Rd
Muncie, IN 47303
|
896 sq. feet
|
1 baths 3 beds |
show details | |

|
#49
E Royerton Rd
Muncie, IN 47303
|
1,484 sq. feet
|
1 baths 2 beds |
show details | |

|
Check over 1 million property listings on Foreclosure.com!
|
browse all offers | |||


 | Deaths up to 18 to 64 year olds according to Indiana CEO at 1 America (69 replies) |
| Bi-racial married couple looking to relo from So Cali to Indianapolis (58 replies) |
| Question about Muncie schools (6 replies) |
| Indiana bank ratings (7 replies) |

Median year apartment built: 1970
Household type by relationship:
Households: 5,830- Male householders: 1,313 (446 living alone), Female householders: 1,357 (604 living alone)
1,093 spouses (1,066 opposite-sex spouses), 111 unmarried partners, (111 opposite-sex unmarried partners), 1,497 children (1,313 natural, 100 adopted, 83 stepchildren), 161 grandchildren, 0 brothers or sisters, 33 parents, 9 foster children, 90 other relatives, 122 non-relatives
- In group quarters: 39
Size of family households: 805 2-persons, 388 3-persons, 199 4-persons, 111 5-persons, 61 6-persons, 14 7-or-more-persons.
Size of nonfamily households: 1,076 1-person, 53 2-persons, 18 3-persons.
820 married couples with children.
386 single-parent households (144 men, 242 women).
98.2% of residents of Hartford City speak English at home.
0.9% of residents speak Spanish at home (84% speak English very well, 16% speak English well).
0.9% of residents speak other language at home (100% speak English very well).
Foreign born population: 62 (1.1%)
(0.0% of them are naturalized citizens)
| Here: | 6.3 |
| State: | 6.6 |
| Here: | 4.3 |
| State: | 4.3 |
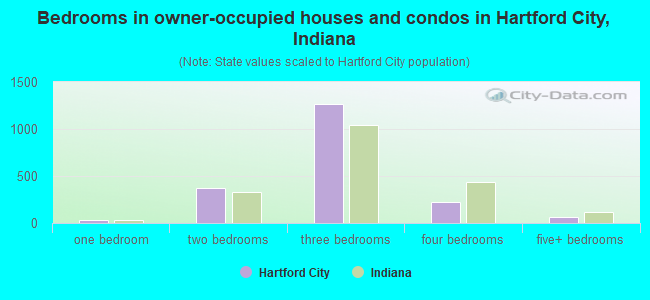
- Bedrooms in owner-occupied houses and condos in Hartford City, Indiana
- 0no bedroom
- 371 bedroom
- 3702 bedrooms
- 1,2713 bedrooms
- 2224 bedrooms
- 605+ bedrooms
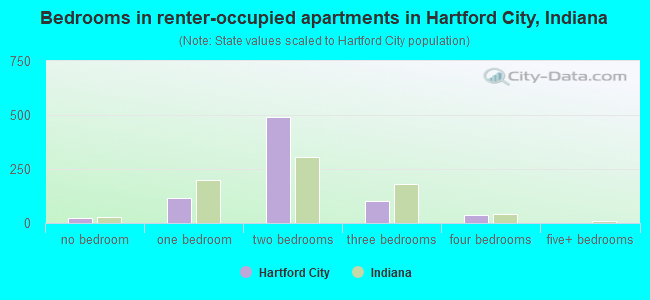
- Bedrooms in renter-occupied apartments in Hartford City, Indiana
- 25no bedroom
- 1141 bedroom
- 4922 bedrooms
- 1003 bedrooms
- 354 bedrooms
- 05+ bedrooms
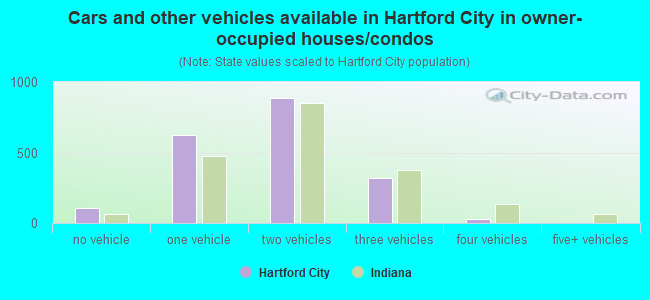
- Cars and other vehicles available in Hartford City in owner-occupied houses/condos
- 104no vehicle
- 6211 vehicle
- 8882 vehicles
- 3173 vehicles
- 304 vehicles
- 05+ vehicles
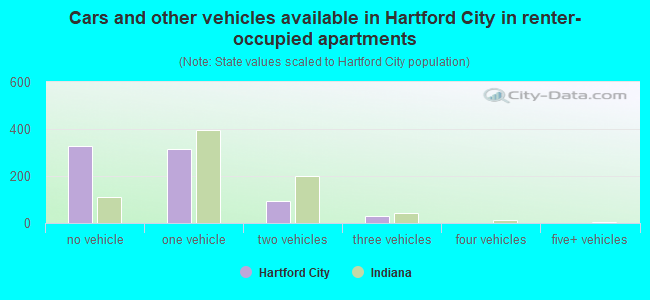
- Cars and other vehicles available in Hartford City in renter-occupied apartments
- 328no vehicle
- 3161 vehicle
- 922 vehicles
- 293 vehicles
- 04 vehicles
- 05+ vehicles
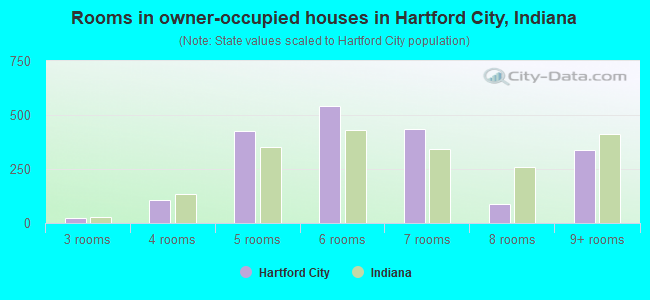
- Rooms in owner-occupied houses in Hartford City, Indiana
- 01 room
- 02 rooms
- 223 rooms
- 1074 rooms
- 4255 rooms
- 5416 rooms
- 4367 rooms
- 898 rooms
- 3399+ rooms
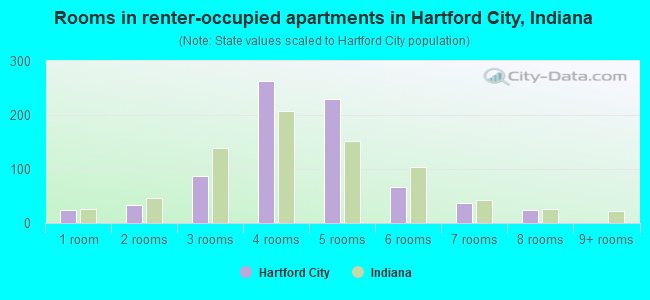
- Rooms in renter-occupied apartments in Hartford City, Indiana
- 251 room
- 332 rooms
- 873 rooms
- 2634 rooms
- 2305 rooms
- 676 rooms
- 377 rooms
- 248 rooms
- 09+ rooms
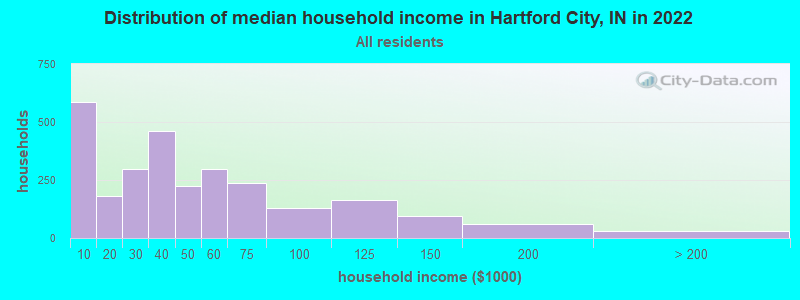
Hartford City, IN household income distribution

- 585Less than $10,000
- 182$10,000 to $19,999
- 299$20,000 to $29,999
- 461$30,000 to $39,999
- 222$40,000 to $49,999
- 299$50,000 to $59,999
- 239$60,000 to $74,999
- 130$75,000 to $99,999
- 165$100,000 to $124,999
- 96$125,000 to $149,999
- 60$150,000 to $199,999
- 30$200,000 or more
Home value of owner - occupied houses in 2022 in Hartford City, IN
-
- 29Less than $10,000
- 27$10,000 to $14,999
- 17$15,000 to $19,999
- 59$20,000 to $24,999
- 65$25,000 to $29,999
- 37$30,000 to $34,999
- 53$35,000 to $39,999
- 146$40,000 to $49,999
- 250$50,000 to $59,999
- 177$60,000 to $69,999
- 154$70,000 to $79,999
- 101$80,000 to $89,999
- 75$90,000 to $99,999
- 148$100,000 to $124,999
- 44$125,000 to $149,999
- 114$150,000 to $174,999
- 83$175,000 to $199,999
- 91$200,000 to $249,999
- 27$250,000 to $299,999
- 7$1,500,000 to $1,999,999

Rent paid by renters in 2022 in Hartford City, IN
-
- 97$100 to $149
- 6$150 to $199
- 10$250 to $299
- 14$300 to $349
- 72$350 to $399
- 77$400 to $449
- 58$450 to $499
- 82$500 to $549
- 160$550 to $599
- 12$600 to $649
- 8$650 to $699
- 15$700 to $749
- 13$750 to $799
- 14$800 to $899
- 55No cash rent
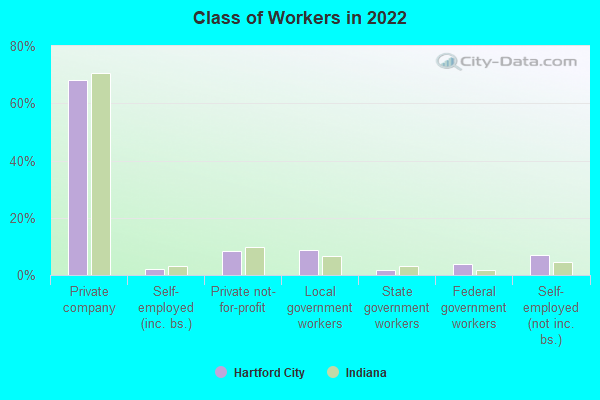
Percentage of workers working in this county: 54.7%
Number of people working at home: 61 (3.3% of all workers)
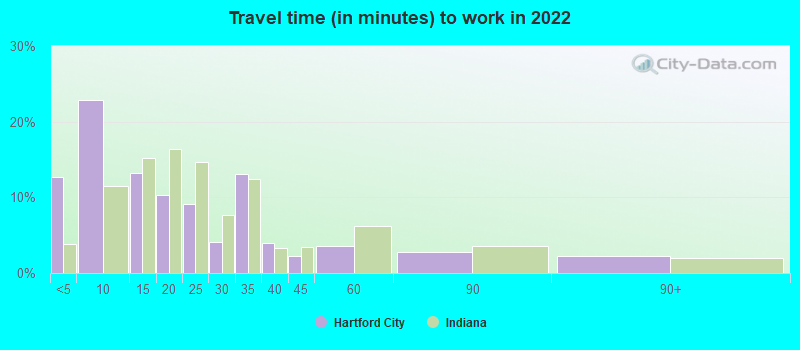
Travel time to work (commute)
- Less than 5 minutes: 230
- 5 to 9 minutes: 383
- 10 to 14 minutes: 232
- 15 to 19 minutes: 84
- 20 to 24 minutes: 243
- 25 to 29 minutes: 120
- 30 to 34 minutes: 143
- 35 to 39 minutes: 59
- 40 to 44 minutes: 67
- 45 to 59 minutes: 52
- 60 to 89 minutes: 83
- 90 or more minutes: 44
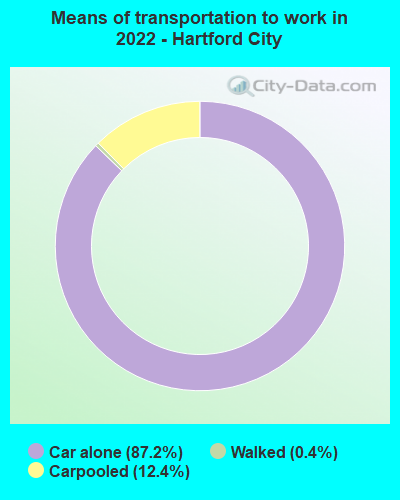
Means of transportation to work:
- Drove a car alone: 1,292 (81.4%)
- Carpooled: 202 (12.7%)
- Walked: 5 (0.3%)
- Worked at home: 61 (3.8%)
- Unemployment by race in 2022
- Unemployment rate for White non-Hispanic residents
- 6.7%Males
- 6.9%Females
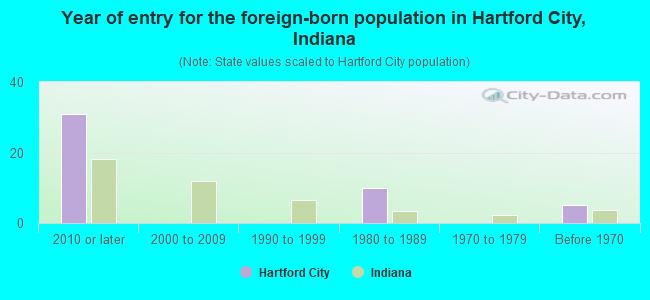
- Year of entry for the foreign-born population in Hartford City, Indiana
- 312010 or later
- 02000 to 2009
- 01990 to 1999
- 101980 to 1989
- 01970 to 1979
- 5Before 1970
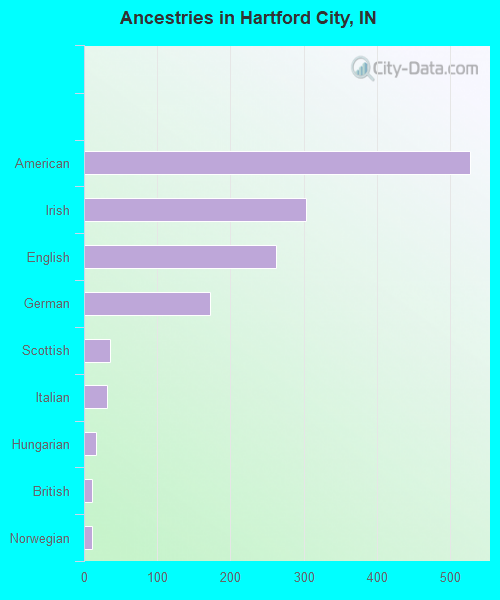
First ancestries reported:
- American: 527 (28.2%)
- Irish: 304 (16.3%)
- English: 262 (14.0%)
- German: 172 (9.2%)
- Scottish: 35 (1.9%)
- Italian: 31 (1.7%)
- Hungarian: 17 (0.9%)
- British: 11 (0.6%)
- Norwegian: 11 (0.6%)
- Welsh: 4 (0.2%)
Most common places of birth for foreign-born residents (%):
| Hartford City: | 56.5% (35) |
| Indiana: | 2.1% (7,834) |
| Hartford City: | 40.3% (25) |
| Indiana: | 27.0% (101,996) |
Place of birth for U.S.-born residents:
- This state: 4,635
- Other state: 1,084
- Northeast: 85
- Midwest: 443
- South: 454
- West: 95
90.9% of Hartford City residents lived in the same house 1 years ago.
Out of people who lived in different houses, 26.8% lived in this county.
Out of people who lived in different counties, 75.9% lived in Indiana.
| Hartford City: | 90.9% |
| State average: | 87.1% |
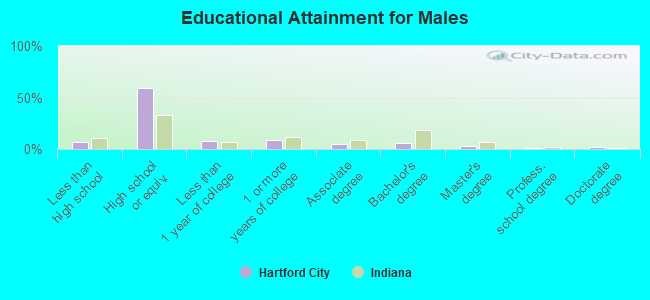
Education attainment for males 25 years and older:
- No schooling: 24
- Nursery to 4th grade: 0
- 5th and 6th grade: 0
- 7th and 8th grade: 0
- 9th grade: 18
- 10th grade: 72
- 11th grade: 10
- 12th grade, no diploma: 7
- High school graduate (or equivalency): 1,073
- Less than 1 year of college: 148
- Some college more than 1 year, no degree: 166
- Associate degree: 83
- Bachelor's degree: 110
- Master's degree: 47
- Professional school degree: 11
- Doctorate degree: 38
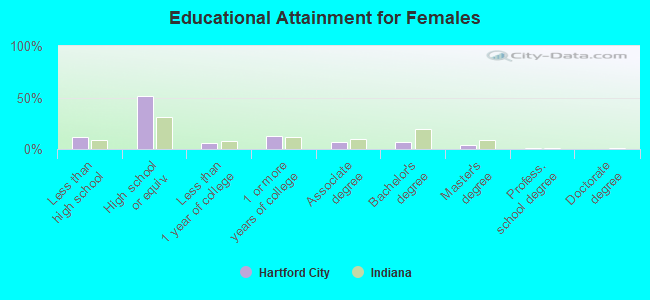
Education attainment for females 25 years and older:
- No schooling: 0
- Nursery to 4th grade: 0
- 5th and 6th grade: 0
- 7th and 8th grade: 52
- 9th grade: 42
- 10th grade: 72
- 11th grade: 47
- 12th grade, no diploma: 23
- High school graduate (or equivalency): 1,085
- Less than 1 year of college: 129
- Some college more than 1 year, no degree: 265
- Associate degree: 140
- Bachelor's degree: 142
- Master's degree: 87
- Professional school degree: 19
- Doctorate degree: 0


Housing units in structures:
- One, detached: 2,347
- One, attached: 147
- Two: 45
- 3 or 4: 137
- 5 to 9: 158
- 10 to 19: 57
- 20 to 49: 117
- 50 or more: 6
- Mobile homes: 120
Median worth of mobile homes: $35,728
Housing units lacking complete kitchen facilities in 2022: 3.7%
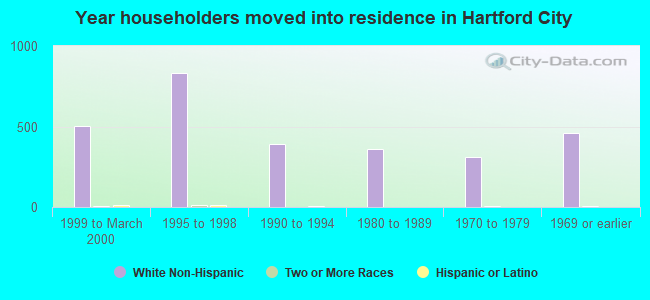
House/condo owner moved in on average 8 years ago
Renter moved in on average 5 years ago
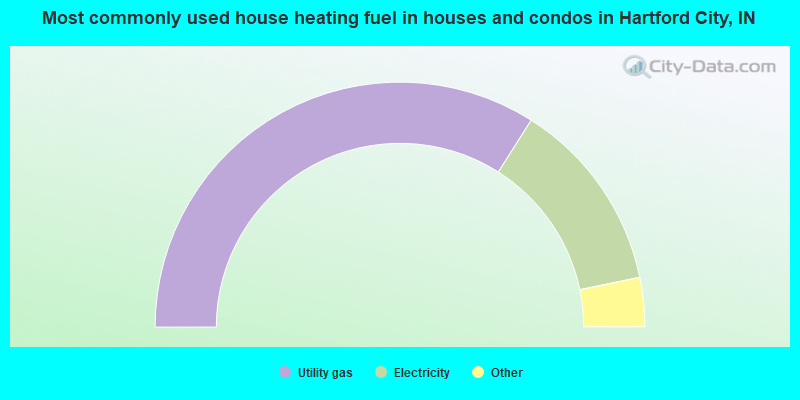
- 68.0%Utility gas
- 25.5%Electricity
- 3.3%Bottled, tank, or LP gas
- 2.9%Wood
- 0.4%Fuel oil, kerosene, etc.
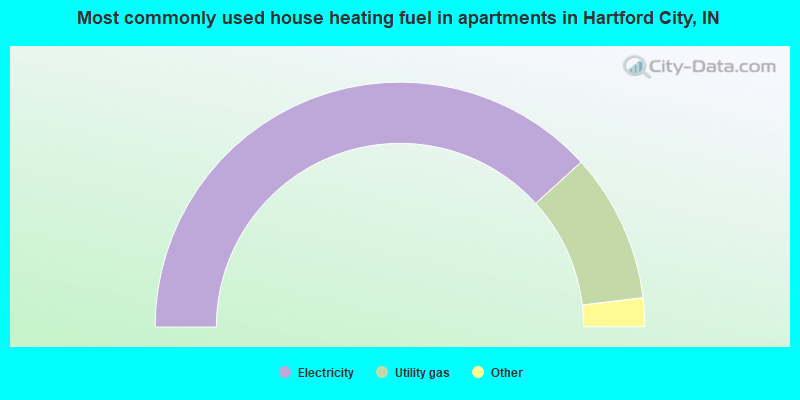
- 76.6%Electricity
- 19.7%Utility gas
- 2.4%No fuel used
- 1.2%Bottled, tank, or LP gas
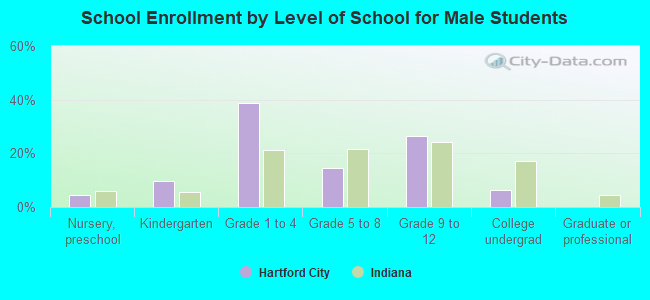
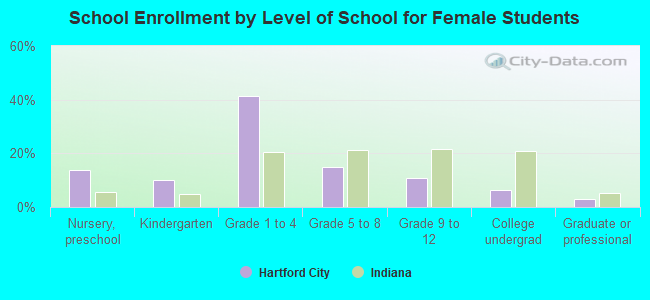
Private vs. public school enrollment:
| Here: | 19.0% |
| Indiana: | 14.9% |
| Here: | 5.2% |
| Indiana: | 11.4% |
| Here: | 46.1% |
| Indiana: | 22.3% |