Harwood Heights, IL (Illinois) Houses and Residents
| Harwood Heights: | $314,536 |
| Illinois: | $251,600 |
Mean price in 2022:
Detached houses: $349,042
Here: $349,042 State: $310,164 Townhouses or other attached units: $452,498
Here: $452,498 State: $286,230 In 2-unit structures: $343,610
Here: $343,610 State: $299,638 In 3-to-4-unit structures: $441,584
Here: $441,584 State: $330,907 In 5-or-more-unit structures: $318,655
Here: $318,655 State: $318,887
Total population: 8,675 (Urban population: 8,226, Rural population: 0)
Houses: 3,720 (3,598 occupied: 2,166 owner occupied, 1,493 renter occupied)
| % of renters here: | 41% |
| State: | 33% |
Housing density: 4,526 houses/condos per square mile
Median price asked for vacant for-sale houses and condos in 2022: $839,095.
Median contract rent in 2022: $1,060 (lower quartile is $910, upper quartile is $1,226)
Median rent asked for vacant for-rent units in 2022: $1,800
Median gross rent in Harwood Heights, IL in 2022: $1,115
Housing units in Harwood Heights with a mortgage: 1,226 (131 second mortgage, 0 home equity loan, 113 both second mortgage and home equity loan)
Houses without a mortgage: 5
Median household income for houses/condos with a mortgage: $105,181
Median household income for apartments without a mortgage: $89,006
Median monthly housing costs: $1,169
Compare current foreclosures in Harwood Heights, IL:
| Photo | Address | Area | Beds / Baths | Price | Details |
|---|---|---|---|---|---|

|
#1
N New England Ave
Harwood Heights, IL 60706
|
1,050 sq. feet
|
2 baths - beds |
show details | |

|
#2
N Ozark Ave
Harwood Heights, IL 60706
|
1,497 sq. feet
|
2 baths - beds |
show details | |

|
#3
W Argyle St
Harwood Heights, IL 60706
|
1,260 sq. feet
|
1 baths - beds |
show details | |

|
#4
W Sunnyside Ave
Harwood Heights, IL 60706
|
1,420 sq. feet
|
2 baths - beds |
show details | |

|
#5
N Ottawa Ave
Harwood Heights, IL 60706
|
1,476 sq. feet
|
2 baths - beds |
show details | |

|
#6
W Leland Ave
Harwood Heights, IL 60706
|
1,404 sq. feet
|
2 baths - beds |
show details | |

|
#7
N Newcastle Ave
Harwood Heights, IL 60706
|
1,160 sq. feet
|
1 baths - beds |
show details | |

|
#8
N Nordica Ave
Harwood Heights, IL 60706
|
1,121 sq. feet
|
1 baths - beds |
show details | |

|
#9
N Newland Ave
Harwood Heights, IL 60706
|
1,464 sq. feet
|
2 baths - beds |
show details | |

|
#10
W Foster Ave
Harwood Heights, IL 60706
|
1,640 sq. feet
|
1 baths - beds |
show details |
| Photo | Address | Area | Beds / Baths | Price | Details |
|---|---|---|---|---|---|

|
#11
N Osceola Ave
Harwood Heights, IL 60706
|
1,101 sq. feet
|
1 baths - beds |
show details | |

|
#12
N Nagle Ave
Harwood Heights, IL 60706
|
1,597 sq. feet
|
2 baths - beds |
show details | |

|
#13
N Thatcher Ave
Harwood Heights, IL 60706
|
1,116 sq. feet
|
1 baths - beds |
show details | |

|
#14
W Argyle St
Harwood Heights, IL 60706
|
1,240 sq. feet
|
1 baths - beds |
show details | |

|
#15
N Osceola Ave
Harwood Heights, IL 60706
|
572 sq. feet
|
3 baths - beds |
show details | |

|
#16
W Gunnison St
Harwood Heights, IL 60706
|
1,166 sq. feet
|
1 baths - beds |
show details | |

|
#17
W Argyle St
Harwood Heights, IL 60706
|
1,009 sq. feet
|
1 baths - beds |
show details | |

|
#18
W Ainslie St
Harwood Heights, IL 60706
|
1,080 sq. feet
|
1 baths - beds |
show details | |

|
#19
N New England Ave
Harwood Heights, IL 60706
|
1,200 sq. feet
|
1 baths - beds |
show details | |

|
#20
W Ainslie St
Harwood Heights, IL 60706
|
818 sq. feet
|
1 baths - beds |
show details |
| Photo | Address | Area | Beds / Baths | Price | Details |
|---|---|---|---|---|---|

|
#21
N Oriole Ave
Harwood Heights, IL 60706
|
1,074 sq. feet
|
1 baths - beds |
show details | |

|
#22
N Canfield Ave
Harwood Heights, IL 60706
|
1,754 sq. feet
|
1 baths - beds |
show details | |

|
#23
N Clifton Ave
Harwood Heights, IL 60706
|
1,225 sq. feet
|
1 baths - beds |
show details | |

|
#24
N Oconto Ave
Harwood Heights, IL 60706
|
816 sq. feet
|
1 baths - beds |
show details | |

|
#25
W Winona St
Harwood Heights, IL 60706
|
- sq. feet
|
- baths - beds |
show details | |

|
#26
W Gunnison St Ste 711e
Harwood Heights, IL 60706
|
- sq. feet
|
- baths - beds |
show details | |

|
#27
N East River Rd # 1712
Harwood Heights, IL 60706
|
- sq. feet
|
- baths - beds |
show details | |

|
#28
N Oak Park Ave
Harwood Heights, IL 60706
|
- sq. feet
|
- baths - beds |
show details | |

|
#29
N East River Rd Unit 1b
Harwood Heights, IL 60706
|
- sq. feet
|
- baths - beds |
show details | |

|
#30
N East River Rd # 3104s
Harwood Heights, IL 60706
|
- sq. feet
|
- baths - beds |
show details |
| Photo | Address | Area | Beds / Baths | Price | Details |
|---|---|---|---|---|---|

|
#31
W Gunnison St Apt 908
Harwood Heights, IL 60706
|
- sq. feet
|
- baths - beds |
show details | |

|
#32
W Norridge St
Harwood Heights, IL 60706
|
- sq. feet
|
- baths - beds |
show details | |

|
#33
N Olcott Ave Apt Ge
Harwood Heights, IL 60706
|
- sq. feet
|
- baths - beds |
show details | |

|
#34
N Nagle Ave Apt 2e
Harwood Heights, IL 60706
|
- sq. feet
|
- baths - beds |
show details | |

|
#35
W Irving Park Rd # B
Harwood Heights, IL 60706
|
- sq. feet
|
- baths - beds |
show details | |

|
#36
W Foster Ave Unit 605
Harwood Heights, IL 60706
|
- sq. feet
|
- baths - beds |
show details | |

|
#37
W Cullom Ave Unit 305
Harwood Heights, IL 60706
|
- sq. feet
|
- baths - beds |
show details | |

|
Check over 1 million property listings on Foreclosure.com!
|
browse all offers | |||


 | Gay Couple Moving to Chicago. Advise Please. (19 replies) |
| Haaalp! Chicago Northwest Suburbs (21 replies) |
| Looking for SFH in walkable suburb with good schools (10 replies) |
| Lombard/Glen Ellyn vs Norridge/Harwood Heights (52 replies) |
| Why doesn't Chicago have any super-dense suburbs? (25 replies) |
| How bad is the airplane noises in Harwood Heights? (5 replies) |

Median year apartment built: 1971
Household type by relationship:
Households: 8,743- Male householders: 1,789 (420 living alone), Female householders: 1,714 (494 living alone)
1,817 spouses (1,794 opposite-sex spouses), 145 unmarried partners, (145 opposite-sex unmarried partners), 2,478 children (2,332 natural, 55 adopted, 89 stepchildren), 156 grandchildren, 125 brothers or sisters, 226 parents, 23 foster children, 188 other relatives, 72 non-relatives
- In group quarters: 4
Size of family households: 1,130 2-persons, 569 3-persons, 469 4-persons, 162 5-persons, 83 6-persons, 62 7-or-more-persons.
Size of nonfamily households: 983 1-person, 183 2-persons.
1,381 married couples with children.
239 single-parent households (0 men, 239 women).
32.6% of residents of Harwood Heights speak English at home.
13.0% of residents speak Spanish at home (69% speak English very well, 23% speak English well, 8% speak English not well).
44.2% of residents speak other Indo-European language at home (50% speak English very well, 20% speak English well, 26% speak English not well, 4% don't speak English at all).
10.0% of residents speak Asian or Pacific Island language at home (50% speak English very well, 42% speak English well, 8% speak English not well, 1% don't speak English at all).
1.4% of residents speak other language at home (82% speak English very well, 7% speak English well, 11% speak English not well).
Foreign born population: 4,008 (45.8%)
(68.8% of them are naturalized citizens)
| Here: | 5.6 |
| State: | 6.4 |
| Here: | 3.7 |
| State: | 4.1 |

- Bedrooms in owner-occupied houses and condos in Harwood Heights, Illinois
- 10no bedroom
- 311 bedroom
- 8092 bedrooms
- 9133 bedrooms
- 2514 bedrooms
- 1525+ bedrooms

- Bedrooms in renter-occupied apartments in Harwood Heights, Illinois
- 164no bedroom
- 6151 bedroom
- 4982 bedrooms
- 2163 bedrooms
- 04 bedrooms
- 05+ bedrooms

- Cars and other vehicles available in Harwood Heights in owner-occupied houses/condos
- 152no vehicle
- 6811 vehicle
- 8952 vehicles
- 2783 vehicles
- 1364 vehicles
- 255+ vehicles

- Cars and other vehicles available in Harwood Heights in renter-occupied apartments
- 207no vehicle
- 9041 vehicle
- 2712 vehicles
- 1113 vehicles
- 04 vehicles
- 05+ vehicles

- Rooms in owner-occupied houses in Harwood Heights, Illinois
- 01 room
- 02 rooms
- 1463 rooms
- 4214 rooms
- 4755 rooms
- 5256 rooms
- 2137 rooms
- 1958 rooms
- 1919+ rooms

- Rooms in renter-occupied apartments in Harwood Heights, Illinois
- 1541 room
- 962 rooms
- 3563 rooms
- 4384 rooms
- 3885 rooms
- 416 rooms
- 107 rooms
- 08 rooms
- 99+ rooms


Harwood Heights, IL household income distribution

- 157Less than $10,000
- 161$10,000 to $19,999
- 263$20,000 to $29,999
- 224$30,000 to $39,999
- 293$40,000 to $49,999
- 221$50,000 to $59,999
- 487$60,000 to $74,999
- 443$75,000 to $99,999
- 585$100,000 to $124,999
- 246$125,000 to $149,999
- 316$150,000 to $199,999
- 273$200,000 or more
Home value of owner - occupied houses in 2022 in Harwood Heights, IL
-
- 85Less than $10,000
- 8$25,000 to $29,999
- 8$80,000 to $89,999
- 49$100,000 to $124,999
- 20$125,000 to $149,999
- 55$150,000 to $174,999
- 93$175,000 to $199,999
- 275$200,000 to $249,999
- 445$250,000 to $299,999
- 765$300,000 to $399,999
- 280$400,000 to $499,999
- 92$500,000 to $749,999
- 8$1,000,000 to $1,499,999
- 46$2,000,000 or more
Rent paid by renters in 2022 in Harwood Heights, IL
-
- 11$400 to $449
- 4$550 to $599
- 10$700 to $749
- 37$750 to $799
- 289$800 to $899
- 234$900 to $999
- 565$1,000 to $1,249
- 128$1,250 to $1,499
- 171$1,500 to $1,999
- 8$2,000 to $2,499
- 75No cash rent


Percentage of workers working in this county: 87.1%
Number of people working at home: 546 (11.6% of all workers)
Travel time to work (commute)
- Less than 5 minutes: 81
- 5 to 9 minutes: 162
- 10 to 14 minutes: 357
- 15 to 19 minutes: 690
- 20 to 24 minutes: 357
- 25 to 29 minutes: 242
- 30 to 34 minutes: 934
- 35 to 39 minutes: 197
- 40 to 44 minutes: 207
- 45 to 59 minutes: 421
- 60 to 89 minutes: 316
- 90 or more minutes: 87
Means of transportation to work:
- Drove a car alone: 2,126 (63.7%)
- Carpooled: 306 (9.2%)
- Bus: 230 (6.9%)
- Subway or elevated rail: 1 (0.0%)
- Taxi: 54 (1.6%)
- Bicycle: 12 (0.4%)
- Walked: 118 (3.5%)
- Worked at home: 546 (16.4%)

- Unemployment by race in 2022
- Unemployment rate for White non-Hispanic residents
- 5.5%Males
- 1.5%Females
- Unemployment rate for other race residents
- 6.5%Females
- Unemployment rate for two or more race residents
- 15.6%Females
- Unemployment rate for Hispanic or Latino residents
- 4.8%Males
- 4.9%Females

- Year of entry for the foreign-born population in Harwood Heights, Illinois
- 1,0652010 or later
- 1,0062000 to 2009
- 8651990 to 1999
- 5891980 to 1989
- 4561970 to 1979
- 803Before 1970
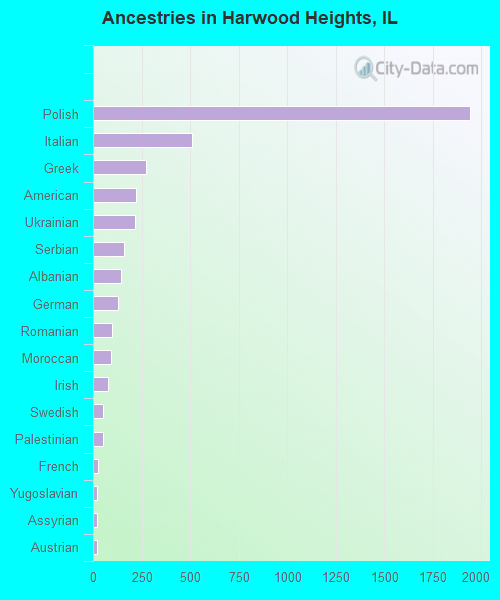
First ancestries reported:
- Polish: 1,943 (33.2%)
- Italian: 512 (8.8%)
- Greek: 275 (4.7%)
- American: 224 (3.8%)
- Ukrainian: 218 (3.7%)
- Serbian: 161 (2.8%)
- Albanian: 143 (2.4%)
- German: 130 (2.2%)
- Romanian: 96 (1.6%)
- Moroccan: 95 (1.6%)
- Irish: 75 (1.3%)
- Swedish: 54 (0.9%)
- Palestinian: 49 (0.8%)
- French: 26 (0.4%)
- Yugoslavian: 22 (0.4%)
- Assyrian: 20 (0.3%)
- Austrian: 20 (0.3%)
- Dutch: 17 (0.3%)
- European: 9 (0.2%)
- Finnish: 6 (0.1%)
- Scotch-Irish: 6 (0.1%)
- Kenyan: 1 (0.02%)
Most common places of birth for foreign-born residents (%):
| Harwood Heights: | 37.6% (1,508) |
| Illinois: | 6.9% (124,474) |
| Harwood Heights: | 15.6% (624) |
| Illinois: | 5.2% (93,003) |
| Harwood Heights: | 7.4% (298) |
| Illinois: | 1.6% (29,316) |
| Harwood Heights: | 4.2% (169) |
| Illinois: | 1.2% (22,269) |
| Harwood Heights: | 4.1% (163) |
| Illinois: | 0.9% (15,679) |
| Harwood Heights: | 3.8% (151) |
| Illinois: | 34.7% (626,958) |
| Harwood Heights: | 3.0% (121) |
| Illinois: | 1.3% (22,793) |
| Harwood Heights: | 2.8% (112) |
| Illinois: | 0.6% (10,720) |
| Harwood Heights: | 2.0% (81) |
| Illinois: | 0.4% (7,171) |
| Harwood Heights: | 1.6% (64) |
| Illinois: | 0.4% (6,488) |
| Harwood Heights: | 1.6% (63) |
| Illinois: | 0.2% (3,781) |
Place of birth for U.S.-born residents:
- This state: 4,366
- Other state: 222
- Northeast: 69
- Midwest: 93
- South: 62
- West: 0
92.5% of Harwood Heights residents lived in the same house 1 years ago.
Out of people who lived in different houses, 47.6% lived in this county.
Out of people who lived in different counties, 72.7% lived in Illinois.
| Harwood Heights: | 92.5% |
| State average: | 88.3% |
Education attainment for males 25 years and older:
- No schooling: 116
- Nursery to 4th grade: 4
- 5th and 6th grade: 15
- 7th and 8th grade: 96
- 9th grade: 23
- 10th grade: 63
- 11th grade: 0
- 12th grade, no diploma: 123
- High school graduate (or equivalency): 903
- Less than 1 year of college: 309
- Some college more than 1 year, no degree: 467
- Associate degree: 229
- Bachelor's degree: 524
- Master's degree: 171
- Professional school degree: 114
- Doctorate degree: 61

Education attainment for females 25 years and older:
- No schooling: 52
- Nursery to 4th grade: 0
- 5th and 6th grade: 42
- 7th and 8th grade: 73
- 9th grade: 12
- 10th grade: 86
- 11th grade: 0
- 12th grade, no diploma: 213
- High school graduate (or equivalency): 777
- Less than 1 year of college: 232
- Some college more than 1 year, no degree: 275
- Associate degree: 287
- Bachelor's degree: 755
- Master's degree: 263
- Professional school degree: 14
- Doctorate degree: 24


Housing units in structures:
- One, detached: 1,773
- One, attached: 14
- Two: 213
- 3 or 4: 219
- 5 to 9: 709
- 10 to 19: 175
- 20 to 49: 216
- 50 or more: 397
House/condo owner moved in on average 10 years ago
Renter moved in on average 3 years ago

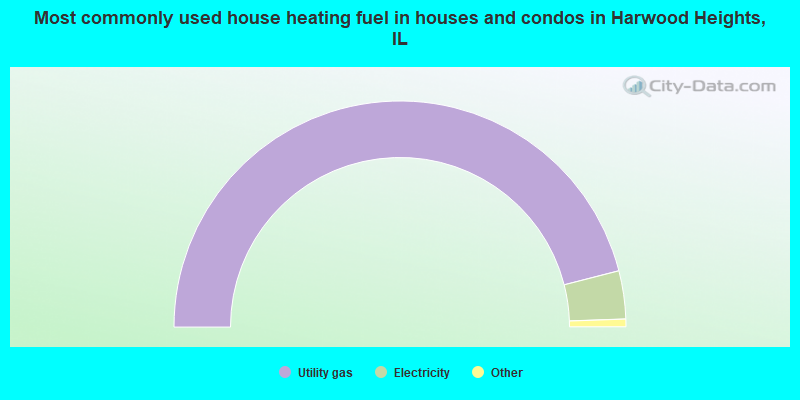
- 92.0%Utility gas
- 6.9%Electricity
- 0.7%No fuel used
- 0.4%Bottled, tank, or LP gas
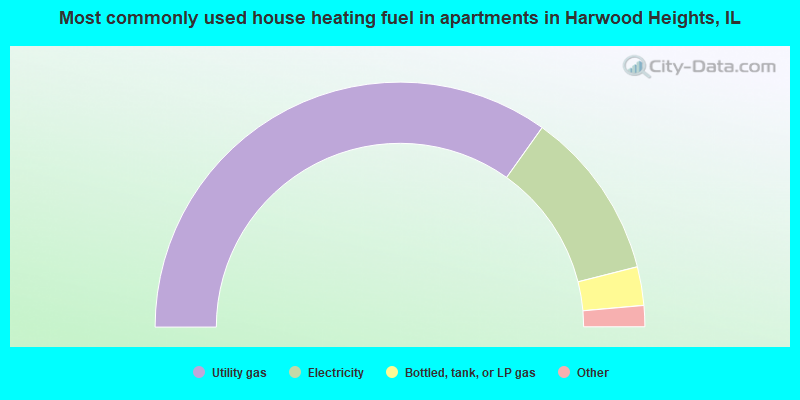
- 69.8%Utility gas
- 22.4%Electricity
- 5.1%Bottled, tank, or LP gas
- 2.1%Other fuel
- 0.5%No fuel used
Private vs. public school enrollment:
| Here: | 7.4% |
| Illinois: | 13.3% |
| Here: | 10.8% |
| Illinois: | 9.9% |
| Here: | 32.2% |
| Illinois: | 27.4% |


