Hatfield, MA (Massachusetts) Houses and Residents
| Hatfield: | $486,561 |
| Massachusetts: | $534,700 |
Mean price in 2022:
Detached houses: $484,527
Here: $484,527 State: $651,570 Townhouses or other attached units: $332,650
Here: $332,650 State: $617,749 In 2-unit structures: $151,547
Here: $151,547 State: $594,808
Total population: 1,318 (Urban population: 1,060, Rural population: 311 (all nonfarm))
Houses: 653 (621 occupied: 474 owner occupied, 146 renter occupied)
| % of renters here: | 24% |
| State: | 38% |
Housing density: 280 houses/condos per square mile
Median price asked for vacant for-sale houses and condos in 2022 in this county: $222,792.
Median contract rent in 2022: $802 (lower quartile is $489, upper quartile is $1,572)
Median rent asked for vacant for-rent units in 2022: $1,125
Median gross rent in Hatfield, MA in 2022: $981
Housing units in Hatfield with a mortgage: 255 (43 second mortgage, 0 home equity loan, 37 both second mortgage and home equity loan)
Houses without a mortgage: 39
Median household income for houses/condos with a mortgage: $138,869
Median household income for apartments without a mortgage: $96,908
Median monthly housing costs: $1,412
Compare current foreclosures near Hatfield, MA:
| Photo | Address | Area | Beds / Baths | Price | Details |
|---|---|---|---|---|---|

|
#1
North St
Hatfield, MA 01038
|
1,900 sq. feet
|
1 baths 3 beds |
show details | |

|
#2
Bridge St # 1
Hatfield, MA 01038
|
3,300 sq. feet
|
3 baths 4 beds |
show details | |

|
#3
Cold Spring Rd
Southampton, MA 01073
|
2,736 sq. feet
|
1 baths 3 beds |
$284,900
|
show details |

|
#4
W Franklin St
Holyoke, MA 01040
|
1,558 sq. feet
|
1 baths 2 beds |
$234,900
|
show details |

|
#5
Ontario St
Springfield, MA 01104
|
1,405 sq. feet
|
1 baths 3 beds |
show details | |

|
#6
Artisan St
Chicopee, MA 01013
|
1,125 sq. feet
|
1 baths 3 beds |
show details | |

|
#7
Laroche St
Ludlow, MA 01056
|
1,321 sq. feet
|
1 baths 3 beds |
show details | |

|
#8
Notre Dame St
Springfield, MA 01104
|
1,310 sq. feet
|
2 baths 4 beds |
show details | |

|
#9
Pleasant St
Holyoke, MA 01040
|
4,057 sq. feet
|
3 baths 6 beds |
show details | |

|
#10
Central Park Dr
Holyoke, MA 01040
|
2,844 sq. feet
|
2 baths 4 beds |
show details |
| Photo | Address | Area | Beds / Baths | Price | Details |
|---|---|---|---|---|---|

|
#11
Royal St
Chicopee, MA 01020
|
3,296 sq. feet
|
4 baths 7 beds |
show details | |

|
#12
West St
Greenfield, MA 01301
|
1,858 sq. feet
|
2 baths 3 beds |
show details | |

|
#13
Butler Ave
Chicopee, MA 01020
|
1,445 sq. feet
|
1 baths 3 beds |
show details | |

|
#14
Brown Ave
Holyoke, MA 01040
|
2,388 sq. feet
|
2 baths 6 beds |
show details | |

|
#15
Wilfred St
Chicopee, MA 01020
|
1,360 sq. feet
|
1 baths 4 beds |
show details | |

|
#16
Sabans Rd
Conway, MA 01341
|
1,246 sq. feet
|
2 baths 3 beds |
show details | |

|
#17
Barna St
Ludlow, MA 01056
|
942 sq. feet
|
1 baths 3 beds |
show details | |

|
#18
Brush Hill Ave Apt 56
West Springfield, MA 01089
|
724 sq. feet
|
1 baths 1 beds |
show details | |

|
#19
Page Blvd
Springfield, MA 01104
|
1,440 sq. feet
|
2 baths 2 beds |
show details | |

|
#20
Dell St
Turners Falls, MA 01376
|
720 sq. feet
|
1 baths 1 beds |
show details |
| Photo | Address | Area | Beds / Baths | Price | Details |
|---|---|---|---|---|---|

|
#21
Labelle Cir
Chicopee, MA 01020
|
2,234 sq. feet
|
1 baths 4 beds |
show details | |

|
#22
Bessemer St
Springfield, MA 01104
|
1,272 sq. feet
|
2 baths 3 beds |
show details | |

|
#23
Mill Valley Rd
Belchertown, MA 01007
|
1,596 sq. feet
|
1 baths 3 beds |
show details | |

|
#24
Stebbins St
Chicopee, MA 01020
|
864 sq. feet
|
1 baths 2 beds |
show details | |

|
#25
Elliot St
Chicopee, MA 01020
|
1,183 sq. feet
|
1 baths 2 beds |
show details | |

|
#26
Price St
Springfield, MA 01104
|
990 sq. feet
|
1 baths 2 beds |
show details | |

|
#27
Arthur St
Springfield, MA 01104
|
823 sq. feet
|
1 baths 3 beds |
show details | |

|
#28
Bessemer St
Springfield, MA 01104
|
1,079 sq. feet
|
1 baths 4 beds |
show details | |

|
#29
Mary St
Chicopee, MA 01020
|
1,414 sq. feet
|
2 baths 4 beds |
show details | |

|
#30
Medford St
Chicopee, MA 01020
|
1,352 sq. feet
|
1 baths 3 beds |
show details |
| Photo | Address | Area | Beds / Baths | Price | Details |
|---|---|---|---|---|---|

|
#31
Maple St
Ludlow, MA 01056
|
1,701 sq. feet
|
2 baths 4 beds |
show details | |

|
#32
State St
Chicopee, MA 01013
|
1,632 sq. feet
|
1 baths 4 beds |
show details | |

|
#33
Pratt St
Erving, MA 01344
|
3,000 sq. feet
|
4 baths 7 beds |
show details | |

|
#34
Rolf Ave
Chicopee, MA 01020
|
2,354 sq. feet
|
2 baths 4 beds |
show details | |

|
#35
Davis St
Springfield, MA 01104
|
998 sq. feet
|
1 baths 2 beds |
show details | |

|
#36
Berkshire Ave
Indian Orchard, MA 01151
|
1,486 sq. feet
|
1 baths 3 beds |
show details | |

|
#37
Pasco Rd
Indian Orchard, MA 01151
|
1,760 sq. feet
|
2 baths 3 beds |
show details | |

|
#38
Garfield St
Greenfield, MA 01301
|
2,260 sq. feet
|
2 baths 4 beds |
show details | |

|
#39
Bircham St
Springfield, MA 01104
|
1,540 sq. feet
|
1 baths 3 beds |
show details | |

|
#40
Meridian St
Greenfield, MA 01301
|
768 sq. feet
|
1 baths 2 beds |
show details |
| Photo | Address | Area | Beds / Baths | Price | Details |
|---|---|---|---|---|---|

|
#41
Chicopee St Apt 21
Chicopee, MA 01013
|
774 sq. feet
|
1 baths 2 beds |
show details | |

|
#42
Grattan St
Chicopee, MA 01020
|
3,447 sq. feet
|
3 baths 8 beds |
show details | |

|
#43
Main St
Holyoke, MA 01040
|
1,438 sq. feet
|
1 baths 3 beds |
show details | |

|
#44
Grattan St
Chicopee, MA 01020
|
2,240 sq. feet
|
2 baths 4 beds |
show details | |

|
#45
Wells Ave
Chicopee, MA 01020
|
1,144 sq. feet
|
1 baths 3 beds |
show details | |

|
#46
Sheridan St
Chicopee, MA 01020
|
1,155 sq. feet
|
1 baths 3 beds |
show details | |

|
#47
Prokop Ave
Ludlow, MA 01056
|
960 sq. feet
|
2 baths 3 beds |
show details | |

|
#48
Deerfield St
Greenfield, MA 01301
|
1,496 sq. feet
|
2 baths 3 beds |
show details | |

|
#49
Hope St
Greenfield, MA 01301
|
1,619 sq. feet
|
1 baths 3 beds |
show details | |

|
Check over 1 million property listings on Foreclosure.com!
|
browse all offers | |||

Latest news about housing in Hatfield, MA collected exclusively by city-data.com from local newspapers, TV, and radio stations


Median year apartment built: 1967
Household type by relationship:
Households: 1,405- Male householders: 237 (54 living alone), Female householders: 410 (156 living alone)
357 spouses (357 opposite-sex spouses), 28 unmarried partners, (28 opposite-sex unmarried partners), 257 children (238 natural, 8 adopted, 10 stepchildren), 11 grandchildren, 16 brothers or sisters, 10 parents, 11 foster children, 11 other relatives, 45 non-relatives
- In group quarters: 6
Size of family households: 218 2-persons, 48 3-persons, 80 4-persons, 14 5-persons.
Size of nonfamily households: 199 1-person, 41 2-persons, 13 3-persons.
109 married couples with children.
0 single-parent households (0 men, 0 women).
89.1% of residents of Hatfield speak English at home.
8.4% of residents speak Spanish at home (100% speak English very well).
2.7% of residents speak other Indo-European language at home (100% speak English very well).
Foreign born population: 117 (8.3%)
(97.4% of them are naturalized citizens)
| Here: | 6.6 |
| State: | 6.5 |
| Here: | 4.8 |
| State: | 4.0 |

- Bedrooms in owner-occupied houses and condos in Hatfield, Massachusetts
- 0no bedroom
- 131 bedroom
- 1472 bedrooms
- 1863 bedrooms
- 1014 bedrooms
- 275+ bedrooms

- Bedrooms in renter-occupied apartments in Hatfield, Massachusetts
- 0no bedroom
- 791 bedroom
- 132 bedrooms
- 553 bedrooms
- 04 bedrooms
- 05+ bedrooms

- Cars and other vehicles available in Hatfield in owner-occupied houses/condos
- 0no vehicle
- 1161 vehicle
- 2312 vehicles
- 423 vehicles
- 704 vehicles
- 165+ vehicles

- Cars and other vehicles available in Hatfield in renter-occupied apartments
- 0no vehicle
- 1241 vehicle
- 232 vehicles
- 03 vehicles
- 04 vehicles
- 05+ vehicles

- Rooms in owner-occupied houses in Hatfield, Massachusetts
- 01 room
- 42 rooms
- 03 rooms
- 214 rooms
- 1405 rooms
- 736 rooms
- 857 rooms
- 718 rooms
- 819+ rooms

- Rooms in renter-occupied apartments in Hatfield, Massachusetts
- 01 room
- 442 rooms
- 73 rooms
- 234 rooms
- 325 rooms
- 266 rooms
- 07 rooms
- 148 rooms
- 09+ rooms


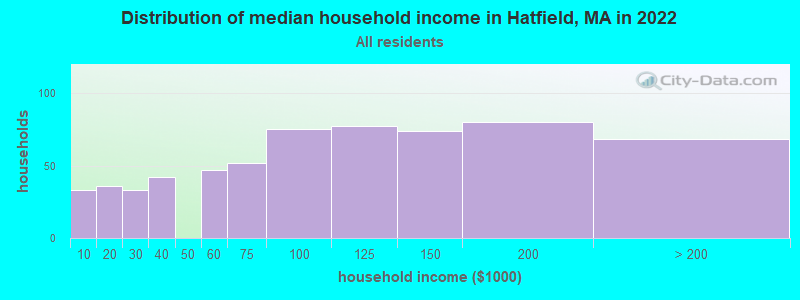
Hatfield, MA household income distribution

- 33Less than $10,000
- 36$10,000 to $19,999
- 33$20,000 to $29,999
- 42$30,000 to $39,999
- 47$50,000 to $59,999
- 52$60,000 to $74,999
- 75$75,000 to $99,999
- 77$100,000 to $124,999
- 74$125,000 to $149,999
- 80$150,000 to $199,999
- 68$200,000 or more
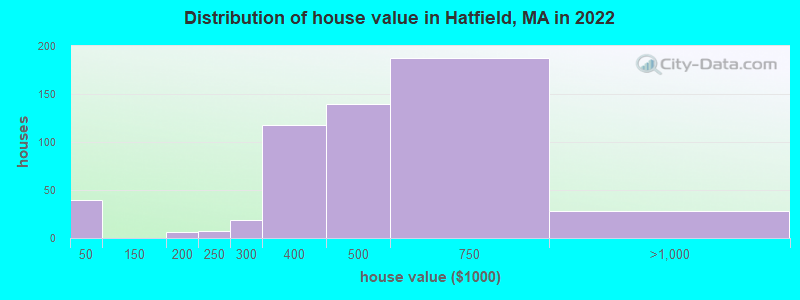
Home value of owner - occupied houses in 2022 in Hatfield, MA
-
- 39Less than $10,000
- 6$150,000 to $174,999
- 7$200,000 to $249,999
- 19$250,000 to $299,999
- 118$300,000 to $399,999
- 140$400,000 to $499,999
- 187$500,000 to $749,999
- 28$750,000 to $999,999
Rent paid by renters in 2022 in Hatfield, MA
-
- 12$250 to $299
- 13$300 to $349
- 17$400 to $449
- 4$500 to $549
- 36$600 to $649
- 8$750 to $799
- 5$800 to $899
- 11$1,000 to $1,249
- 8$1,250 to $1,499
- 21$1,500 to $1,999
- 19$2,000 to $2,499


Percentage of workers working in this county: 80.4%
Number of people working at home: 162 (21.8% of all workers)
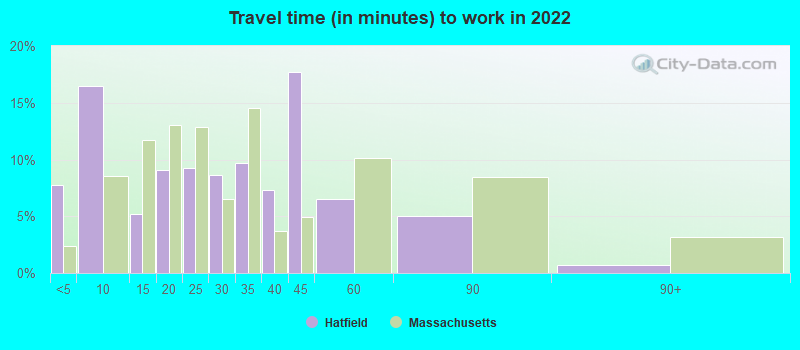
Travel time to work (commute)
- Less than 5 minutes: 35
- 5 to 9 minutes: 41
- 10 to 14 minutes: 131
- 15 to 19 minutes: 98
- 20 to 24 minutes: 170
- 25 to 29 minutes: 19
- 30 to 34 minutes: 91
- 35 to 39 minutes: 24
- 40 to 44 minutes: 8
- 45 to 59 minutes: 20
- 60 to 89 minutes: 6
- 90 or more minutes: 4
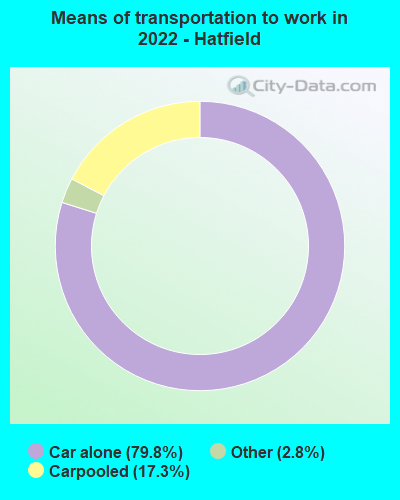
Means of transportation to work:
- Drove a car alone: 465 (63.2%)
- Carpooled: 106 (14.4%)
- Taxi: 20 (2.7%)
- Worked at home: 162 (22.0%)

- Unemployment by race in 2022
- Unemployment rate for White non-Hispanic residents
- 2.0%Males

- Year of entry for the foreign-born population in Hatfield, Massachusetts
- 562010 or later
- 342000 to 2009
- 01990 to 1999
- 91980 to 1989
- 01970 to 1979
- 0Before 1970

First ancestries reported:
- Irish: 139 (19.1%)
- Polish: 117 (16.1%)
- English: 72 (9.9%)
- French: 64 (8.8%)
- French Canadian: 24 (3.3%)
- Swedish: 23 (3.2%)
- Australian: 11 (1.5%)
- Eastern European: 9 (1.2%)
- German: 9 (1.2%)
- Czech: 6 (0.8%)
- Italian: 6 (0.8%)
- American: 3 (0.4%)
Most common places of birth for foreign-born residents (%):
| Hatfield: | 49.1% (53) |
| Massachusetts: | 2.7% (32,733) |
| Hatfield: | 32.4% (35) |
| Massachusetts: | 2.3% (27,810) |
| Hatfield: | 7.4% (8) |
| Massachusetts: | 1.0% (12,709) |
| Hatfield: | 6.5% (7) |
| Massachusetts: | 2.3% (28,158) |
| Hatfield: | 4.6% (5) |
| Massachusetts: | 0.9% (10,915) |
| Hatfield: | 2.8% (3) |
| Massachusetts: | 0.1% (851) |
Place of birth for U.S.-born residents:
- This state: 969
- Other state: 328
- Northeast: 189
- Midwest: 35
- South: 51
- West: 48
93.6% of Hatfield residents lived in the same house 1 years ago.
Out of people who lived in different houses, 11.0% lived in this county.
Out of people who lived in different counties, 82.5% lived in Massachusetts.
| Hatfield: | 93.6% |
| State average: | 87.7% |
Education attainment for males 25 years and older:
- No schooling: 20
- Nursery to 4th grade: 0
- 5th and 6th grade: 0
- 7th and 8th grade: 0
- 9th grade: 0
- 10th grade: 0
- 11th grade: 29
- 12th grade, no diploma: 0
- High school graduate (or equivalency): 91
- Less than 1 year of college: 12
- Some college more than 1 year, no degree: 68
- Associate degree: 40
- Bachelor's degree: 101
- Master's degree: 103
- Professional school degree: 0
- Doctorate degree: 16

Education attainment for females 25 years and older:
- No schooling: 0
- Nursery to 4th grade: 0
- 5th and 6th grade: 0
- 7th and 8th grade: 0
- 9th grade: 0
- 10th grade: 0
- 11th grade: 0
- 12th grade, no diploma: 0
- High school graduate (or equivalency): 139
- Less than 1 year of college: 44
- Some college more than 1 year, no degree: 34
- Associate degree: 62
- Bachelor's degree: 179
- Master's degree: 104
- Professional school degree: 12
- Doctorate degree: 10


Housing units in structures:
- One, detached: 374
- One, attached: 125
- Two: 55
- 3 or 4: 51
- 5 to 9: 26
- 20 to 49: 20
House/condo owner moved in on average 13 years ago
Renter moved in on average 5 years ago

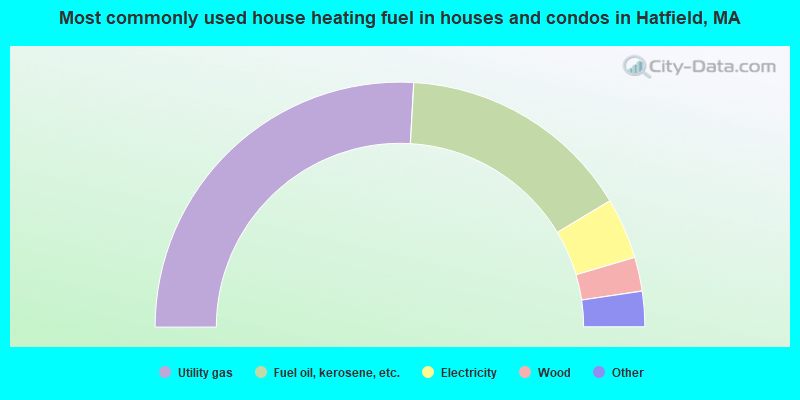
- 52.0%Utility gas
- 31.1%Fuel oil, kerosene, etc.
- 8.1%Electricity
- 4.5%Wood
- 2.6%Bottled, tank, or LP gas
- 1.7%Other fuel
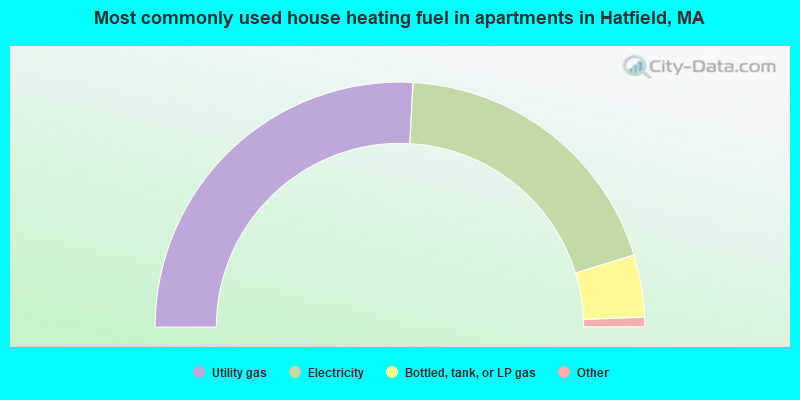
- 52.4%Utility gas
- 39.3%Electricity
- 8.3%Bottled, tank, or LP gas
Private vs. public school enrollment:
| Here: | 15.3% |
| Massachusetts: | 10.3% |
| Here: | 0.0% |
| Massachusetts: | 12.3% |
| Here: | 42.0% |
| Massachusetts: | 51.2% |


