Jump to a detailed profile or search site with Google Custom Search

Hawthorne, CA (California) Houses and Residents

Estimated median house or condo value in 2022: $764,700 (it was $184,800 in 2000)
Hawthorne:

$764,700
California:

$715,900
Lower value quartile - upper value quartile: $604,300 - $997,700

Mean price in 2022:

Detached houses: $833,078
Here:

$833,078
State:

$988,808

Townhouses or other attached units: $725,429
Here:

$725,429
State:

$838,546

In 2-unit structures: $1,888,932
Here:

$1,888,932
State:

$1,138,100

In 3-to-4-unit structures: $895,852
Here:

$895,852
State:

$824,253

In 5-or-more-unit structures: $613,371
Here:

$613,371
State:

$730,996

Mobile homes: $353,676
Here:

$353,676
State:

$184,506

Total population: 87,583 (Urban population: 83,963, Rural population: 0)

Houses: 31,566 (30,066 occupied: 7,645 owner occupied, 22,421 renter occupied)

% of renters here:

75%
State:

44%

Housing density: 5,209 houses/condos per square mile

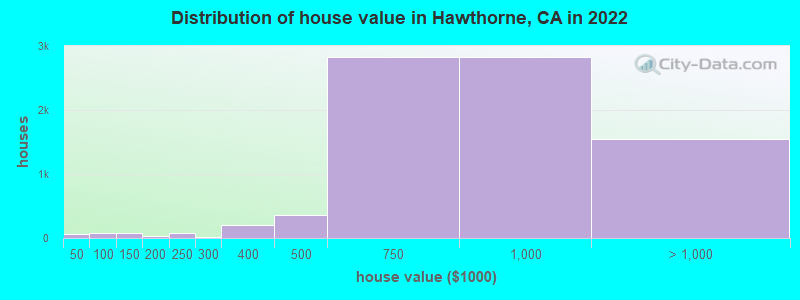
Median price asked for vacant for-sale houses and condos in 2022: $5,626,250.

Median contract rent in 2022: $1,535 (lower quartile is $1,298, upper quartile is $1,842)


Median rent asked for vacant for-rent units in 2022: $2,378


Median gross rent in Hawthorne, CA in 2022: $1,639

Housing units in Hawthorne with a mortgage: 6,164 (813 second mortgage, 0 home equity loan, 700 both second mortgage and home equity loan)
Houses without a mortgage: 0

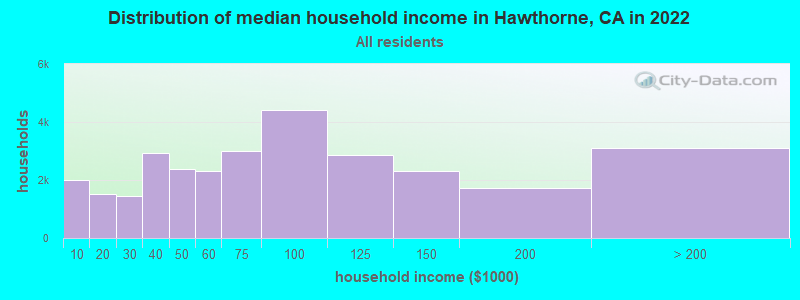
Median household income for houses/condos with a mortgage: $134,531

Median household income for apartments without a mortgage: $69,688

Median monthly housing costs: $1,665

Compare current foreclosures in Hawthorne, CA:

Check out more offers in Hawthorne, CA.
Powered by Foreclosure.com

Settings
X
Data:
Loading data...
Based on 2000-2022 data
Loading data...

123
Hide US histogram

Latest news about housing in Hawthorne, CA collected exclusively by city-data.com from local newspapers, TV, and radio stations

Hawthorne, California Age and Sex of Residents
Median year house/condo built: 1958

Median year apartment built: 1975

Household type by relationship:

Households: 84,564
  • Male householders: 13,998 (4,047 living alone), Female householders: 16,068 (3,994 living alone)
  • 11,620 spouses (11,536 opposite-sex spouses), 1,803 unmarried partners, (1,690 opposite-sex unmarried partners), 27,521 children (26,457 natural, 400 adopted, 664 stepchildren), 2,257 grandchildren, 1,471 brothers or sisters, 2,898 parents, 32 foster children, 2,073 other relatives, 4,106 non-relatives
  • In group quarters: 717

Size of family households: 6,366 2-persons, 4,897 3-persons, 4,244 4-persons, 2,815 5-persons, 1,093 6-persons, 294 7-or-more-persons.

Size of nonfamily households: 8,041 1-person, 1,736 2-persons, 218 3-persons, 222 4-persons, 140 5-persons.

10,681 married couples with children.
6,596 single-parent households (446 men, 6,150 women).

43.2% of residents of Hawthorne speak English at home.
46.0% of residents speak Spanish at home (59% speak English very well, 17% speak English well, 17% speak English not well, 7% don't speak English at all).
2.4% of residents speak other Indo-European language at home (63% speak English very well, 27% speak English well, 10% speak English not well, 1% don't speak English at all).
3.9% of residents speak Asian or Pacific Island language at home (57% speak English very well, 24% speak English well, 16% speak English not well, 3% don't speak English at all).
4.2% of residents speak other language at home (80% speak English very well, 16% speak English well, 3% speak English not well).

Foreign born population: 26,904 (31.8%)
(43.4% of them are naturalized citizens)

Median number of rooms in houses and condos:
Here:

5.9
State:

6.0

Median number of rooms in apartments
Here:

3.5
State:

3.9

Owner-occupied Renter-occupied
Bedrooms in owner-occupied houses and condos in Hawthorne, California
  • Bedrooms in owner-occupied houses and condos in Hawthorne, California
  • 214no bedroom
  • 2421 bedroom
  • 6022 bedrooms
  • 5,1013 bedrooms
  • 1,2754 bedrooms
  • 2115+ bedrooms
Bedrooms in renter-occupied apartments in Hawthorne, California
  • Bedrooms in renter-occupied apartments in Hawthorne, California
  • 2,985no bedroom
  • 8,0341 bedroom
  • 8,8762 bedrooms
  • 2,2903 bedrooms
  • 794 bedrooms
  • 1575+ bedrooms
Owner-occupied Renter-occupied
Cars and other vehicles available in Hawthorne in owner-occupied houses/condos
  • Cars and other vehicles available in Hawthorne in owner-occupied houses/condos
  • 184no vehicle
  • 1,5801 vehicle
  • 2,9282 vehicles
  • 1,9123 vehicles
  • 5854 vehicles
  • 4565+ vehicles
Cars and other vehicles available in Hawthorne in renter-occupied apartments
  • Cars and other vehicles available in Hawthorne in renter-occupied apartments
  • 2,596no vehicle
  • 9,7341 vehicle
  • 8,3082 vehicles
  • 1,3553 vehicles
  • 3504 vehicles
  • 785+ vehicles
Owner-occupied Renter-occupied
Rooms in owner-occupied houses in Hawthorne, California
  • Rooms in owner-occupied houses in Hawthorne, California
  • 1301 room
  • 2402 rooms
  • 2453 rooms
  • 7084 rooms
  • 1,7225 rooms
  • 1,8676 rooms
  • 1,4037 rooms
  • 1,0058 rooms
  • 3259+ rooms
Rooms in renter-occupied apartments in Hawthorne, California
  • Rooms in renter-occupied apartments in Hawthorne, California
  • 2,2981 room
  • 3,1432 rooms
  • 5,4783 rooms
  • 6,3674 rooms
  • 2,8605 rooms
  • 1,3396 rooms
  • 4147 rooms
  • 3318 rooms
  • 1919+ rooms
Year house built
Median 2022 house/condo value by year built
Median house/condo value by year householder moved into unit
Breakdown of mean house values by ages of householders
Owners and renters by unit type in Hawthorne, CA
  • Hawthorne, CA household income distribution

  • Distribution of median household income in Hawthorne, CA in 2022
  • 1,999Less than $10,000
  • 1,521$10,000 to $19,999
  • 1,464$20,000 to $29,999
  • 2,934$30,000 to $39,999
  • 2,385$40,000 to $49,999
  • 2,310$50,000 to $59,999
  • 3,017$60,000 to $74,999
  • 4,430$75,000 to $99,999
  • 2,874$100,000 to $124,999
  • 2,315$125,000 to $149,999
  • 1,719$150,000 to $199,999
  • 3,098$200,000 or more
  • Home value of owner - occupied houses in 2022 in Hawthorne, CA

  • Distribution of house value in Hawthorne, CA in 2022
  • 38Less than $10,000
  • 10$15,000 to $19,999
  • 8$40,000 to $49,999
  • 20$50,000 to $59,999
  • 18$60,000 to $69,999
  • 35$70,000 to $79,999
  • 73$100,000 to $124,999
  • 7$125,000 to $149,999
  • 25$175,000 to $199,999
  • 73$200,000 to $249,999
  • 18$250,000 to $299,999
  • 196$300,000 to $399,999
  • 360$400,000 to $499,999
  • 2,823$500,000 to $749,999
  • 2,830$750,000 to $999,999
  • 1,254$1,000,000 to $1,499,999
  • 218$1,500,000 to $1,999,999
  • 69$2,000,000 or more
  • Rent paid by renters in 2022 in Hawthorne, CA

  • Distribution of rent paid by renters in Hawthorne, CA in 2022
  • 23$100 to $149
  • 76$200 to $249
  • 157$250 to $299
  • 26$300 to $349
  • 60$350 to $399
  • 38$400 to $449
  • 0$450 to $499
  • 174$500 to $549
  • 33$550 to $599
  • 134$600 to $649
  • 21$650 to $699
  • 59$700 to $749
  • 77$750 to $799
  • 402$800 to $899
  • 324$900 to $999
  • 2,615$1,000 to $1,249
  • 5,255$1,250 to $1,499
  • 9,213$1,500 to $1,999
  • 1,431$2,000 to $2,499
  • 793$2,500 to $2,999
  • 323$3,000 to $3,499
  • 210$3,500 or more
  • 252No cash rent
Time Leaving Home To Go To Work in 2022

Percentage of workers working in this county: 96.7%
Number of people working at home: 3,996 (9.1% of all workers)

Travel time (in minutes) to work in 2022

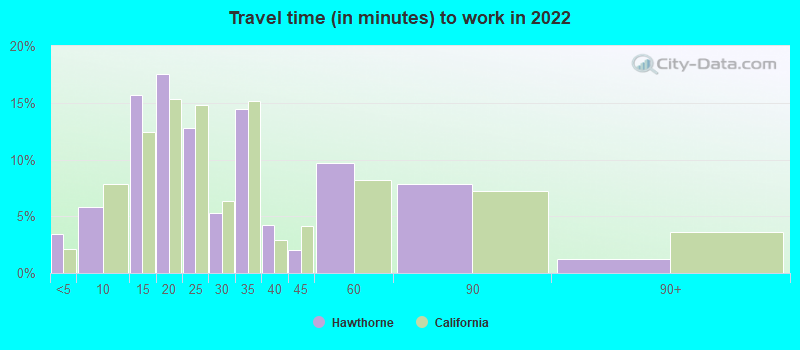
Travel time to work (commute)

  • Less than 5 minutes: 1,301
  • 5 to 9 minutes: 2,062
  • 10 to 14 minutes: 4,354
  • 15 to 19 minutes: 5,958
  • 20 to 24 minutes: 6,067
  • 25 to 29 minutes: 3,289
  • 30 to 34 minutes: 5,964
  • 35 to 39 minutes: 1,024
  • 40 to 44 minutes: 1,653
  • 45 to 59 minutes: 3,795
  • 60 to 89 minutes: 3,678
  • 90 or more minutes: 652
Means of transportation to work in 2022 - Hawthorne

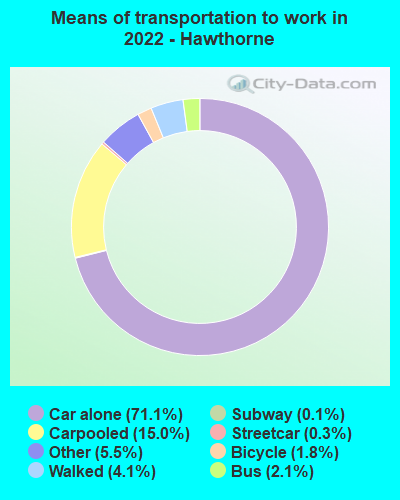
Means of transportation to work:

  • Drove a car alone: 17,396 (61.1%)
  • Carpooled: 3,663 (12.9%)
  • Bus: 509 (1.8%)
  • Subway or elevated rail: 75 (0.3%)
  • Long-distance train or commuter rail: 31 (0.1%)
  • Taxi: 1,336 (4.7%)
  • Bicycle: 435 (1.5%)
  • Walked: 1,009 (3.5%)
  • Worked at home: 3,996 (14.0%)
Class of Workers in 2022
  • Unemployment by race in 2022
  • Unemployment rate for White non-Hispanic residents
  • 5.8%Males
  • 1.5%Females
  • Unemployment rate for Black residents
  • 6.7%Males
  • 2.5%Females
  • Unemployment rate for American Indian and Alaska Native residents
  • 10.0%Males
  • 10.5%Females
  • Unemployment rate for Asian residents
  • 3.6%Males
  • 3.6%Females
  • Unemployment rate for other race residents
  • 1.2%Males
  • 3.1%Females
  • Unemployment rate for two or more race residents
  • 4.7%Males
  • 11.3%Females
  • Unemployment rate for Hispanic or Latino residents
  • 4.6%Males
  • 1.9%Females
Year of entry for the foreign-born population in Hawthorne, California
  • Year of entry for the foreign-born population in Hawthorne, California
  • 7,0492010 or later
  • 6,2022000 to 2009
  • 5,5591990 to 1999
  • 10,3631980 to 1989
  • 5,5151970 to 1979
  • 2,231Before 1970
Ancestries in Hawthorne, CA

First ancestries reported:

  • American: 2,408 (4.1%)
  • Nigerian: 1,246 (2.1%)
  • African: 880 (1.5%)
  • Ethiopian: 512 (0.9%)
  • Italian: 495 (0.8%)
  • German: 437 (0.7%)
  • English: 377 (0.6%)
  • Brazilian: 288 (0.5%)
  • Irish: 252 (0.4%)
  • Egyptian: 239 (0.4%)
  • European: 206 (0.3%)
  • French: 174 (0.3%)
  • Swedish: 143 (0.2%)
  • Jamaican: 143 (0.2%)
  • Polish: 130 (0.2%)
  • Jordanian: 126 (0.2%)
  • Sierra Leonean: 124 (0.2%)
  • Russian: 99 (0.2%)
  • Belizean: 97 (0.2%)
  • Iranian: 95 (0.2%)
  • Ghanaian: 66 (0.1%)
  • British: 61 (0.1%)
  • Moroccan: 59 (0.10%)
  • Ugandan: 53 (0.09%)
  • Armenian: 49 (0.08%)
  • Arab: 39 (0.07%)
  • Scottish: 35 (0.06%)
  • Eastern European: 33 (0.06%)
  • Turkish: 30 (0.05%)
  • Kenyan: 28 (0.05%)
  • Barbadian: 25 (0.04%)
  • French Canadian: 20 (0.03%)
  • Dutch: 20 (0.03%)
  • Romanian: 17 (0.03%)
  • Danish: 14 (0.02%)
  • Trinidadian and Tobagonian: 14 (0.02%)
  • Greek: 13 (0.02%)
  • Welsh: 13 (0.02%)
  • Haitian: 13 (0.02%)
  • Iraqi: 12 (0.02%)
  • Norwegian: 11 (0.02%)
  • New Zealander: 10 (0.02%)
  • British West Indian: 10 (0.02%)
  • Canadian: 8 (0.01%)
  • Northern European: 8 (0.01%)
  • Scotch-Irish: 7 (0.01%)
  • Ukrainian: 7 (0.01%)
  • Yugoslavian: 7 (0.01%)
  • Slovak: 6 (0.01%)

Most common places of birth for foreign-born residents (%):

Mexico
Hawthorne:

43.1% (11,901)
California:

37.2% (3,881,193)

Guatemala
Hawthorne:

8.3% (2,292)
California:

2.8% (290,436)

El Salvador
Hawthorne:

8.0% (2,197)
California:

4.2% (440,287)

Nigeria
Hawthorne:

6.4% (1,768)
California:

0.3% (35,557)

Philippines
Hawthorne:

4.8% (1,329)
California:

7.8% (818,297)

Vietnam
Hawthorne:

2.5% (690)
California:

4.9% (512,335)

Peru
Hawthorne:

2.0% (565)
California:

0.7% (74,025)

Cuba
Hawthorne:

1.9% (513)
California:

0.3% (30,441)

Colombia
Hawthorne:

1.6% (453)
California:

0.5% (55,249)

Place of birth for U.S.-born residents:

  • This state: 49,407
  • Other state: 7,418
  • Northeast: 1,763
  • Midwest: 2,535
  • South: 2,602
  • West: 518

89.9% of Hawthorne residents lived in the same house 1 years ago.
   Out of people who lived in different houses, 44.5% lived in this county.
   Out of people who lived in different counties, 42.6% lived in California.


Hawthorne:

89.9%
State average:

88.9%

Education attainment for males 25 years and older:

  • No schooling: 1,482
  • Nursery to 4th grade: 375
  • 5th and 6th grade: 336
  • 7th and 8th grade: 465
  • 9th grade: 481
  • 10th grade: 188
  • 11th grade: 576
  • 12th grade, no diploma: 1,145
  • High school graduate (or equivalency): 8,662
  • Less than 1 year of college: 1,377
  • Some college more than 1 year, no degree: 4,064
  • Associate degree: 1,956
  • Bachelor's degree: 4,849
  • Master's degree: 1,688
  • Professional school degree: 69
  • Doctorate degree: 188
Educational Attainment for Males

Education attainment for females 25 years and older:

  • No schooling: 1,354
  • Nursery to 4th grade: 140
  • 5th and 6th grade: 1,104
  • 7th and 8th grade: 233
  • 9th grade: 736
  • 10th grade: 625
  • 11th grade: 262
  • 12th grade, no diploma: 992
  • High school graduate (or equivalency): 6,865
  • Less than 1 year of college: 1,967
  • Some college more than 1 year, no degree: 4,545
  • Associate degree: 2,576
  • Bachelor's degree: 4,348
  • Master's degree: 2,381
  • Professional school degree: 439
  • Doctorate degree: 0
Educational Attainment for Females
Hawthorne marital status for males
Hawthorne marital status for females

Housing units in structures:

  • One, detached: 8,350
  • One, attached: 2,486
  • Two: 1,006
  • 3 or 4: 3,537
  • 5 to 9: 3,524
  • 10 to 19: 2,649
  • 20 to 49: 6,123
  • 50 or more: 3,773
  • Mobile homes: 118
Housing units lacking complete plumbing facilities in 2022: 1.2%

Housing units lacking complete kitchen facilities in 2022: 4.8%

House/condo owner moved in on average 16 years ago

Renter moved in on average 4 years ago

Year householders moved into residence in Hawthorne
Houses and condos Apartments
Most commonly used house heating fuel in houses and condos in Hawthorne, CA
  • 68.4%Utility gas
  • 24.4%Electricity
  • 3.5%No fuel used
  • 3.0%Bottled, tank, or LP gas
  • 0.4%Other fuel
  • 0.2%Solar energy
Most commonly used house heating fuel in apartments in Hawthorne, CA
  • 54.4%Utility gas
  • 35.8%Electricity
  • 8.2%No fuel used
  • 1.3%Bottled, tank, or LP gas
  • 0.3%Other fuel

Private vs. public school enrollment:

Students in private schools in grades 1 to 8 (elementary and middle school): 506
Here:

5.3%
California:

10.5%

Students in private schools in grades 9 to 12 (high school): 267
Here:

7.2%
California:

8.5%

Students in private undergraduate colleges: 782
Here:

13.0%
California:

15.9%
School Enrollment by Level of School for Male Students
School Enrollment by Level of School for Female Students
Age and Sex of Sensory-Disabled Noninstitutionalized Residents
Age and Sex of Physically-Disabled Noninstitutionalized Residents
Age and Sex of Mentally-Disabled Noninstitutionalized Residents
Age and Sex of Self-Care Disabled Noninstitutionalized Residents
Age and Sex of Go-Outside-Home Disabled Noninstitutionalized Residents
Age and Sex of Noninstitutionalized Residents with Employment Disability