Hazardville, CT (Connecticut) Houses and Residents
| Hazardville: | $238,224 |
| Connecticut: | $347,200 |
Mean price in 2022:
Detached houses: $233,467
Here: $233,467 State: $503,946 Townhouses or other attached units: $288,949
Here: $288,949 State: $304,959 In 2-unit structures: $149,053
Here: $149,053 State: $304,133
Total population: 4,599 (All urban)
Houses: 2,753 (2,577 occupied: 2,234 owner occupied, 372 renter occupied)
| % of renters here: | 14% |
| State: | 34% |
Housing density: 836 houses/condos per square mile
Median price asked for vacant for-sale houses and condos in 2022 in this county: $360,195.
Median contract rent in 2022: $1,015 (lower quartile is $810, upper quartile is $1,223)
Median gross rent in Hazardville, CT in 2022: $1,195
Housing units in Hazardville with a mortgage: 1,375 (132 second mortgage, 0 home equity loan, 105 both second mortgage and home equity loan)
Houses without a mortgage: 33
Median household income for houses/condos with a mortgage: $119,592
Median household income for apartments without a mortgage: $67,008
Median monthly housing costs: $1,300
Compare current foreclosures near Hazardville, CT:
| Photo | Address | Area | Beds / Baths | Price | Details |
|---|---|---|---|---|---|

|
#1
Newberry Rd
South Windsor, CT 06074
|
3,386 sq. feet
|
2 baths 4 beds |
$644,900
|
show details |

|
#2
Kozley Rd
Tolland, CT 06084
|
1,132 sq. feet
|
2 baths 3 beds |
$264,900
|
show details |

|
#3
Sanford Ave
Enfield, CT 06082
|
21 sq. feet
|
1 baths 4 beds |
$225,000
|
show details |

|
#4
Jondot Dr
Enfield, CT 06082
|
1,385 sq. feet
|
1 baths 3 beds |
$299,900
|
show details |

|
#5
Irving St
Manchester, CT 06042
|
1,335 sq. feet
|
2 baths 3 beds |
$251,750
|
show details |

|
#6
Mountain Rd
Windsor, CT 06095
|
1,144 sq. feet
|
2 baths 3 beds |
$230,000
|
show details |

|
#7
Reservoir Rd
Vernon Rockville, CT 06066
|
1,288 sq. feet
|
2 baths 3 beds |
$379,900
|
show details |

|
#8
Walnut Street
Springfield, MA 01105
|
2,850 sq. feet
|
2 baths 6 beds |
$99,900
|
show details |

|
#9
W Franklin St
Holyoke, MA 01040
|
1,558 sq. feet
|
1 baths 2 beds |
$234,900
|
show details |

|
#10
Shares Ln
South Windsor, CT 06074
|
1,850 sq. feet
|
2 baths 4 beds |
$365,000
|
show details |
| Photo | Address | Area | Beds / Baths | Price | Details |
|---|---|---|---|---|---|

|
#11
Cooper Hill St # 150
Manchester, CT 06040
|
760 sq. feet
|
1 baths 2 beds |
$119,600
|
show details |

|
#12
Newman St
Springfield, MA 01105
|
1,676 sq. feet
|
2 baths 3 beds |
$45,900
|
show details |

|
#13
E School St
West Springfield, MA 01089
|
1,905 sq. feet
|
2 baths 4 beds |
show details | |

|
#14
Burnside Ave Apt 4
East Hartford, CT 06108
|
870 sq. feet
|
2 baths 2 beds |
show details | |

|
#15
Crystal Lake Rd
Tolland, CT 06084
|
1,498 sq. feet
|
3 baths 5 beds |
show details | |

|
#16
Rockwell Ave
Bloomfield, CT 06002
|
1,438 sq. feet
|
3 baths 3 beds |
show details | |

|
#17
Powder Ridge Rd
Enfield, CT 06082
|
1,248 sq. feet
|
1 baths 3 beds |
show details | |

|
#18
Laraia Ave
East Hartford, CT 06108
|
1,530 sq. feet
|
2 baths 4 beds |
show details | |

|
#19
Hovey Rd
Monson, MA 01057
|
2,256 sq. feet
|
1 baths 4 beds |
show details | |

|
#20
Cambridge Ct
Simsbury, CT 06070
|
2,155 sq. feet
|
4 baths 4 beds |
show details |
| Photo | Address | Area | Beds / Baths | Price | Details |
|---|---|---|---|---|---|

|
#21
Eva Cir
Vernon Rockville, CT 06066
|
1,256 sq. feet
|
2 baths 3 beds |
show details | |

|
#22
Applewood Rd
Bloomfield, CT 06002
|
1,250 sq. feet
|
3 baths 3 beds |
show details | |

|
#23
Thompson Rd # 2g
Manchester, CT 06040
|
734 sq. feet
|
1 baths 1 beds |
show details | |

|
#24
Westford Cir
Springfield, MA 01109
|
3,142 sq. feet
|
3 baths 6 beds |
show details | |

|
#25
Frink St
Chicopee, MA 01020
|
1,200 sq. feet
|
2 baths 3 beds |
show details | |

|
#26
Tower Ave
Hartford, CT 06120
|
3,562 sq. feet
|
2 baths 4 beds |
show details | |

|
#27
Franklin St
Vernon Rockville, CT 06066
|
728 sq. feet
|
1 baths 2 beds |
show details | |

|
#28
Greenlawn St
East Hartford, CT 06108
|
1,296 sq. feet
|
1 baths 3 beds |
show details | |

|
#29
Basswood Rd
Windsor, CT 06095
|
1,732 sq. feet
|
3 baths 3 beds |
show details | |

|
#30
Talcottville Rd # 9
Vernon Rockville, CT 06066
|
1,165 sq. feet
|
2 baths 2 beds |
show details |
| Photo | Address | Area | Beds / Baths | Price | Details |
|---|---|---|---|---|---|

|
#31
Kenyon St
Springfield, MA 01109
|
2,602 sq. feet
|
2 baths 7 beds |
show details | |

|
#32
Wilson Ln
Vernon Rockville, CT 06066
|
912 sq. feet
|
1 baths 3 beds |
show details | |

|
#33
Willie Cir
Tolland, CT 06084
|
1,356 sq. feet
|
2 baths 4 beds |
show details | |

|
#34
Ellington Rd
East Hartford, CT 06108
|
1,721 sq. feet
|
2 baths 2 beds |
show details | |

|
#35
Merrow Rd
Tolland, CT 06084
|
2,075 sq. feet
|
2 baths 2 beds |
show details | |

|
#36
River St
Vernon Rockville, CT 06066
|
2,462 sq. feet
|
4 baths 4 beds |
show details | |

|
#37
Burnside Ave
East Hartford, CT 06108
|
1,320 sq. feet
|
2 baths 2 beds |
show details | |

|
#38
Shoemaker Ln
Feeding Hills, MA 01030
|
1,421 sq. feet
|
3 baths 4 beds |
show details | |

|
#39
Linwood Dr
Bloomfield, CT 06002
|
1,190 sq. feet
|
2 baths 3 beds |
show details | |

|
#40
Florence Rd
Bloomfield, CT 06002
|
1,328 sq. feet
|
2 baths 3 beds |
show details |
| Photo | Address | Area | Beds / Baths | Price | Details |
|---|---|---|---|---|---|

|
#41
Maple St
Vernon Rockville, CT 06066
|
1,087 sq. feet
|
2 baths 2 beds |
show details | |

|
#42
Ferndale Dr
Manchester, CT 06040
|
1,246 sq. feet
|
2 baths 3 beds |
show details | |

|
#43
Christopher Ct
East Hartford, CT 06108
|
1,051 sq. feet
|
1 baths 2 beds |
show details | |

|
#44
Main St
East Hartford, CT 06108
|
1,411 sq. feet
|
2 baths 4 beds |
show details | |

|
#45
Hancock St
Westfield, MA 01085
|
1,448 sq. feet
|
1 baths 2 beds |
show details | |

|
#46
Washington St
Westfield, MA 01085
|
1,300 sq. feet
|
2 baths 3 beds |
show details | |

|
#47
Boston Tpke
Coventry, CT 06238
|
2,416 sq. feet
|
2 baths 4 beds |
show details | |

|
#48
Talcott Ave
Vernon Rockville, CT 06066
|
2,367 sq. feet
|
2 baths 5 beds |
show details | |

|
#49
Hillsdale Dr
Ellington, CT 06029
|
1,597 sq. feet
|
3 baths 4 beds |
show details | |

|
Check over 1 million property listings on Foreclosure.com!
|
browse all offers | |||
Latest news about housing in Hazardville, CT collected exclusively by city-data.com from local newspapers, TV, and radio stations


Median year apartment built: 1984
Household type by relationship:
Households: 6,148- Male householders: 1,163 (297 living alone), Female householders: 1,409 (467 living alone)
1,384 spouses (1,369 opposite-sex spouses), 162 unmarried partners, (162 opposite-sex unmarried partners), 1,305 children (1,263 natural, 15 adopted, 27 stepchildren), 88 grandchildren, 60 brothers or sisters, 84 parents, 0 foster children, 43 other relatives, 148 non-relatives
- In group quarters: 297
Size of family households: 812 2-persons, 486 3-persons, 202 4-persons, 95 5-persons, 19 6-persons.
Size of nonfamily households: 807 1-person, 149 2-persons, 26 3-persons, 4 4-persons.
661 married couples with children.
193 single-parent households (52 men, 141 women).
90.8% of residents of Hazardville speak English at home.
4.1% of residents speak Spanish at home (83% speak English very well, 16% speak English well).
4.4% of residents speak other Indo-European language at home (76% speak English very well, 10% speak English well, 14% speak English not well).
0.3% of residents speak Asian or Pacific Island language at home (56% speak English very well, 31% speak English well, 12% speak English not well).
Foreign born population: 226 (3.7%)
(77.9% of them are naturalized citizens)
| Here: | 5.8 |
| State: | 6.5 |
| Here: | 4.1 |
| State: | 4.0 |

- Bedrooms in owner-occupied houses and condos in Hazardville, Connecticut
- 9no bedroom
- 631 bedroom
- 2832 bedrooms
- 1,4203 bedrooms
- 4404 bedrooms
- 195+ bedrooms

- Bedrooms in renter-occupied apartments in Hazardville, Connecticut
- 42no bedroom
- 911 bedroom
- 1542 bedrooms
- 733 bedrooms
- 134 bedrooms
- 05+ bedrooms

- Cars and other vehicles available in Hazardville in owner-occupied houses/condos
- 50no vehicle
- 4961 vehicle
- 1,1262 vehicles
- 2883 vehicles
- 2624 vehicles
- 125+ vehicles

- Cars and other vehicles available in Hazardville in renter-occupied apartments
- 60no vehicle
- 1721 vehicle
- 732 vehicles
- 563 vehicles
- 54 vehicles
- 65+ vehicles

- Rooms in owner-occupied houses in Hazardville, Connecticut
- 91 room
- 82 rooms
- 473 rooms
- 844 rooms
- 7915 rooms
- 5316 rooms
- 3697 rooms
- 2748 rooms
- 1219+ rooms

- Rooms in renter-occupied apartments in Hazardville, Connecticut
- 421 room
- 402 rooms
- 473 rooms
- 804 rooms
- 1235 rooms
- 196 rooms
- 217 rooms
- 08 rooms
- 09+ rooms


Hazardville, CT household income distribution

- 108Less than $10,000
- 147$10,000 to $19,999
- 105$20,000 to $29,999
- 148$30,000 to $39,999
- 108$40,000 to $49,999
- 203$50,000 to $59,999
- 280$60,000 to $74,999
- 275$75,000 to $99,999
- 375$100,000 to $124,999
- 223$125,000 to $149,999
- 277$150,000 to $199,999
- 350$200,000 or more

Home value of owner - occupied houses in 2022 in Hazardville, CT
-
- 11Less than $10,000
- 38$15,000 to $19,999
- 8$80,000 to $89,999
- 21$90,000 to $99,999
- 44$100,000 to $124,999
- 41$125,000 to $149,999
- 337$150,000 to $174,999
- 150$175,000 to $199,999
- 593$200,000 to $249,999
- 383$250,000 to $299,999
- 282$300,000 to $399,999
- 67$400,000 to $499,999
- 13$500,000 to $749,999
- 16$750,000 to $999,999

Rent paid by renters in 2022 in Hazardville, CT
-
- 14$150 to $199
- 21$550 to $599
- 3$650 to $699
- 33$700 to $749
- 52$800 to $899
- 37$900 to $999
- 111$1,000 to $1,249
- 32$1,250 to $1,499
- 35$1,500 to $1,999
- 29No cash rent

Percentage of workers working in this county: 83.8%
Number of people working at home: 300 (9.2% of all workers)
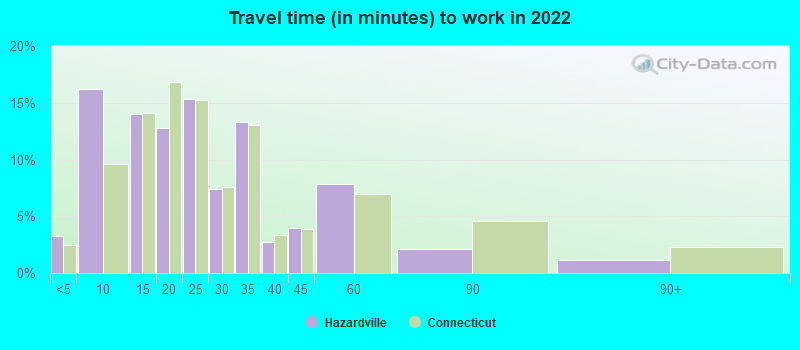
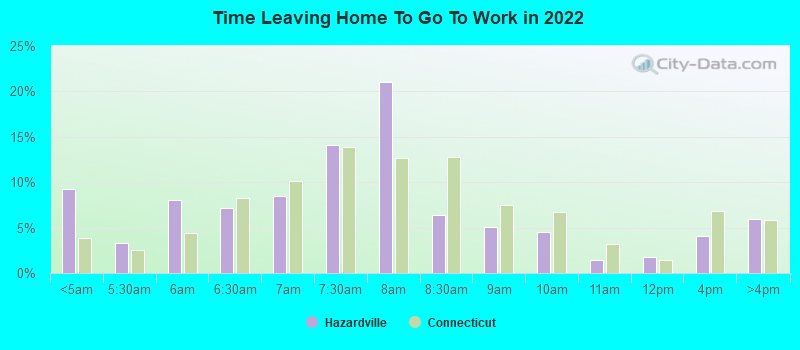
Travel time to work (commute)
- Less than 5 minutes: 104
- 5 to 9 minutes: 287
- 10 to 14 minutes: 270
- 15 to 19 minutes: 338
- 20 to 24 minutes: 591
- 25 to 29 minutes: 276
- 30 to 34 minutes: 630
- 35 to 39 minutes: 172
- 40 to 44 minutes: 8
- 45 to 59 minutes: 90
- 60 to 89 minutes: 89
- 90 or more minutes: 55
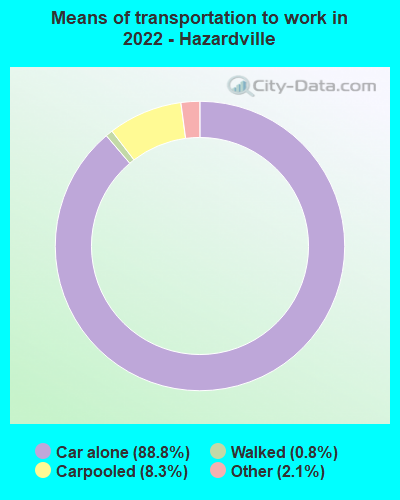
Means of transportation to work:
- Drove a car alone: 2,533 (78.2%)
- Carpooled: 252 (7.8%)
- Taxi: 72 (2.2%)
- Walked: 23 (0.7%)
- Worked at home: 300 (9.3%)
- Unemployment by race in 2022
- Unemployment rate for White non-Hispanic residents
- 3.2%Males
- 3.6%Females
- Unemployment rate for two or more race residents
- 1.5%Males
- 9.9%Females
- Unemployment rate for Hispanic or Latino residents
- 6.3%Females

- Year of entry for the foreign-born population in Hazardville, Connecticut
- 532010 or later
- 492000 to 2009
- 371990 to 1999
- 391980 to 1989
- 01970 to 1979
- 57Before 1970
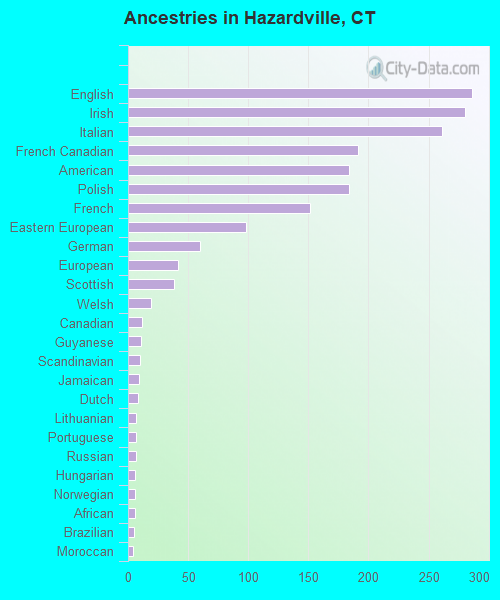
First ancestries reported:
- English: 286 (12.6%)
- Irish: 280 (12.3%)
- Italian: 261 (11.5%)
- French Canadian: 191 (8.4%)
- American: 184 (8.1%)
- Polish: 184 (8.1%)
- French: 151 (6.6%)
- Eastern European: 98 (4.3%)
- German: 60 (2.6%)
- European: 42 (1.8%)
- Scottish: 38 (1.7%)
- Welsh: 19 (0.8%)
- Canadian: 12 (0.5%)
- Guyanese: 11 (0.5%)
- Scandinavian: 10 (0.4%)
- Jamaican: 9 (0.4%)
- Dutch: 8 (0.4%)
- Lithuanian: 7 (0.3%)
- Portuguese: 7 (0.3%)
- Russian: 7 (0.3%)
- Hungarian: 6 (0.3%)
- Norwegian: 6 (0.3%)
- African: 6 (0.3%)
- Brazilian: 5 (0.2%)
- Moroccan: 4 (0.2%)
- Turkish: 4 (0.2%)
- Armenian: 3 (0.1%)
- Czechoslovakian: 3 (0.1%)
Most common places of birth for foreign-born residents (%):
| Hazardville: | 18.6% (42) |
| Connecticut: | 4.0% (21,729) |
| Hazardville: | 16.8% (38) |
| Connecticut: | 0.0% (222) |
| Hazardville: | 10.6% (24) |
| Connecticut: | 2.8% (15,141) |
| Hazardville: | 10.2% (23) |
| Connecticut: | 4.7% (25,461) |
| Hazardville: | 4.9% (11) |
| Connecticut: | 0.2% (1,130) |
| Hazardville: | 4.4% (10) |
| Connecticut: | 7.5% (40,568) |
| Hazardville: | 4.0% (9) |
| Connecticut: | 1.3% (7,149) |
| Hazardville: | 4.0% (9) |
| Connecticut: | 1.9% (10,545) |
| Hazardville: | 3.5% (8) |
| Connecticut: | 0.9% (5,157) |
| Hazardville: | 3.1% (7) |
| Connecticut: | 7.3% (39,879) |
| Hazardville: | 3.1% (7) |
| Connecticut: | 0.3% (1,663) |
| Hazardville: | 2.2% (5) |
| Connecticut: | 0.4% (1,914) |
| Hazardville: | 1.8% (4) |
| Connecticut: | 2.3% (12,380) |
Place of birth for U.S.-born residents:
- This state: 3,537
- Other state: 2,298
- Northeast: 2,006
- Midwest: 48
- South: 172
- West: 87
93.8% of Hazardville residents lived in the same house 1 years ago.
Out of people who lived in different houses, 23.7% lived in this county.
Out of people who lived in different counties, 15.3% lived in Connecticut.
| Hazardville: | 93.8% |
| State average: | 88.4% |
Education attainment for males 25 years and older:
- No schooling: 2
- Nursery to 4th grade: 22
- 5th and 6th grade: 26
- 7th and 8th grade: 0
- 9th grade: 5
- 10th grade: 9
- 11th grade: 53
- 12th grade, no diploma: 78
- High school graduate (or equivalency): 877
- Less than 1 year of college: 208
- Some college more than 1 year, no degree: 400
- Associate degree: 252
- Bachelor's degree: 404
- Master's degree: 98
- Professional school degree: 33
- Doctorate degree: 10

Education attainment for females 25 years and older:
- No schooling: 14
- Nursery to 4th grade: 0
- 5th and 6th grade: 0
- 7th and 8th grade: 0
- 9th grade: 11
- 10th grade: 0
- 11th grade: 15
- 12th grade, no diploma: 21
- High school graduate (or equivalency): 631
- Less than 1 year of college: 103
- Some college more than 1 year, no degree: 439
- Associate degree: 329
- Bachelor's degree: 600
- Master's degree: 175
- Professional school degree: 30
- Doctorate degree: 8


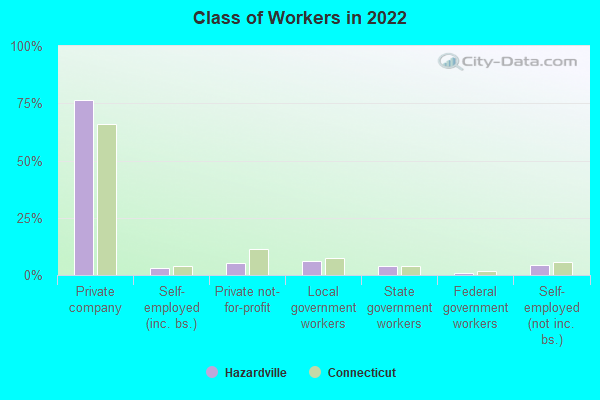
Housing units in structures:
- One, detached: 2,271
- One, attached: 84
- Two: 86
- 3 or 4: 127
- 5 to 9: 52
- 10 to 19: 45
- 20 to 49: 19
- 50 or more: 66
House/condo owner moved in on average 17 years ago
Renter moved in on average 2 years ago


- 79.1%Fuel oil, kerosene, etc.
- 14.7%Utility gas
- 3.1%Electricity
- 1.2%Bottled, tank, or LP gas
- 0.9%Wood
- 0.9%Other fuel
- 0.2%No fuel used

- 46.7%Fuel oil, kerosene, etc.
- 26.2%Utility gas
- 21.3%Electricity
- 5.7%Wood
Private vs. public school enrollment:
| Here: | 15.4% |
| Connecticut: | 9.5% |
| Here: | 16.0% |
| Connecticut: | 12.9% |
| Here: | 22.2% |
| Connecticut: | 35.5% |


